FABL PSX CHART ANALYSIS 5-FEB-26Stop Loss:105.74PKR
Sell Stop:96.01PKR
Take Profit 1:86.01PKR
Take Profit 2:76.99PKR
Take Profit 3:67.97PKR
After a bullish trend divergence has formed and we would expect the trend has been reversal and after hitting sell stop we expect that market will hit the take profits.
⚠️ Always remember to protect your capital with a proper stop-loss and disciplined risk management.
Bullish on Bigger tf.TOMCL Analysis
Closed at 51.76 (04-02-2026)
Bullish on Bigger tf.
ABCD pattern appearing.
68 - 70 should be crossed with Good Volumes
& Sustained for the Point D Target.
Immediate Resistance is around 55.
On the flip side, Immediate Support levels are
around 50 & then around 45 - 46.
MEBL – Trade Management & Exit Strategy UpdateThis idea was published 30-01-2026.
Price has respected the bullish structure, TP1 has already been achieved, and the move is now extending toward TP2.
⚠️ This is NOT a fresh buy or sell call.
This post reflects my personal trade management approach and is shared for educational purposes only.
No dividend-based holding is considered at this stage — the focus is strictly on price appreciation.
🔹 Exit Strategy 1
If price reaches the second profit zone (TP2) with strength, the plan is to exit the full position near maximum price appreciation.
🔹 Exit Strategy 2
Sell 70–80% of the position near TP2
Hold the remaining 20–30% with a 2% trailing stop loss
Exit completely once the trailing SL is triggered
The objective is to lock profits on strength and consider re-entry only after a healthy pullback or a fresh technical setup.
Educational only. Not financial advice.
THCCLStock has completed a long consolidation phase
Previous breakout was followed by a controlled correction
Price is bouncing from the 70–72 support zone
RSI recovering from oversold, indicating potential momentum shift
Trend remains constructively bullish above 70
Targets: 84 → 97 → 109 → 121 (long term
GHNI: (DAILY TIME FRAME) TRADE PLAN
## 📊 GHNI – Trade Plan (Daily Time Frame)
## 🟦 Key Levels
* **Major Resistance:** `945 – 950`
* **Immediate Support:** `910`
* **Strong Demand Zone:** `800 – 820`
* **Target Resistance Zone:** `1095
### 🟢 Buy Condition
* **BUY only if daily candle CLOSES ABOVE:** `945`
### 🎯 Targets
* **Primary Target (TP):** `1095`
* (Optional partial profit near `1020–1050` if momentum slows)
### 🛑 Stop Loss
* **Stop Loss:** `812`
* Below demand + structure low → logical & safe SL
## 📈 Indicator Confirmation
**RSI (14):**
* Around **62–63**
**MACD:**
* Bullish crossover
* Histogram turning positive → momentum building
## 🧠 Trade Summary
> **Bias:** Bullish
> **Strategy:** Breakout & continuation
> **Risk–Reward:** Very favorable
> **Best For:** Swing traders / positional traders
Currently in a Consolidation Box & at Channel Bottom.PREMA Analysis
Closed at 38.95 (22-01-2026)
Currently in a Consolidation Box & at Channel Bottom.
Also there is Strong Trendline support around 38 - 39.
If this level is sustained, we may witness an upside towards 42 - 43 initially.
The Uptrend will only start once it crosses & Sustained its previous Resistance
around 44.
WAVES - PSX - Buy CallWAVES, on daily tf, was moving gradually upwards, It tested previous HH and due to profit booking took a small dip and now once again after testing the previous HH it has crossed it and gone up breaking the resistance.
KVO is also suggesting that volume are kicking in towards buy.
RSI is also reaching 70 mark indicating bullish momentum.
AB=CD pattern has been drawn to arrive to apparent TP of 11% gains; although it is very much likely to test 20 as well using Pole and Flag method.
Trade values:
Buy: 16.57 (CMP)
SL: 14.60
TP-1: 18.33
TP-2: 20
HINOON – Swing Trade Idea | Technical Analysis
HINOON has shown a positive reaction from an important technical confluence zone after a prolonged downtrend. This area also aligns with previous resistance turning into support, strengthening its significance. Price has delivered a clear bounce from the Fibonacci golden pocket (61.8% – 50%), which is historically considered a strong demand zone. Alongside this bounce, a bullish RSI divergence is visible, signaling weakening selling pressure.
Price is still trading below the descending trendline, however downside momentum has noticeably slowed. A confirmed breakout above this trendline would act as additional confirmation and significantly improve the probability of a trend reversal.
From a volume perspective, signs of selling exhaustion are present, while recent candles have closed with rejection wicks, indicating active buyer participation at lower levels. Overall, the structure suggests an early reversal / accumulation phase.
Trade Setup (Aggressive & Conservative)
Aggressive Entry:
– Buy near CMP (current market price)
– Entry based on RSI bullish divergence + golden pocket bounce
Confirmation Entry:
– Buy on a trendline breakout above 1058 with a daily close
– This provides stronger confirmation, though the stop-loss will be wider
Stop Loss:
🛑 985 (daily closing basis)
Upside Targets (Step-by-Step)
🎯 1090 – First resistance
🎯 1130 – Range supply
🎯 1180 – Previous structure high
🎯 1220 – Major resistance
🚀 1241 – Breakout level (trend reversal confirmation)
Conclusion
The combination of RSI bullish divergence, Fibonacci golden pocket support, and selling exhaustion makes this a high-probability swing setup. A trendline breakout would further strengthen the bullish case.
📌 Technical analysis only. Not financial advice.
IBLHL – 4H | Trade Update & Technical Analysis
IBLHL was bought yesterday near the 59–60 zone before market close, which aligns with a clearly defined demand / base support area on the 4H chart. This zone has previously acted as strong support, making the entry technically well-justified.
Price has now reacted positively from this support, showing early signs of stabilization. The current move looks more like controlled accumulation rather than a dead-cat bounce, suggesting that selling pressure is fading.
On the momentum side, RSI (4H) has started to curl up from oversold levels, indicating exhaustion of sellers and a potential short-term trend reversal. While RSI is still in neutral territory, the structure supports further upside as long as support holds.
Volume behavior also supports this view, as lower levels show signs of absorption, with recent candles printing lower wicks — a clear sign of buyer interest.
Trade Plan
Buy Zone: 59 – 60
Stop Loss: 56 (closing basis)
Targets:
🎯 63 – First resistance
🎯 67 – Range supply
🎯 70.50 – Major resistance / trend confirmation level
SAZEW - PSX - Technical AnalysisOn daily TF, after a phenomenal bull run, SAZEW has retraced Fib 25%.
Anchored Volume Profile has been used to identify the area of maximum participation (Volume).
Since Fib 30% and Fib 38% also coinciding with a big participation, therefore, it should test 1730 and then 1670. If price continues to go down then it will test Fib 55% to 60% zone.
Technically correct and very safe buying in expected bull run is 2075. However, buying at discounted level of 1645 or 1485~1500 are also very good.
However, buying at nearest support of 1720 may be a risky affair.
Although RSI suggest a small hidden bullish divergence which might take prices a bit up till 1890 where exists a strong resistance as well. Therefore, risking for mere 5% gain is not logical.
SCL - PSX - Technical AnalysisOn daily TF, price has been making cap after cap. Now volume has started to fall, therefore, it is expected that price will test 625~630 region and will drop sharply due to profit booking.
New entries should be avoided.
Then it is expected to drop around 425~440 region and will stay there for around 6 weeks before again going up.
Ideally buying should be initiated once price bounces back from 425~440 region and crosses 450. Then Target Price should be 620 and then 7690.
HUBC HUB POWER PSX PSX - HUB POWER (HUBC) – Day Level Technical & Fundamental Outlook
🔹 Technical View (4 Points)
Sharing Tragets For HUBC, Dut to geopolitical senarios, rest buying was done couple of days ago.
How to Counter Geopolictical Senario:
Important after first (TP1) reached move your SL to Entry Point (that is Buy Zone 1)
When price reaches TP2 Move SL to Buy zone , and book some profits. Manage risk and reward.
Higher High–Higher Low structure intact, price respecting the rising trend channel.
Multiple Buy Zones holding above trendline, indicating strong demand on pullbacks.
RSI near mid-range (55–60) – bullish momentum without overbought pressure.
Upside targets aligned at TP1–TP3, with risk clearly defined below 221 SL.
🔹 Fundamental View (4 Points)
Positive outlook from upcoming BYD-related auto sector sales momentum, improving overall market sentiment.
Car bookings and demand trend improving, supporting economic activity and power consumption growth.
Expected EPS growth driven by stable cash flows, capacity utilization, and operational efficiency.
Defensive power sector positioning, offering stability amid market volatility with dividend support.
FATIMA – Daily Technical & Trade Outlook
FATIMA continues to trade within a well-defined ascending channel, maintaining its overall bullish structure. Alhamdulillah, the stock has already delivered a strong move earlier from 147 to 175, and some members may still be holding partial quantities from that rally.
Currently, price is consolidating near the upper half of the rising channel, indicating strength rather than distribution. Despite short-term volatility, the broader trend remains intact as long as the stock holds above key channel support.
Trade Plan:
For Existing Holders:
Those already holding FATIMA can continue to hold their positions, as the primary trend remains bullish.
For Fresh Buyers:
Aggressive Entry: Near CMP around 184
Secondary Entry (on pullback): Around 175 (channel support / demand zone)
Targets:
First Target: 200
Extended Target: 213
Risk & Structure Notes:
This is an aggressive trade, so price may show short-term pullbacks.
RSI is near the higher zone, suggesting momentum is strong, but temporary cooling or consolidation is possible before continuation.
As long as price respects the rising channel, dips can be considered healthy corrections, not trend reversal.
Risk Management & Long-Term View:
FATIMA remains a long-term conviction stock. If price moves temporarily against the trade, dip-based averaging can be considered — but only according to individual risk appetite and position sizing discipline.
Conclusion:
Overall trend remains bullish within the ascending channel. Pullbacks toward support can offer opportunities, while a breakout above recent highs may accelerate the move toward higher targets.
📌 Trade responsibly and align position size with your risk tolerance.
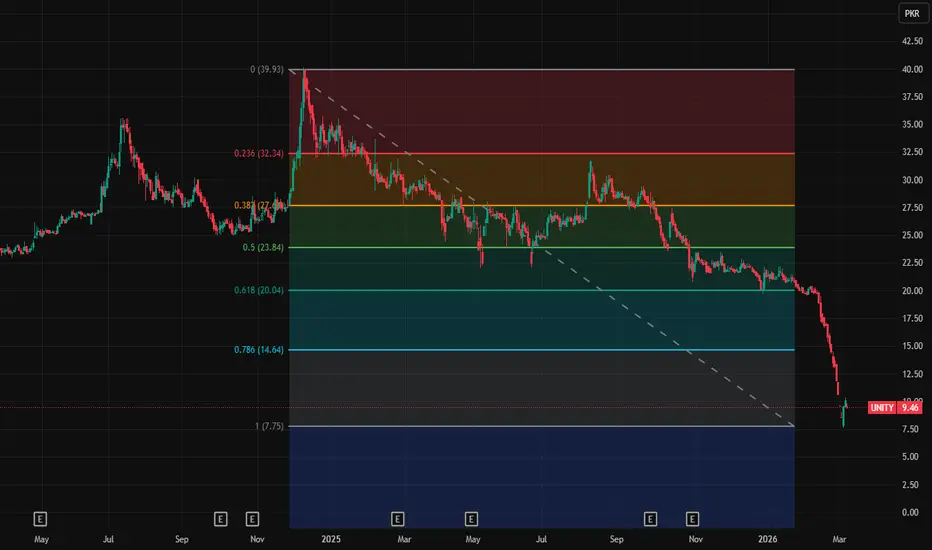
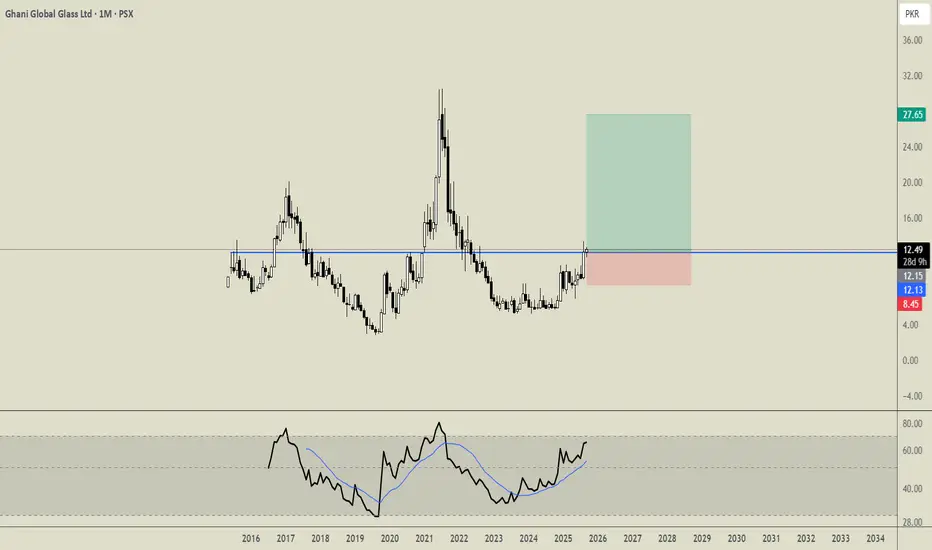
Bullish Divergence on bigger time frames.
Currently in a Consolidation box.
Those who cant wait for long, should wait
for the breakout around 9.
Upside targets can be around 11 - 11.50
initially.
Strong Support seems to be around 6.
On the flip side, if this Support is broken,
the next levels would be around 3.