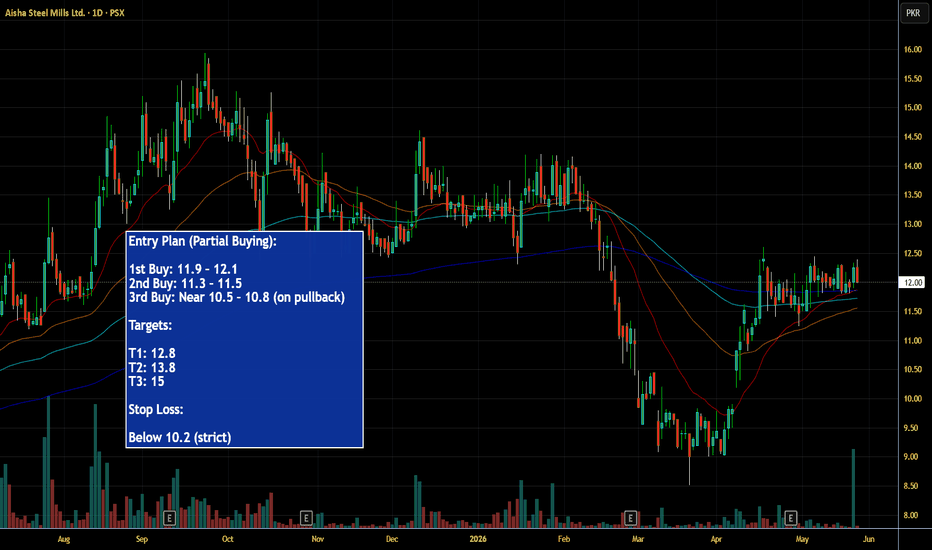
ASL – Early Recovery + Base Formation SetupASL appears to be stabilizing after a major correction phase. The stock has formed a strong base around the 9–10 zone and is now consolidating near 12 resistance, which could act as a breakout trigger if volume expands further.
This is an early recovery + accumulation setup. A sustained move above 12.2–12.5 with strong volume can trigger fresh bullish momentum and shift the structure toward a stronger recovery trend.
Since the stock is still in rebuilding mode after a sharp decline, gradual movement and consolidations are expected.
Note:
Higher lows near support + improving price stability suggest accumulation activity 🔥
If buying pressure continues, ASL can gradually recover toward previous resistance zones.
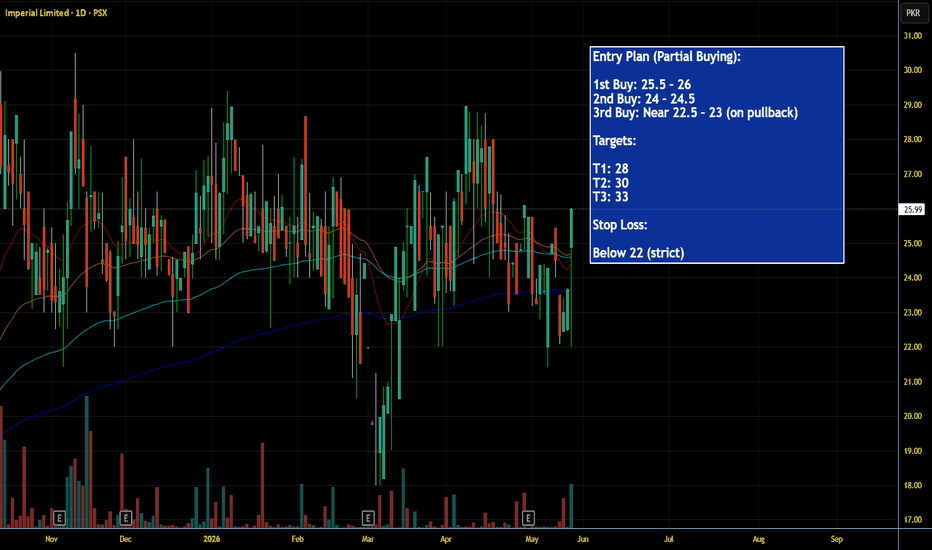
IML – Accumulation Breakout SetupThis is an accumulation + breakout attempt setup. A sustained move above 26 with strong volume can trigger momentum expansion toward higher resistance zones.
Since the stock has remained range-bound for a long period, breakout confirmation is important before expecting aggressive upside.
Note:
Tight consolidation + rising volume near resistance often signals smart money positioning 🔥
If buying pressure continues, IML can shift into a stronger trending phase.
Educational Purpose Only — Not Financial Advice
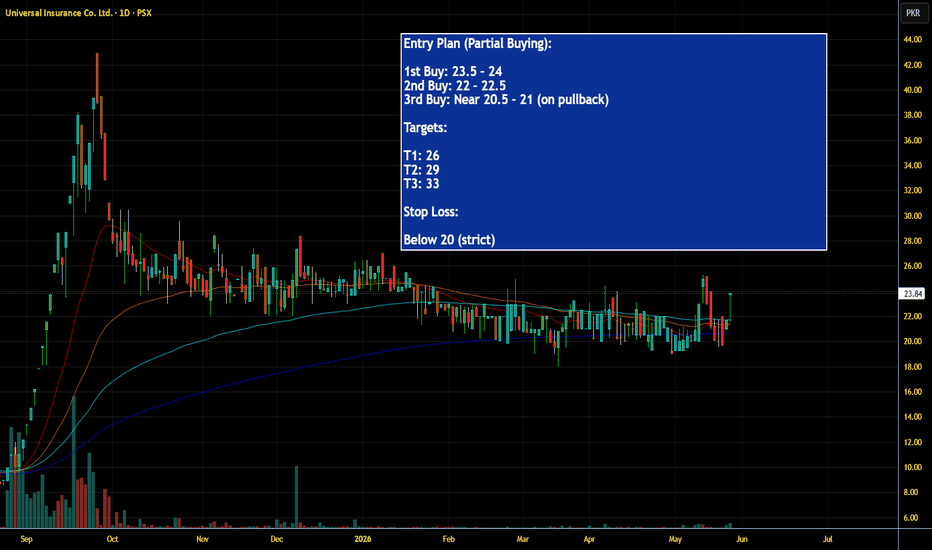
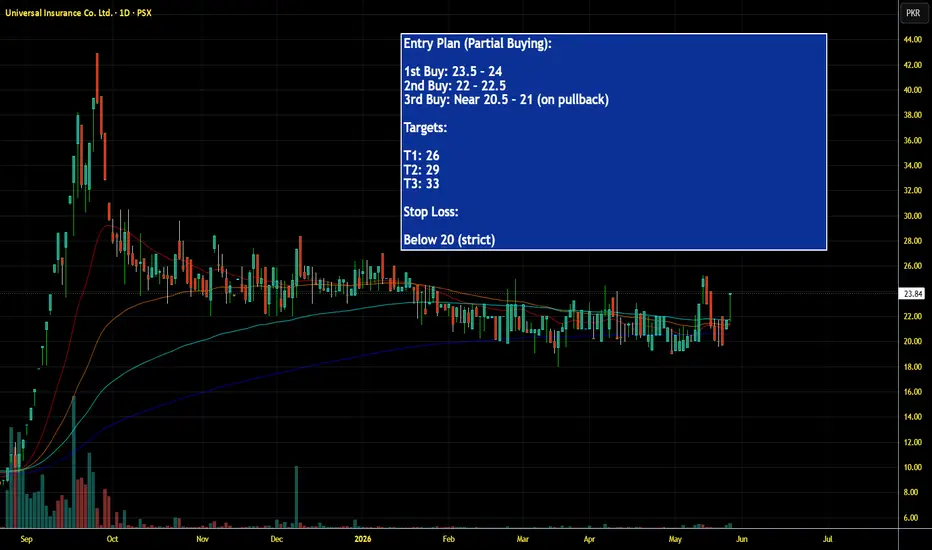
UVIC – Early Breakout Accumulation SetupUVIC has spent a long time consolidating in the 20–22 range after a major historical spike. Now the stock is showing fresh strength with improving candles and a breakout attempt above short-term resistance near 23.
This is an early accumulation + breakout setup. Sustaining above 24 with volume confirmation can trigger stronger upside momentum and attract fresh buyers.
Since the stock remained sideways for a long time, patience may be required before a larger expansion move develops.
Note:
Tight consolidation near support + rising volume often signals smart accumulation before expansion
If momentum builds further, UVIC can move quickly toward higher resistance zones.
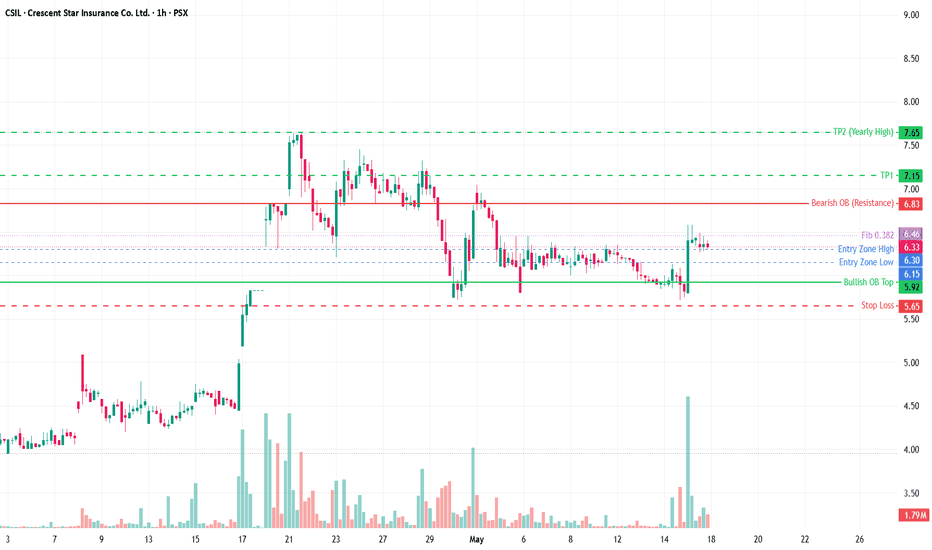
CSIL technical setupCSIL is showing signs of fresh accumulation after a long correction phase. The recent bounce from the 5.8–6 support zone with strong volume indicates buyers are becoming active again. Stock is now trying to regain momentum above short-term resistance.
Buy Zone: 6.10 – 6.40
Breakout Confirmation: Sustained move above 6.70
Stop Loss: Daily close below 5.70
Targets:
T1: 7.20
T2: 8.00
T3: 9.20+
Risk
Stock remains volatile because of its historical sharp swings. Failure to hold above 5.7 may weaken the bullish recovery structure.
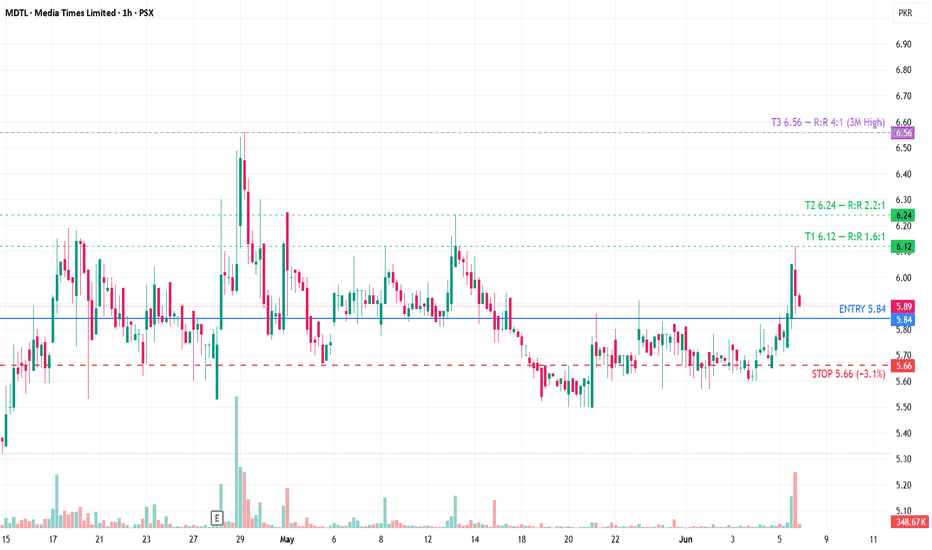
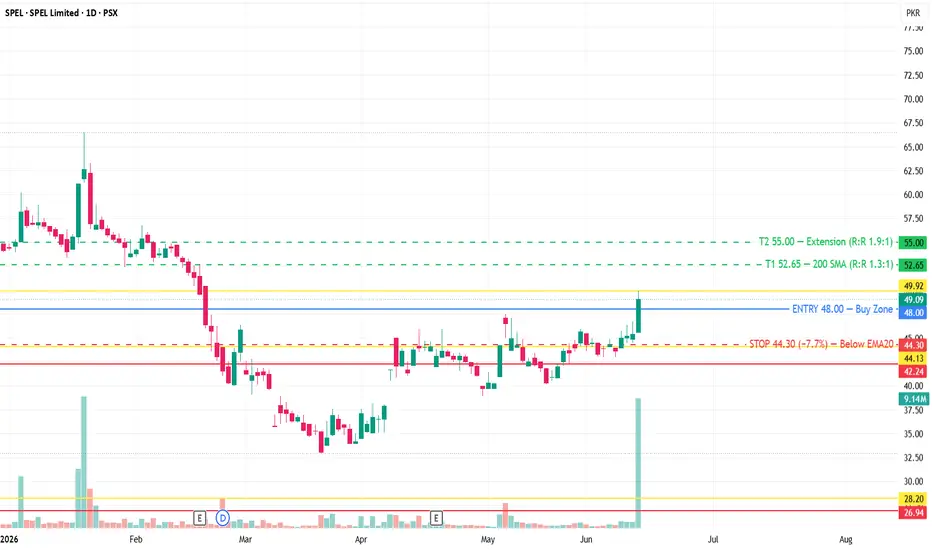
MDTL MDTL is coming off a strong volume day (9.1M shares — the 3rd highest volume bar in 60 days). The daily chart shows a V-shaped recovery from the 4.70 low with higher lows forming on the 1H. A break above 6.12 opens the door to the 6.24–6.56 zone where prior liquidity sits. The 3-month high of 6.56 at T3 would be a 12% gain from entry.
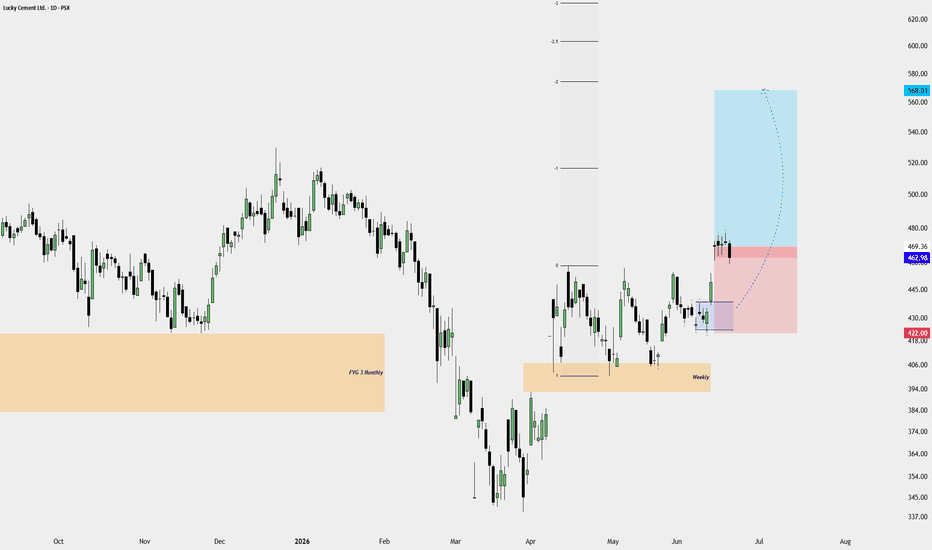
LUCKY CEMENT (LUCK) – Trade Idea | June 21, 2026**LUCKY CEMENT (LUCK) – Trade Idea | June 21, 2026**
Price reacted strongly from the **Weekly FVG** and has continued to respect the bullish structure. The recent expansion suggests buyers remain in control, with price now trading above the key support zone.
As long as the Weekly FVG holds, the market may continue advancing toward the next liquidity objective. The current context favors continuation higher, with the potential for price to seek the high of the leg that created the bullish move.
The Weekly FVG remains the key area of interest. A sustained hold above this zone keeps the bullish narrative intact, while a break below it would increase the probability of a deeper retracement.
**Bias:** Bullish
**HTF Context:** Weekly FVG respected
**POI:** Weekly FVG
**Target:** Previous Leg High / Upside Liquidity
*Follow the higher-timeframe context and let price deliver the opportunity.* 📈
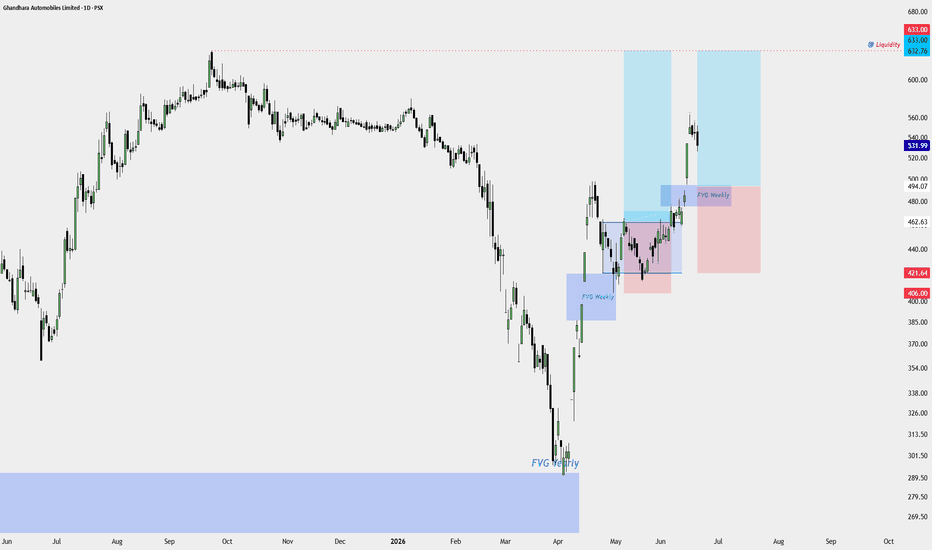
GHANDHARA AUTOMOBILES (GAL) – Trade Idea | June 21, 2026**GHANDHARA AUTOMOBILES (GAL) – Trade Idea | June 21, 2026**
After reacting from the **Yearly Fair Value Gap**, price delivered a strong bullish expansion and respected multiple **Weekly FVGs** along the way. The latest Weekly FVG has now acted as support, keeping the bullish narrative intact.
As long as price remains above the current Weekly FVG, the focus remains on the upside. According to the FVG framework, the market is trading within the context area and may continue seeking liquidity toward the higher objective around the previous leg high.
The key area to watch is the Weekly FVG. Any pullback into this zone could provide an opportunity for buyers to step back into the market. A loss of the Weekly FVG would weaken the bullish outlook and suggest a deeper retracement.
**Bias:** Bullish
**HTF Context:** Yearly FVG respected
**POI:** Weekly FVG
**Target:** Previous Leg High / Upside Liquidity
*Trade what the market delivers, not what you expect.* 📈
BANK OF Punjab**Date:** 21 June 2026**BOP Trade Idea – Daily Timeframe**
**Date:** 21 June 2026
A valid **Daily Timeframe Dealing Range** has formed after a strong bullish expansion from the demand zone. Price is now retracing into a bullish Fair Value Gap (FVG), which sits within the dealing range and offers a potential continuation opportunity.
The expectation is for the FVG to hold as support, allowing price to continue toward the dealing range objective and external liquidity resting above the recent highs. The bullish structure remains intact while price respects the dealing range low.
**Setup:** Bullish Continuation
**Entry Area:** Daily Bullish FVG
**Confirmation:** Respect of the FVG within the dealing range
**Target:** External liquidity above recent highs
**Invalidation:** Daily close below the dealing range low
*"Daily dealing range formed. Price is retracing into a bullish FVG, offering a potential continuation setup toward higher liquidity."*
BNL (Bunny's Limited) – Buy Setup 1HBNL (Bunny's Limited) – Buy Setup 1H
By The Chart Alchemist
Setup Explanation
BNL was previously trading in a well-defined downtrend and displayed multiple selling climaxes, indicating persistent distribution. However, the final selling climax showed characteristics of seller exhaustion, culminating in a terminal wedge formation. This was followed by a period of accumulation, highlighted by the purple channel, where supply was gradually absorbed by stronger hands.
The stock subsequently broke out of this accumulation zone, signaling a potential trend reversal. After the breakout, price successfully retested the former resistance area and found support, confirming the validity of the breakout. The retest itself has now broken higher, suggesting that buyers remain in control.
The Volumetric Distribution Profile further strengthens the bullish case by validating both the breakout and the proportional nature of the pullback. From a Contextual Price Action perspective, the sequence of seller exhaustion → accumulation → breakout → successful retest provides a favorable structure for a bullish continuation move.
---
Buy Zone
7.20 – 7.40
Targets
TP1: 7.80
TP2: 8.20
TP3: 8.60
Stop Loss
Below 7.00
Risk : Reward
1 : 6.2
Trade Management
Initiate positions within the Buy Zone while maintaining disciplined risk management.
Consider booking partial profits at each target level.
Upon achievement of TP1, traders may consider shifting the stop loss toward breakeven to protect capital.
Continuously monitor Contextual Price Action and market structure.
Respond to changes in structure and context rather than relying on lagging indicators.
A decisive breakdown below the accumulation structure would invalidate the bullish thesis.
Educational Notes
The setup is based on Contextual Price Action, not indicator signals.
The combination of an exhausting selling climax, terminal wedge, accumulation, breakout, and successful retest significantly improves the probability of trend reversal.
Volume and structure are supporting the bullish narrative, making this a technically constructive setup.
Disclaimer: This analysis is shared solely for educational purposes and does not constitute investment advice. Always conduct your own research and manage risk according to your trading plan.
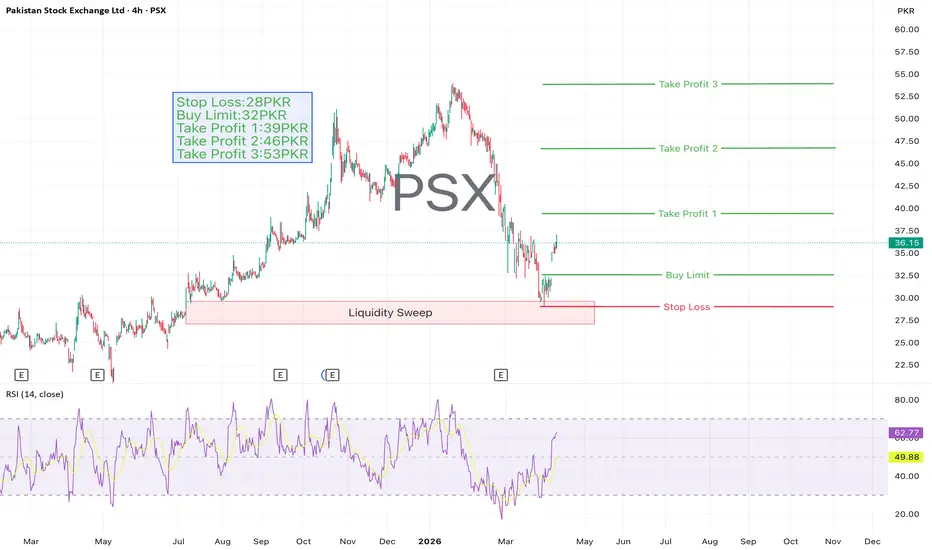
PSX Chart Analysis 10-April-26Entry (Buy Limit): 32 PKR
Stop Loss: 28 PKR
Take Profit 1: 39 PKR
Take Profit 2: 46 PKR
Take Profit 3: 53 PKR
=> Two key technical signals indicate a potential trend reversal from bearish to bullish:
Liquidity Sweep: The market has cleared liquidity below recent lows, suggesting potential accumulation by larger market participants.
Bullish Divergence: Momentum indicators are showing divergence from price action, signaling weakening bearish momentum.
With these confirmations, once the Buy Limit at 32 PKR is triggered, the price is expected to move upward toward the defined Take Profit targets (TP1, TP2, and TP3).
⚠️ Always protect your capital by using a proper stop-loss and maintaining strict risk management discipline in every trade.
Bullish Divergence at Support!TREET Analysis
Closed at 25.13 (13-05-2026)
Bullish Divergence.
Seems like taking Support from a Very Strong Support Zone (22 - 25).
Sustaining this zone may lead it towards 32 - 34.
Fresh Entry should be taken once the price prints HL in current mentioned range.
Breaking 20 may expose next support levels around 16 - 17.
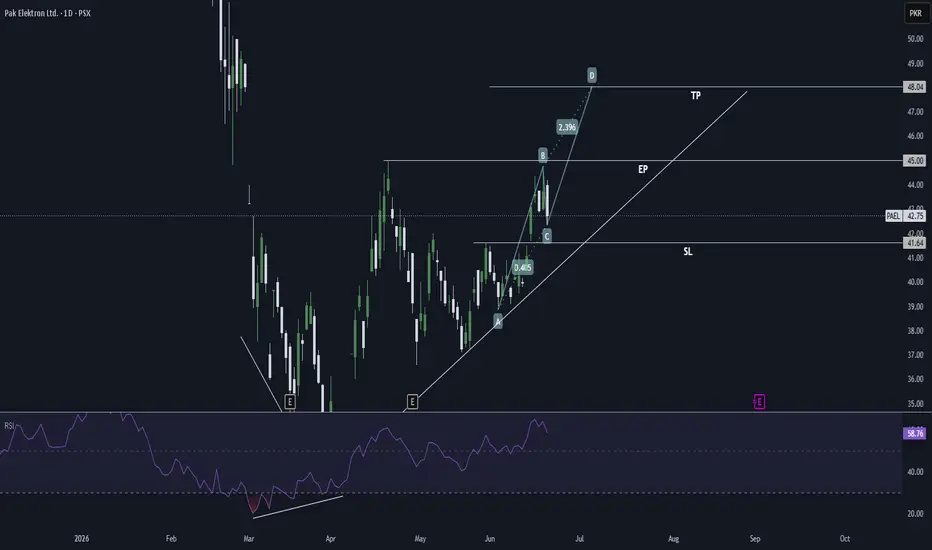
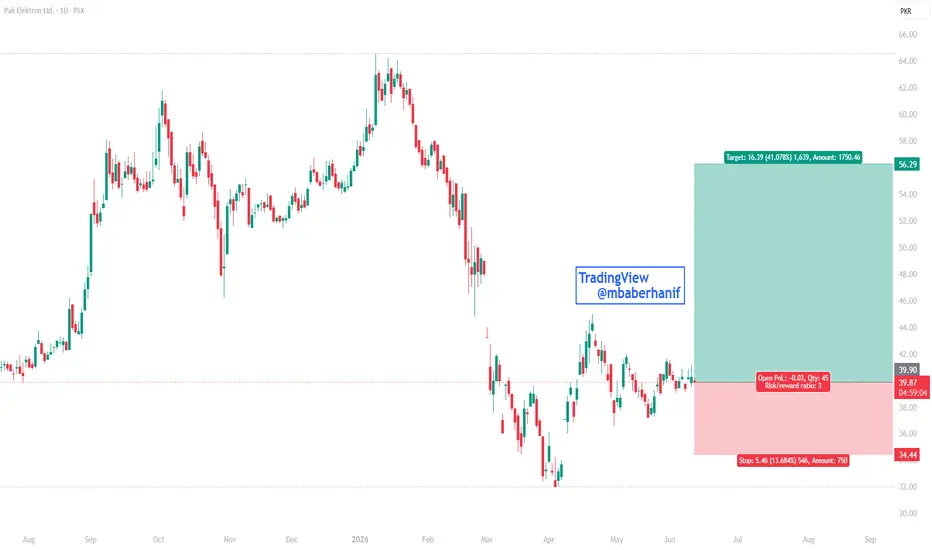
PAEL | TRADE OPPORTUNITY🚨 PAEL - TRADE CALL 🚨
📅 11th June 2026
💰 Entry Zone: 39.90
🎯 Short-Term Targets:
➡️ 42.65
➡️ 45.40
➡️ 48.15
🚀 Long-Term Targets:
➡️ 50.90
➡️ 53.65
➡️ 56.29
🛑 Stop-Loss: 34.44
📈 Potential Upside: ~41%
⚖️ High Reward Setup with Favorable Risk-to-Reward Ratio
🔥 Follow the trading plan, manage risk, and let the trend do the work.
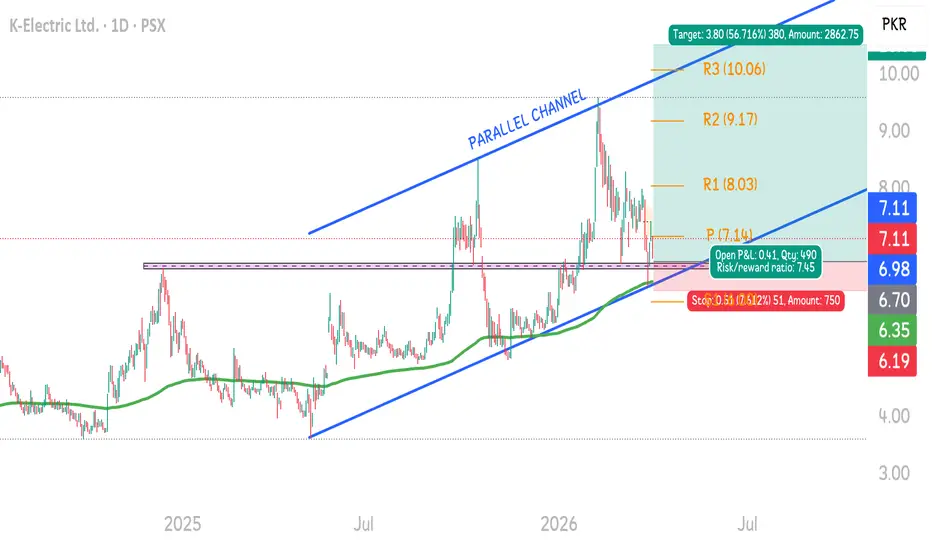
KEL – Strong Long Opportunity📊 KEL is showing solid bullish structure with multiple confirmations aligning in favor of an upside move 🚀
🔹 Technical Highlights:
• Price is in a clear uptrend, trading above the 200-EMA
• Formation of an ascending parallelchannel 📈
• Currently hovering near a strong demand zone
• A rejection candle on support confirms buying interest
👉 All these factors indicate high-probability long setup with strong technical confluence.
🎯 Targets :
• Short Term : 7.14 & 8.03
• Mid Term : 9.17 & 10.06
• Positional Target : 10.50
🛑 Stop Loss :
• Place SL just below previous swing low (below 6.19)
⚠️ Risk Management Tip:
Market is volatile — manage your position size wisely and protect your capital.
💡 Conclusion :
With multiple confirmations (trend, EMA, channel, demand zone, and price action), KEL offers a high-conviction long trade setup.
PREMIUM TRADE ALERT: PSX🚀 Multi-Bagger Opportunity in the Making! 🚀
The long-term structural chart of PSX shows an incredibly strong, rounding accumulation base followed by a massive breakout rally. While the macro structure is extremely bullish, chasing the current momentum.
The smartest play here is to exercise patience and scale in heavily on a healthy technical retest. Wait for the dip!
🔍 Trading Strategy & Key Levels
🛒 Accumulation Zone (On Dip ): Around 41.50
🎯 Target 1: 57.00
🎯 Target 2: 65.00
🚀 Target 3 (Macro): 75.00+
🛑 Strict Stop Loss: 35.92
📊 Risk Per Share: ~5.58 PKR
Max Potential Reward: ~33.50 PKR
Risk-Reward Ratio: An exceptional 1 : 6 setup on the macro target.
💡Plan your trade and trade your plan. Happy trading!
SRVI (PSX)A decisive daily close above 2,100 could trigger the next momentum leg toward 2,180–2,350.
⚠️ If price loses 2,000, expect a pullback toward 1,920–1,940, where buyers may step in again.
Risk / Reward
Buying near 2,000–2,040 offers the best reward-to-risk.
Chasing above 2,100 is not ideal unless accompanied by strong volume.
The trend is still healthy. Patience is key—prefer buying on pullbacks into support or on a confirmed breakout above 2,100 with strong volume.