Wait for a Pull Back for Fresh Entry!ITANZ Analysis
Closed at 47.77 (12-06-2026)
Beautifully hit the first target 50 after the breakout from conolidation box
around 39 - 40 (shared on 22-05-2026).
Trailing Stoploss for that Trade is closing below 44.
Though technically, the stock has started its Uptrend, but fresh entry is not
recommended as bearish divergence may bring the price down towards 44 - 45.
So better to wait for a Good Price level.
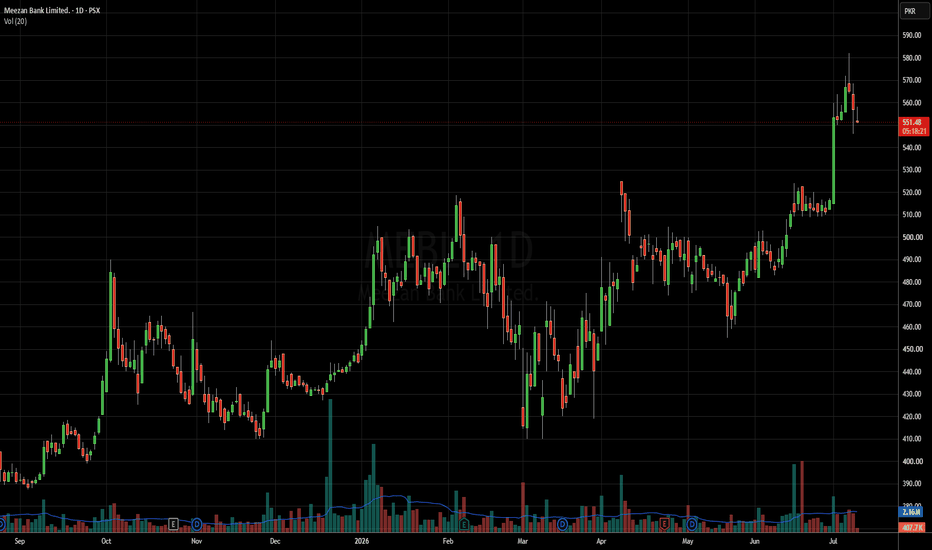
This is forming a rounded top patternMeezan bank price will not form a new high in the near future I see a formation of top pattern here. Would like to see it in the blue channel or support formation above white trend line. The textbook longterm target would be 300. First it needs to break below the base.
power cement longTechnical Setup: Power Cement Ltd (POWER) — Daily Chart
📈 Market Context & Trend
Current Price: 21.50 (+5.81% today)
Bullish Momentum: The stock has seen a sharp recovery from its April lows, pushing back into a strong upward trend with higher highs and higher lows.
Key Resistance Level: The immediate horizontal ceiling sits right around 22.24. This level acted as a major peak back in January/February and is currently the primary target for bulls to clear.
🛠 Indicators in Play
Volume: Today's session printed a significant volume spike (9.1M), well above the average volume line. This confirms strong buying interest and institutional backing on the move up.
Triple Moving Average (MA): The price action is comfortably trading above its key moving averages, signaling that the medium-to-long-term trend remains firmly bullish.
RSI Divergence: The setup features a "Cambist with RSI Divergence" indicator, suggesting that previous momentum exhaustion has been resolved and the current uptrend is well-supported by underlying momentum.
🎯 Trading Plan
Breakout Entry: Look for a decisive daily close above 22.25 on high volume to confirm a breakout from the current consolidation range. Alternatively, look for minor intraday dips toward the 20.50 region for a better risk-to-reward entry.
Upside Targets:
Target 1: 22.24 (Immediate Resistance/Breakout Trigger)
Target 2: 23.50+ (Open air room once previous yearly highs are cleared)
Stop Loss: Below the recent swing low / support structure near 19.50 to protect capital in case of a false breakout.
LOADS (PSX) Trade SetupBullish above 13.91.
As long as the stock holds the 14.50 breakout zone, dips can be used for accumulation. The next major test is 15.24; a successful breakout there could open the path toward 16.50 and 18.00 over the coming weeks. Volume should remain elevated for confirmation.
IBLHL – Swing Idea
IBLHL has recently broken above a long-term descending trendline and reclaimed a key moving average zone, indicating improving momentum. However, due to ongoing geopolitical uncertainty and the possibility of a weak market opening, a staggered entry approach may provide better risk management.
Trade Plan:
🔹 First Entry: 52.00
🔹 Second Entry: 47.00 – 48.00
🔹 Stop Loss: 45.00
Targets:
• TP1: 57.00
• TP2: 60.00
• TP3: 63.00
Market Note:
Recent geopolitical developments and strength in oil prices may increase short-term market volatility. Traders should remain disciplined and follow their predefined risk management rules.
Disclaimer:
This analysis is shared for educational purposes only and does not constitute financial advice. Always conduct your own research and manage risk according to your trading strategy.
#PSX #IBLHL #SwingTrading #TechnicalAnalysis #BreakoutTrading #TradingView #PakistanStockExchange #StockMarketAnalysis
TOMCL – Cup & Handle | Swing Idea
TOMCL is showing a developing Cup & Handle formation on the daily timeframe after a prolonged correction. Price has formed a rounded base and is currently consolidating near the neckline resistance zone. A breakout above the highlighted resistance levels may trigger further upside momentum.
Trade Setup:
🔹 Entry Zone: 35.80 (already did during Market)
🔹 Stop Loss: 33.50
🔹 Targets:
• TP1: 38.80
• TP2: 40.50
• TP3: 43.00 – 44.00
Extended Targets:
• 46.00
• 49.00
Disclaimer:
This is an educational trade idea based on technical analysis and is not financial advice. Always conduct your own research and use proper risk management before taking any trade.
Low Volume Stock but!HAEL
CMP 23.35 (18-05-2026)
Low Volume Stock!
Strong Bullish Divergence.
Took Support from a very important level of 15 - 19.
However, 25 - 26 is the immediate resistance now.
It has the potential to touch 30 - 35.
& if 35.50 is Crossed & Sustained with Good Volumes,
it may touch 45 - 50.
Breaking 20 this time will bring more selling pressure.
Meezan bank in dollarsThis is the chart of meezan bank in dollars. By looking at the chart i can assume that it has completed its run and achieved the tartged. I use charts in dollars to see whether a stock is cheap in terms of dollars. I have earlier dhared the chart in rupees to show that meezan bank is forming a rounded top. You may hear people claiming that fundamentals are strong, the situation is different andv he stocks are under valued. Rememeber always narratives are built to trap new comers in the market , and yes some stocks are undervalued but not all. For stocks that are under valued remember itsnot necessary that they achive their full value in one cycle. My strategy is to look for long term moves, and for me short term moves are just distraction.
If you are looking for analysis of any stock then drop me a meaasge, would love to help.
Regards
Arslan Kham
ACCA QUALIFIED
MASTER'S in Finance
CNERGY — ACCUMULATION ZONE NEAR KEY FIB SUPPORT📢 CNERGY — ACCUMULATION ZONE NEAR KEY FIB SUPPORT 📢
CMP: 8.24
Strategy: BUY / ACCUMULATE
Buy Range: 8.00 – 8.35
Stop Loss: 7.95
🎯 TP1: 8.75 – 8.95
🎯 TP2: 9.20 – 9.55
🎯 TP3: 9.70 – 10.00
🚀 Extended Target: 10.50 – 11.00
Risk: Medium to High
CNERGY is consolidating around the 38.2%–50% Fibonacci support zone after a strong rally from the recent swing low. The stock is attempting to build a base near 8.00–8.30 while momentum indicators are approaching oversold territory, suggesting selling pressure may be exhausting.
Disclaimer: This is not financial advice. Trade at your own risk and manage position sizing accordingly.
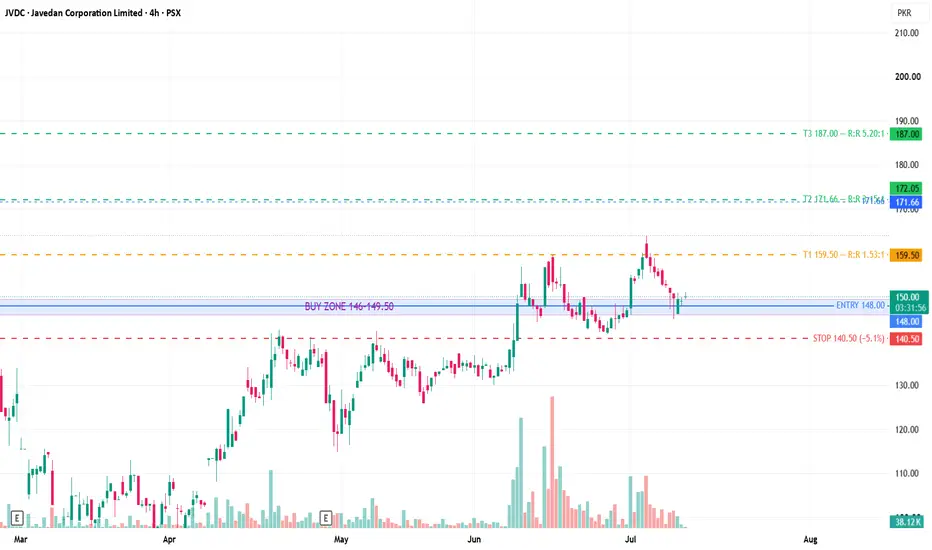
Javedan Corporation Limited (JVDC) - Swing IdeaRecovery Structure Still Intact
JVDC continues to hold its recovery structure after a strong correction phase. The stock has repeatedly defended the 125–128 demand zone, which currently remains the key area for buyers.
The recent rebound from support suggests that accumulation may still be active, while price consolidation below resistance keeps the possibility of another upward leg open.
A gradual accumulation strategy looks reasonable here:
partial position near current levels,
additional buying from the 125–128 support zone if revisited.
Trade Plan
Accumulation Zone: Current levels + 125–128
Stop Loss: 119 (daily closing basis)
Targets:
142
148
155
A sustained move above 142 could improve momentum further, while closing below 119 may weaken the recovery setup.
TELE – Short-Term Swing Idea
Trade Idea: Bullish continuation within a rising channel.
Entry Zone: 8.70 – 9.00 PKR
Stop Loss: 8.25 PKR
Targets:
• TP1: 9.80 PKR
• TP2: 10.15 PKR
Technical View:
Price is trading inside an ascending channel on the daily timeframe.
Recent price action shows higher lows, indicating improving momentum.
A move above the current range could open the path toward the mentioned resistance levels.
RSI is strengthening, supporting the bullish bias, although risk remains elevated.
Risk Management:
This is a high-risk trade setup due to the stock's volatility.
Consider using smaller position sizing and only risk capital you can afford to lose.
Strict adherence to the stop loss is important if the setup fails.
Disclaimer:
This analysis is for educational purposes only and should not be considered financial advice
DFML — Falling Wedge Breakdown or Reversal Opportunity? 📢 DFML — Falling Wedge Breakdown or Reversal Opportunity? 📢
CMP: 19.15
Buy Range: 18.50 – 19.30
Stop Loss: 17.90
Risk: High
🎯 TP1: 20.50 – 20.65
🎯 TP2: 21.50 – 22.00
🎯 TP3: 23.00 – 23.40
🚀 Extended Target: 25.00 – 26.25
DFML is testing a key support zone around 18.0–19.0 after completing a falling wedge structure. A strong rebound from current levels can trigger a recovery move toward the 20.5–23.4 resistance zone, while sustained strength may open the path toward 25–26+.
⚠️ High-risk setup. Strict stop loss recommended below support.
Disclaimer: This is not financial advice. Trade at your own risk and manage position sizing accordingly.
QUICE (PSX) – Swing Trade Setup | Momentum Continuation Play
QUICE has recently broken out of a multi-month consolidation range and is showing strong bullish momentum supported by rising volume and improving market participation. The stock has reclaimed all major moving averages, with short-term moving averages crossing above longer-term averages, confirming a positive trend structure. The recent impulsive move above the Rs.32–34 resistance zone suggests accumulation is underway, while the breakout candle accompanied by above-average volume indicates institutional or strong speculative interest.
Trade Setup
Buy Zone 1: Rs.38.39
Buy Zone 2: Rs.37.28
Stop Loss: Rs.34.57 (daily closing basis)
Target 1: Rs.42.00
Target 2: Rs.45.41
Technical Rationale
Price is trading above all key moving averages, confirming bullish trend alignment.
RSI has moved above 70, indicating strong momentum. While technically overbought, stocks in strong uptrends can remain overbought for extended periods.
Volume expansion during the breakout suggests conviction behind the move rather than a low-volume rally.
The Rs.34–35 area has now transitioned from resistance into a key support zone.
A successful hold above Rs.36–37 would maintain the higher-high, higher-low structure and keep the bullish thesis intact.
Risk–Reward
Downside risk from the primary entry is approximately 10%.
Upside to Target 1 offers roughly 9–10%.
Upside to Target 2 offers approximately 18–20%.
This provides a favorable risk-reward profile for swing traders willing to accept short-term volatility.
Fundamental Tailwinds Supporting the Setup
QUICE continues to benefit from increasing demand in Pakistan’s packaged food sector, driven by urbanization, changing consumer preferences, and rising penetration of branded food products. The company has been expanding its product portfolio and distribution network, helping strengthen market presence and revenue visibility.
Additional factors supporting the bullish outlook include:
Relatively defensive food-sector demand compared to cyclical industries.
Lower interest-rate expectations improving overall PSX liquidity and investor appetite for mid-cap growth stories.
Improved sentiment toward consumer and food-sector companies as inflation stabilizes.
Potential earnings growth driven by operating leverage if sales momentum continues.
Trading View
As long as QUICE remains above the Rs.34.57 invalidation level, the path of least resistance remains upward. A sustained breakout above Rs.42 could open the door for an advance toward the Rs.45–46 region, which aligns with the next major historical resistance area. Traders should monitor volume closely; continued high-volume accumulation would significantly increase the probability of achieving Target 2.
Idea Invalidation: A daily close below Rs.34.57 would weaken the bullish structure and suggest the breakout has failed, warranting reassessment of the trade setup.
MUGHAL – Long-Term Rising Channel
MUGHAL continues to trade within a well-defined long-term ascending channel on the weekly timeframe, maintaining its broader bullish structure despite periods of volatility.
Price is currently positioned near the lower half of the channel while holding above a major rising trendline that has acted as support on multiple occasions over the past few years. The stock is also trading around its long-term moving average zone, an area often watched for trend continuation signals.
From a sector perspective, recent budget measures are broadly supportive for steel manufacturers. Lower input costs through tariff rationalization, combined with expected growth in construction activity driven by housing incentives and development spending, could create a favorable environment for steel demand over the medium to long term. The actual impact will depend on execution, demand recovery, and overall market conditions.
Technical View
Long-term ascending channel remains intact.
Price is holding above key structural support.
Current zone may attract attention from investors looking to build exposure gradually.
A move toward the upper channel boundary could unlock further upside potential.
Key Levels
Current Price Zone: ~76
Major Resistance: 100 – 110
Extended Resistance Zone: 130 – 140
Outlook
The chart suggests a constructive long-term setup as long as the broader channel structure remains valid. Investors and traders may watch for continued accumulation behavior, improving sector sentiment, and strength above key support levels.
Disclaimer: This publication reflects a technical and market-structure view only and is intended for educational purposes. It is not financial advice. Always conduct your own research and risk assessment before making investment decisions.
IMAGE - Trendline & MA200 Resistance Test
IMAGE is currently attempting to break above a long-term descending trendline while trading around the 200-day Moving Average, creating an interesting technical setup to monitor.
The breakout is visible on the daily timeframe; however, confirmation remains limited at this stage as volume participation is still relatively modest. A stronger expansion in volume would add confidence to the bullish case.
On the momentum side, RSI is holding above 60, indicating improving strength while still leaving room before entering overbought territory. This suggests that buyers may continue to have an edge if price sustains above the breakout zone.
Key Levels
Current Price: 25.15
Support Zone: 23.70
Resistance Targets: 26.75, 28.00, 30.00
Technical Outlook
Price attempting to reclaim both the descending trendline and MA200.
RSI remains constructive and supports the possibility of further upside.
Volume confirmation is still lacking and should be monitored closely.
A successful hold above the breakout area could open the door toward the highlighted resistance levels.
Trade Management
This setup may be suitable for traders looking for an early breakout opportunity with a clearly defined risk level. As always, position sizing and risk management should be aligned with individual trading plans.
Disclaimer: This analysis is for educational purposes only and should not be considered financial advice. Always conduct your own research before making any investment decisions.