FIBLM — Fish Hook Pattern ; TG: 15.5 - 18 -22FIBLM — Rounded Bottom Breakout Attempt
CMP: 13.64 | Time Frame: Daily | Risk: High
FIBLM is showing early signs of rounded-bottom recovery after a prolonged corrective phase. Price is attempting to build momentum above 13–14 resistance zone, indicating potential shift in short-term trend.
Sustained strength may drive the stock toward initial target 15.5–16, followed by extended upside near 18–22 zone on volume expansion. However, failure to hold above 12 support could invalidate the recovery structure and push price back toward 10–9 downside levels.
This analysis is for general informational purposes only and not investment advice.
MARI Buying StrategyMari Buying Strategy
option1
MAri current Price 613
if Mari close above 624 then its next target 🎯640-660 stop loss 600
option 2
if Mari close below ❌ 600
then we are wait Price come at buying zone 🟩 570-540
target 🎯620-🎯640-🎯660
My Recommendation
we must waiting for price come at our buy zone 🟩570-540 then place buy order
Play on LevelsFECTC Analysis
CMP 94 (03-03-2026)
Bearish Divergence on bigger tf has dropped the price.
Now approaching important Support zone (88 - 94).
It is important to sustain this range, because it should
print HL to continue its uptrend.
Weekly closing above 92 would be a positive sign.
Resistance seems to be around 109 - 110 & then around 125 - 127.
Breaking 55 would be bring more selling pressure.
AGP Breakout Coming? | Buyback + Dividend | Breakout Above 215The stock of AGP Limited is showing a classic accumulation structure, trading in a well-defined consolidation range for months.
Since January 2025, price has been moving between:
Lower Band: 170
Upper Band: 215
Now, what makes this setup interesting is not just the structure — but the fundamentals aligning with price action:
📌 Share Buyback from the market
💰 Rs. 6 Cash Dividend
These are not random events.
This is often how smart money accumulates before expansion.
🎯 Key Level to Watch
The most critical level is 215.
A strong breakout above this zone can unlock:
🚀 250 (First target)
🚀 300 (Momentum expansion)
🚀 350–360 (Extended move)
⚠️ Current Phase
Right now, the stock is still in consolidation.
This means:
Retail gets bored
Smart money builds positions
The real move begins only after breakout confirmation.
📌 What You’ll Learn in This Video
Structure of AGP consolidation
Why buyback + dividend matters
Breakout confirmation strategy
How to position before the move
⚡ Final Thought
Don’t chase after the breakout.
Understand it before it happens.
KSB Pumps – Buy Idea (Trade With FVG Strategy | SFO) 24 march 26## 🟢 **KSB Pumps – Buy Idea (Trade With FVG Strategy | SFO)**
* **Context:** Sell-side liquidity swept → market flipped bullish
* **Entry:** Wait for pullback into **bullish FVG**, enter after strong rejection
* **Stop Loss:** Below recent swing low / FVG low
* **Target:** Buy-side liquidity (highs above)
* **RR:** Minimum 2R
**Logic:** Liquidity taken → bullish shift → FVG entry → target opposite liquidity
**Model:** Sweep → Flip → Opposite
PAEL - Swing Trade with Long & Short Targets📌 PAEL — Swing Trade Setup
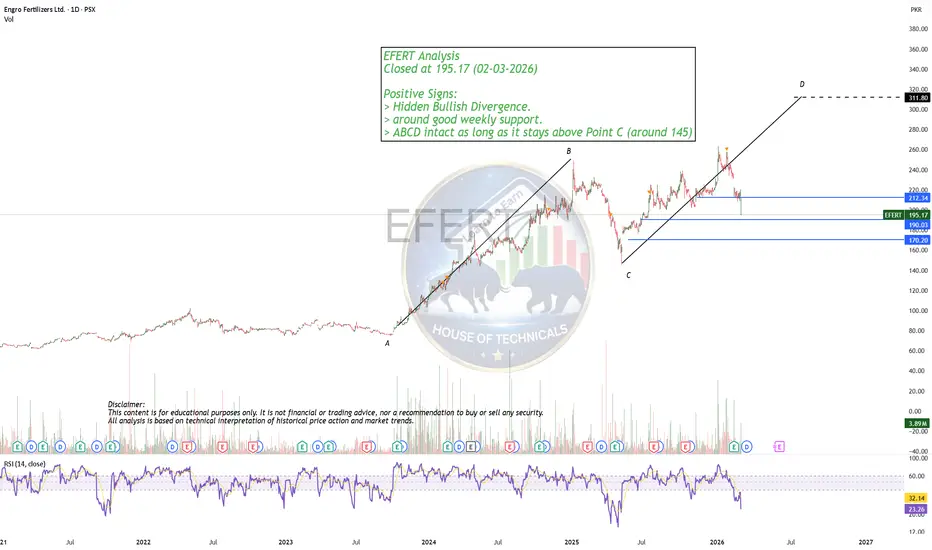
PAEL is currently trading near a major support zone around 37 after a sharp correction from 63.
RSI is near the oversold region (29), which may support a technical bounce.
Fundamentals:
* US transformer export growth + expected interest rate cuts improving earnings outlook.
* CY25 results tomorrow — could act as a near-term catalyst.
* 9MCY25 EPS: PKR 3.38 (+64% YoY)
* Full-year CY25 EPS: PKR 4.5–5.5
* Valuation: Trading at ~7–9x forward P/E vs historical avg of ~12.4x → ~30%+ discount.
📊 Key Levels
Support: 37 / 29
Resistance: 40 / 43 / 47 / 51
💡 Bias: Neutral with short-term bullish/bounce potential
💹 Trade Plan
Entry: CMP (36–38)
Stop Loss: 35 (⚠️ if 35 breaks → price may revisit 29 demand zone)
Targets:
Short-Term Swing Targets: 40 / 43 / 45
Long-Term Targets: 45 / 48 / 51.50 / 57
⚠️ Note:
The result announcement tomorrow could trigger volatility.
Fresh Enters can manage with SL
Investors may average or hold with patience if previously invested.
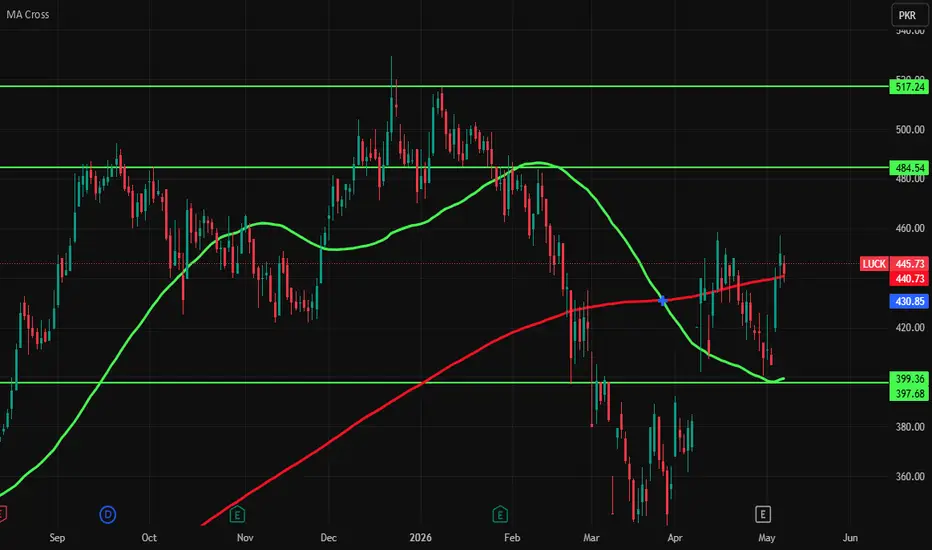
LUCK Swing Trade with Short & Long TargetsLUCK – Swing Trade
LUCK is currently in a strong corrective move after a major rally. Price is now testing the 350 support zone with RSI at the oversold zone 34, which is a key level for a possible technical bounce.
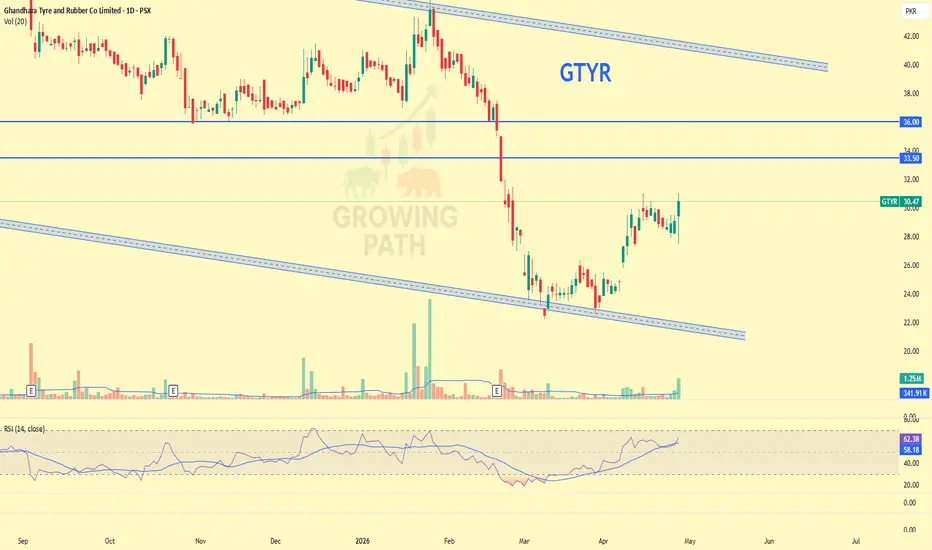
Key Levels Support: 350 / 340 / 300
Resistance: 380 / 420 / 475
Bias: Neutral to slightly bearish
📝 Swing Trade Plan:
🟢 Entry: 350–365 PKR
Stoploss: 340 PKR
Short Targets:
TP1: 400
TP2: 420
Long Target: 6 - 12 Months
TP1: 420
TP2: 475
TP3: 510
⚠️ager 340 break hota hai to 310 b test ho sakta hai.
Systems Ltd: Bullish Divergence confirmedSystems Ltd is showing a textbook Bullish Divergence on the 4-hour timeframe. Price made a lower low, but the RSI has formed a higher low, signaling a potential reversal of the recent downtrend.
Long entry looks favorable here with a strong risk-to-reward setup.
🔹 Entry Zone: 120.26 - 122.50 (Current reaction zone)
🔹 Stop Loss: 111.33 (Below recent swing low)
🔹 TP 1: 141.99
🔹 TP 2: 166.53
This is for educational purposes only.
Hidden Bullish Divergence appearing but...TELE analysis
CMP 11.70 (09-02-2026 12:27pm)
Hidden Bullish Divergence appearing.
Currently in sideways trend.
This time it needs to Cross 14 with Huge
Volumes to reach 16.
However, it should not break 10.50; else,
it may come into the old consolidation range.
KSE100 - Haleon - Accumulation?Haleon is currently trading at a key daily support level and is sitting near the bottom of its daily range, which could present a potential buying opportunity.
Entry: Buy at the current price
Stop Loss: 622.45 (≈ 15.8% downside risk)
Take Profit 1: 15.8% from entry (1:1 risk-reward)
Take Profit 2: 947.92 (≈ 27.9% upside)
Price action suggests the stock is testing a strong support zone, and if buyers step in, a move toward the upper range could occur. Proper risk management is recommended as the setup depends on the support level holding.
MLCFMLCF Trading Update 📊Weekly Support and Bullish Divergence in 1Hour Time Frame
MLCF is currently at a good accumulation point, resting near its weekly support. This zone provides a favorable risk-to-reward setup for accumulation. Key targets are highlighted in the chart, but traders should maintain a cautious approach. Remember, further upside will depend not only on technical strength but also on overall economic conditions and market sentiment. Position sizing and discipline remain critical—accumulate in portions and monitor the broader macro picture.
Hascol Petroleum Ltd (PSX) — Sell Idea 9-march-2026**Hascol Petroleum Ltd (PSX) — Sell Idea**
Price is currently showing a clear **bearish structure** after rejecting from the premium zone. The market continues to form **lower highs and lower lows**, indicating sustained selling pressure.
With momentum shifting to the downside, price may continue to expand lower toward the **sell-side liquidity (SSL)** resting around **12.90–13.00**, which aligns with a previous demand/liquidity area.
**Plan:**
Look for short opportunities on minor pullbacks while price remains below the recent structure highs.
**Target:** Sell-side liquidity near **12.95**
**Invalidation:** Strong bullish reclaim above the recent swing high.
K-Electric Ltd (PSX) — Sell Plan Idea 3-mar-2026Sell Plan Idea
Price has already swept the buy-side liquidity and reacted from a premium zone, showing signs of weakness. The market is now struggling to hold above the 7.40–7.50 resistance area, which may act as a supply zone.
If price continues to reject this level and fails to reclaim it, the next likely move could be a downside expansion toward the 6.30 liquidity/support level.
Plan:
Look for short positions if price stays below 7.40 and shows bearish confirmation.
Target: 6.30 liquidity area
Invalidation: A strong daily close above 7.80.
Systems LTD Pakistan Stock exchangeTechnical Analysis of Systems Limited (SYS) - PSX
The Systems Limited (SYS) daily chart reveals a stock in a prolonged uptrend since early 2024, captured within a well-defined ascending channel (black trendlines). However, following a peak near 174.40 PKR in late December 2025, the price has entered a corrective phase, characterized by a series of lower highs and lows under a descending red trendline. As of the latest session (February 20, 2026), SYS closed at 140.16 PKR, up +2.77% (+3.78 PKR) on the day, with an intraday low of 135.00 PKR (close to the targeted 134.79 PKR level). This session saw volume of approximately 1.8 million shares, indicating decent participation amid the bounce.
The price has so far dropped to our targets at PKR 134.79; this level has acted as a strong support in the past, aligning with prior swing lows and the 61.8% Fibonacci retracement of the major upmove from mid-2025 lows. Buyers have dived in, and the price immediately retracted from that level, staging a sharp intraday recovery to highs of 143.00 PKR. However, the retracement met strong resistance on its way upwards, stalling near the 143 PKR area (confluence of the descending red trendline and recent minor highs). This rejection reinforces the ongoing bearish momentum in the short term.
Key Technical Elements
Price Structure: The stock remains in a long-term bullish channel, with the upper boundary projecting toward 160-170 PKR and the lower boundary around 129 PKR. The recent pullback appears to follow an Elliott Wave corrective pattern, labeled with (D), (E), etc., suggesting a complex ABC correction or Wave 4 pullback. The downside move has respected the channel so far, but pressure is building.
Support and Resistance:
Immediate support: 134.79-135 PKR (recent low, tested and held).
Next downside target: 129 PKR – a strong support is expected at that level, as that is the lower boundary of the long-term channel. This could act as a major value zone for accumulation.
Deeper risk: A fall below the lower trendline will push the price downwards to PKR 100, coinciding with the 2025 lows and extended Fibonacci levels (78.6% retracement).
Resistance: 143-145 PKR (recent high, descending trendline), followed by 150-155 PKR (mid-channel area).
Momentum Indicators:
RSI(14): At 33.03, firmly in oversold territory (<40), signaling potential exhaustion of sellers. A divergence here (higher low in RSI vs. price) could foreshadow a reversal if the bounce sustains.
MACD(12,26,9): Bearish with the line at -1.65, signal at -5.51, and histogram at -3.86. The narrowing histogram suggests weakening downside momentum, but a bullish crossover is needed for confirmation.
Volume: The bounce off the low came on solid volume, which is constructive, but follow-through buying is essential to break the descending trendline.
Scenarios Moving Forward
Bullish Case: A sustained close above 143 PKR would invalidate the short-term downtrend, opening the door to a retest of 150-155 PKR and potentially the channel midline. This could be fueled by positive fundamentals, such as Systems Ltd.'s growth in IT services and exports amid Pakistan's tech sector expansion. Oversold conditions support a relief rally toward 160 PKR if global risk sentiment improves.
Bearish Case (Base Scenario): Failure to hold the 135 PKR support resumes the correction, targeting 129 PKR first. A clean break below the channel's lower boundary accelerates downside to 100 PKR, especially if broader PSX weakness (e.g., from economic pressures or rupee volatility) persists.
Risk Management: Use stops below 134 PKR for longs; watch volume on any retest of lows. The overall uptrend remains intact above the channel low, making dips attractive for long-term investors.
This setup highlights a classic channel correction with oversold readings – dip buyers may find opportunity at supports, but caution is warranted until resistance breaks. Not financial advice; consider company-specific news, like earnings or acquisitions, which could influence the trajectory.
#SYS #SystemsLtd #PSX #PakistanStockExchange #StockAnalysis #TradingView #TechnicalAnalysis #ElliottWave #ChannelTrading #Oversold #PakistanMarkets #ITStocks