• Products
  • Community
  • Markets
  • Brokers
  • More
Get started
  • Markets
  • /Pakistan
  • /Stocks
  • /Ideas
TSBL — Volume Beast21.85 million shares traded — the most liquid name on the board by a mile. 4.6× relative volume, RSI 62.5 (plenty of room). Low absolute price (1.92) = accessible for any account size. 13.5% upside to 3M high.
PSX:TSBLLong
by My-Analysis
Bullish Reversal Pattern Detected!TGL Analysis CMP 199.49 (17-06-2026 10:10am) Beautiful harmonics Reversal Pattern with Bullish Divergences. Also, taken Support from a Strong Zone (Golden Pocket). It has the potential to touch 350 - 360 but the Current Level may act as Resistance. 2 Important Support levels seems to be around 180 - 185 & then around 143 - 150. Breaking 125 may bring more selling pressure.
PSX:TGL
by House-of-Technicals
Updated
PSO: Testing a Critical Support ZonePSO: Testing a Critical Support Zone PSO is trading near a make-or-break support area. Holding the PKR 340–350 zone could trigger a short-term recovery, while a decisive breakdown may extend the correction toward lower levels. Patience, discipline, and confirmation remain the key for traders. Bull Run Pakistan | Technical Desk
PSX:PSO
by BullRunPakistan
11
MUGHAL | Breakout Above PKR100 Could Unlock the Next Bullish LegAfter several months of rebuilding its structure, MUGHAL is once again approaching a key resistance zone that has rejected price multiple times in the past. What caught my attention isn't just the rally—it's the improvement in market structure. The stock has transitioned from making lower lows to forming higher lows and higher highs, suggesting that buyers are gradually regaining control. The highlighted ABCD measured move projects a potential upside objective around PKR 130, but that projection only comes into play if price can successfully clear the major resistance ahead. Technical Overview Price is trading above the 200-day moving average, indicating improving long-term sentiment. The recent advance has created a series of higher lows, keeping the bullish structure intact. RSI is strengthening and approaching bullish territory, reflecting positive momentum. The ABCD harmonic projection points toward the PKR 130 region as a potential measured move. 🎯 Key Levels to Watch 🟨 Resistance Zone PKR 95 – 100 This remains the most important area on the chart. It aligns with: Previous swing resistance Psychological Rs100 level R1 and R2 Pivot Resistance A decisive close above this zone, supported by stronger volume, would significantly improve the bullish outlook. 🟢 Support Levels Pivot: PKR 83.87 As long as price holds above the pivot area, buyers remain in control. Additional supports: S1: PKR 77.75 S2: PKR 67.89 📈 Trading Plan ✅ Bullish Scenario If MUGHAL closes above the 95–100 resistance zone with convincing volume, it would confirm a breakout and could pave the way for the next leg higher. In that case, the ABCD projection around PKR 130 becomes a realistic medium-term objective. ⏳ Neutral Scenario If buyers fail to break resistance immediately, the stock may continue consolidating between the pivot area and resistance. A period of sideways movement after a strong rally would be healthy before another attempt. ⚠️ Bearish Scenario A sustained move below the pivot level would weaken the current bullish structure and could increase the probability of a retest of the lower support zones. 💭 My View The chart is becoming increasingly constructive, but I believe the 100 area is the real decision point. Rather than chasing the current move, I would prefer to see a confirmed breakout with participation before assuming the measured move will play out. For now, the trend favors the bulls—but confirmation remains the key. ⚠️ Disclaimer This analysis is shared for educational purposes only and reflects my personal interpretation of the chart. It is not financial or investment advice. Always conduct your own research and use proper risk management before making any trading decisions. #MUGHAL #PSX #PakistanStockExchange #TechnicalAnalysis #PriceAction #ChartPattern #ABCDPattern #SwingTrading #Breakout #StockMarket #Investing #TradingView #SupportResistance #MarketStructure #RiskManagement
PSX:MUGHALLong
by asimafridi
UBLUBL remains bullish, trading above the Alligator averages with momentum still intact. A daily close above 450 would confirm the breakout and open the way toward 478, followed by 505 and 535. Best Buy: Above 450 on a confirmed breakout. Bullish above: 420–425 support.
PSX:UBL
by haseebS7
Updated
22
MEBLTrend has turned bullish after correction Buy zone 465–475 held successfully Break above 505 confirms strength RSI supports continuation Targets: 530 → 550
PSX:MEBL
by haseebS7
Updated
AGPStrong bullish impulse after breaking consolidation. Price has pulled back slightly after the spike, offering structured dip entries. Levels to watch: Buy 1: ~240 Buy 2 (demand zone): 230–235 TP1: 259 TP2: 283
PSX:AGPLong
by haseebS7
Updated
ILPILP has confirmed a strong breakout above 94, with the Alligator turning bullish and price trading well above key moving averages. Momentum remains strong, although RSI is approaching overbought territory. Best Buy: On a successful retest or sustained close above 94. Upside Targets: 110 → 121 As long as 94 holds as support, the bullish trend remains intact.
PSX:ILPLong
by haseebS7
Updated
AGPSlightly Longterm. AGP is showing a bullish continuation setup, breaking higher from a falling wedge after successfully defending the PKR 165–175 support zone. The latest weekly candle closed strong with rising volume, while RSI has turned higher (~59), indicating improving momentum. A sustained move above PKR 212–217 (0.786 Fibonacci resistance) could trigger the next leg up toward: TP1: 230 TP2: 250 TP3: 280 Invalidation: A weekly close below PKR 190 would weaken the bullish outlook and increase the risk of a move back toward the 175–180 support area.
PSX:AGPLong
by haseebS7
PSO opportunity Pso at very good level..taking support form trend line of channel.great buyer interest shows in today candle.. its good swing time for maximum profit . trade plane mention chart.
PSX:PSOLong
by Adnan-Malik03
SHFA Technical Analysis (Daily + Weekly) / PSX The weekly timeframe is showing a Double Top pattern accompanied by Bearish RSI Divergence, indicating that bullish momentum is weakening. While this does not guarantee a reversal, it is an early warning that buyers should remain cautious and wait for price confirmation. On the daily timeframe, SHFA has recently printed a Higher High (HH) and is now pulling back into the 489–500 demand/support zone, where a potential Higher Low (HL) could form. As long as this support zone remains intact, the overall bullish market structure is still valid. 📈 Bullish Scenario The 489–500 support zone is the key area to watch. Aggressive traders can consider buying at the current price while the stock is trading within the demand zone. Conservative traders should wait for a bullish confirmation candle (such as a bullish engulfing, strong bullish rejection, or breakout candle) before entering a position. Target 1: 574.76 Target 2: 600.52 📉 Bearish Scenario The weekly Double Top and Bearish Divergence remain a risk. If the 489 support is broken with strong selling pressure and a daily close below this zone, the bullish setup will be invalidated, opening the door for a move toward 453.58. 🎯 Trading Plan ✅ Buy Zone: 489–500 ✅ Entry Option 1: Buy at the current market price (Aggressive Entry). ✅ Entry Option 2: Wait for a bullish confirmation candle before buying (Conservative Entry). 🛑 Stop Loss: Below 453.58 (or according to your own risk management). 🎯 Targets: 574.76 → 600.52 "Trade what you see, not what you hope. The chart always rewards patience and discipline." Disclaimer: This analysis is for educational purposes only and is not financial advice. Always use proper risk management before entering any trade.
PSX:SHFALong
by Asif_Iqbal_chaudhary
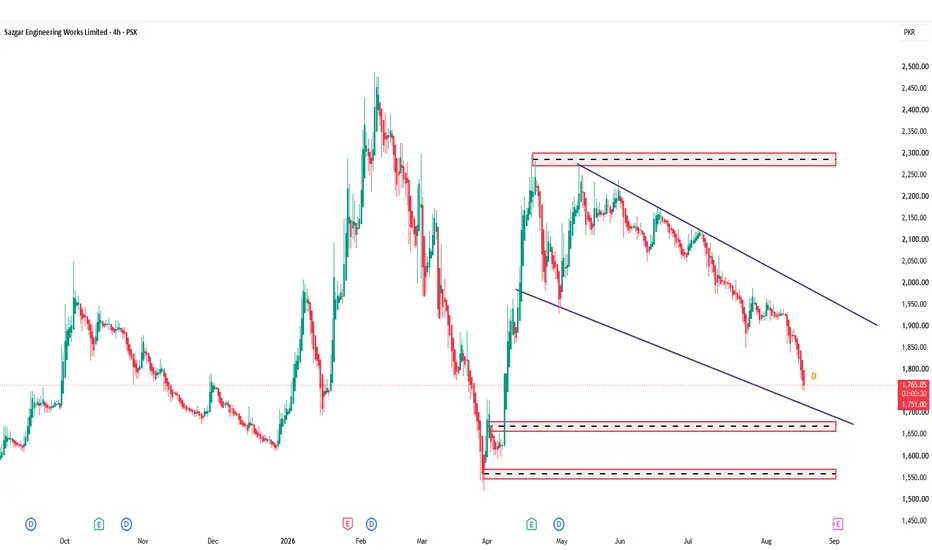
Getting Momentum!SAZEW Analysis Closed at 2210.37 (15-05-2026) Analysis shared on 01-04-2026 played perfectly well & it made a low of 1599 & now at 2200+ Getting Bullish. Crossing & Sustaining 2500 may lead it towards 2800+ However, it should not break 1930 now.
PSX:SAZEW
by House-of-Technicals
Updated
Play on LevelsMARI Energies Analysis Closed at 689.76 (03-07-2026) Currently Trading around Important Resistance zone (690 - 705) Sustaining this Range may lead it towards a Breakout Level, targeting around 760 - 770 initially & then around 800. On the flip side, 650 - 660 may act as a Good Support Zone. Breaking 590 - 595 may bring more selling pressure.
PSX:MARI
by House-of-Technicals
Bullish Divergence with HH HL.SSGC Analysis Closed at 31.37 (03-07-2026) Bullish Divergence appearing & trend started making HH HL. 28 - 30 may appear as a Good Support zone. Sustaining this zone may lead it towards 39 - 40 which is also monthly resistance area. Closing below 23 may bring some selling pressure.
PSX:SSGC
by House-of-Technicals
LOTCHEM - PSX1, The market printed a bullish divergence and made its way up while forming an ABCD pattern. 2, There is a weekly resistance so thats why we will split 1 TP before the resistance and 1 TP after the resistance.
PSX:LOTCHEMLong
by haxan7860
FrieslandCampina Engro Pakistan Limited July 2026 **FrieslandCampina Engro Pakistan Limited — Daily Bullish Pullback Idea | July 04, 2026** **Symbol:** FrieslandCampina Engro Pakistan Limited — PSX **Timeframe:** Daily **Chart Date:** July 04, 2026 FrieslandCampina Engro Pakistan Limited is showing a strong bullish structure on the daily timeframe. Price has already reacted nicely from the lower monthly FVG area and moved higher with clear bullish displacement. Right now, I am not interested in chasing the move from the current level. My main interest is to wait for price to pull back toward the marked monthly FVG / equal-low liquidity area. If price sweeps that liquidity and then forms a clean bullish reaction, it can create a better long opportunity. The idea is simple: price may first come down to rebalance the FVG and collect liquidity, then if buyers step in again, the next upside target can be the marked higher-timeframe target area. For confirmation, I want to see: 1. Pullback into the monthly FVG area 2. Equal-low liquidity sweep 3. Bullish reaction from the zone 4. Daily bullish dealing range formation 5. Continuation toward the upside target This is a clean patience-based setup. The stock already looks bullish, but the best trade may come after a proper pullback instead of buying in the middle of the move. **Patience pays. Confirmation is more important than prediction.**
PSX:FCEPL
by Asif_Brain_Waves
National Refinery Limited Daily Patience Pays (July 2026) **NRL Daily Outlook — Patience Pays** **Symbol:** National Refinery Limited — PSX **Timeframe:** Daily **Chart Date:** July 04, 2026 National Refinery Limited is currently trading around an important higher-timeframe area. Price is sitting near the **monthly FVG**, and the market has also marked **equal-low liquidity** around this zone. This makes the current area very important, but I am not interested in rushing into the trade too early. My main plan is to wait for price to pull back deeper first. The clean opportunity can come if the market moves down, takes liquidity below the current range, and then reacts from the lower demand / discount area. That area can become a better place to look for a bullish setup, especially if the market forms a proper bullish dealing range after sweeping liquidity. The idea is simple: price may first come down to collect liquidity, then if it shows bullish displacement and creates a clean dealing range, the next upside target can be the previous major high / buy-side liquidity area. I like this setup because the upside potential is attractive, but the entry must be clean. Buying in the middle of the range is risky. I would rather wait for price to come into a better area, form confirmation, and then look for a possible long trade. For me, the confirmation will be: 1. Price pulls back into the lower zone 2. Sell-side liquidity is taken 3. Bullish reaction appears 4. A bullish dealing range forms on the daily timeframe 5. Price starts holding above the FVG / reaction area The main lesson here is simple: **patience pays.** The best trade is not always the trade that is available right now. Sometimes the strongest setup comes after waiting for price to reach the right area first. If the market gives the pullback and confirms bullish order flow, then I will look for a possible move toward the marked upside target. If price moves directly without giving confirmation, I will avoid chasing. Risk is always involved, so confirmation is more important than prediction.
PSX:NRLLong
by Asif_Brain_Waves
Trade Idea: LOADS Daily Outlook — Waiting Below (july 2026)**Trade Idea: LOADS Daily Outlook — Waiting Below Monthly Low** **Symbol:** Loads Ltd. — PSX **Timeframe:** Daily **Chart Date:** July 04, 2026 Loads Ltd. has shown a strong recovery from the April low and price is now moving upward with a clear bullish reaction. The market has already created a decent upside leg, but I am not interested in chasing price at the current level. My main interest is **below the previous month’s low**. I want to see price pull back, take liquidity below that low, and then form a **bullish dealing range on the daily timeframe**. For me, the clean setup will only start after the market shows a proper liquidity sweep and then gives a strong bullish reaction. The idea is simple: price may first move down to collect sell-side liquidity below the monthly low, then if it forms a bullish dealing range with displacement, I will look for a possible long setup from that area. The upside target will be the marked **buy-side liquidity** above the current range. That is where resting liquidity is visible, and if the bullish dealing range confirms, price can later expand toward that area. I do not want to buy in the middle of the move. I will wait for: 1. Price to move below the monthly low 2. Sell-side liquidity sweep 3. Bullish displacement on daily timeframe 4. Bullish dealing range / FVG formation 5. Entry only after proper confirmation If price moves directly toward buy-side liquidity without giving the pullback, then I will avoid chasing. Patience is important here because the best opportunity may come only after liquidity is taken below the monthly low. Risk is always involved, so confirmation is more important than prediction.
PSX:LOADS
by Asif_Brain_Waves
Pakistan State Oil Co. Ltd 2025 High Sweep (July 04, 2026)**Trade Idea Title:** **PSO Monthly Outlook: 2025 High Sweep Followed by Possible Deep Pullback** **Symbol / Market:** Pakistan State Oil Co. Ltd. — PSX **Timeframe:** Monthly **Chart Date:** July 04, 2026 After observing the monthly chart of **Pakistan State Oil Co. Ltd.**, the market has swept the **2025 high** and failed to continue higher. Instead of running upward, price reacted aggressively to the downside and created a clear bearish displacement. This tells me that the external buy-side liquidity above the major high has already been taken. Now my main expectation is a deeper pullback toward the **2025 low area**. The move down looks strong because the market did not stay in a clean consolidation after the sweep. It quickly rejected from the high and formed a bearish structure, which supports the reversal/pullback idea. A **yearly bullish FVG** is sitting below the current swing low. This area can become an important higher-timeframe support zone later, and from there price may push higher again. But because the market has already grabbed major external liquidity, I am not expecting a clean upside expansion inside the same yearly candle. A stronger bullish move may take time and could develop in the next one or two yearly candles. When a market sweeps a major high, usually three scenarios can happen: **1. Running highs** Price continues higher after the sweep. In this case, that did not happen. **2. Consolidation** Price stays sideways after taking liquidity. This also looks less likely because price dropped quickly with bearish pressure. **3. Reversal / deep pullback** Price rejects the major high and starts moving toward downside liquidity. This is the scenario I am currently expecting. My view is simple: **PSO may continue lower first, targeting the 2025 low area, then later react from the yearly bullish FVG and create a bigger upside move in the future.** This is a higher-timeframe idea, so patience is important. I will wait for proper confirmation before taking any trade. Risk is always involved.
PSX:PSOShort
by Asif_Brain_Waves
View on KSBPKSBP looks technically strong as price continues to compress within a multi-year symmetrical triangle. Targets: 280 350 450+
PSX:KSBPLong
by syedfaisalayubi25
View on WAHNThe stock still looks technically strong after a healthy pullback. Price is holding the rising support trend-line, which keeps the bullish structure intact. If price breaks above 330-350 with the strong volume, the next upside target's could open towards 400+.
PSX:WAHNLong
by syedfaisalayubi25
View on SHFAMeasured move projection from the current consolidation range suggests an upside potential of 25-40% upon confirmed breakout.
PSX:SHFALong
by syedfaisalayubi25
View on MLCFThe stock still looks bullish on the weekly chart. After a strong move upward, the current pullback seems healthy and price is holding the rising support. If momentum returns and price breaks above 115-120, the next major move could target 140+. Targets: 140 160 200+
PSX:MLCFLong
by syedfaisalayubi25
112233445566778899101011111212131314141515161617171818191920202121222223232424252526262727282829293030313132323333343435353636373738383939404041414242
…999999

Made by humans

Select market data provided by ICE Data Services. Select reference data provided by FactSet. Copyright © 2026 FactSet Research Systems Inc.Copyright © 2026, American Bankers Association. CUSIP Database provided by FactSet Research Systems Inc. All rights reserved. SEC filings and other documents provided by Quartr.© 2026 TradingView, Inc.

More than a product
  • Supercharts
Screeners
  • Stocks
  • ETFs
  • Bonds
  • Crypto coins
  • CEX pairs
  • DEX pairs
  • Pine
Heatmaps
  • Stocks
  • ETFs
  • Crypto coins
Calendars
  • Economic
  • Earnings
  • Dividends
  • IPOs
More products
  • News Flow
  • Portfolios
  • Fundamental Graphs
  • Yield Curves
  • Options
  • Macro Maps
  • Pine Script®
Apps
  • Mobile
  • Desktop
Community
  • Social network
  • Wall of Love
  • Refer a friend
  • House Rules
  • Moderators
Ideas
  • Trading
  • Education
  • Editors' picks
Pine Script
  • Indicators & strategies
  • Wizards
  • Freelancers
  • Paid Spaces
Tools & subscriptions
  • Features
  • Pricing
  • Market data
  • Gift plans
Trading
  • Overview
  • Brokers
  • Brokers comparison
  • The Leap
Special offers
  • CME Group futures
  • Eurex futures
  • US stocks bundle
About company
  • Who we are
  • Space mission
  • Blog
  • Help Center
  • Careers
  • Media kit
Merch
  • TradingView store
  • Tarot cards for traders
  • The C63 TradeTime
Policies & security
  • Terms of Use
  • Disclaimer
  • Privacy Policy
  • Cookies Policy
  • Accessibility Statement
  • Security tips
  • Bug Bounty program
  • Status page
Business solutions
  • Widgets
  • Charting libraries
  • Lightweight Charts™
  • Advanced Charts
  • Trading Platform
Growth opportunities
  • Advertising
  • Brokerage integration
  • Partner program
  • Education program
Community
  • Social network
  • Wall of Love
  • Refer a friend
  • House Rules
  • Moderators
Ideas
  • Trading
  • Education
  • Editors' picks
Pine Script
  • Indicators & strategies
  • Wizards
  • Freelancers
  • Paid Spaces
Business solutions
  • Widgets
  • Charting libraries
  • Lightweight Charts™
  • Advanced Charts
  • Trading Platform
Growth opportunities
  • Advertising
  • Brokerage integration
  • Partner program
  • Education program
Look FirstLook First