AHL LOOKING GOOD FOR A MOVE TOWARDS ATHThe script AHL is looking at attractive levels keeping in view the technical and fundamental aspects of the share. The price is trading above the alligator and the weekly charts also complementing the bullish side momentum.
The script has completed the ABCD projection and the moving upwards after forming a bullish divergence.
These are my own views and analysis. This is not a financial advice.
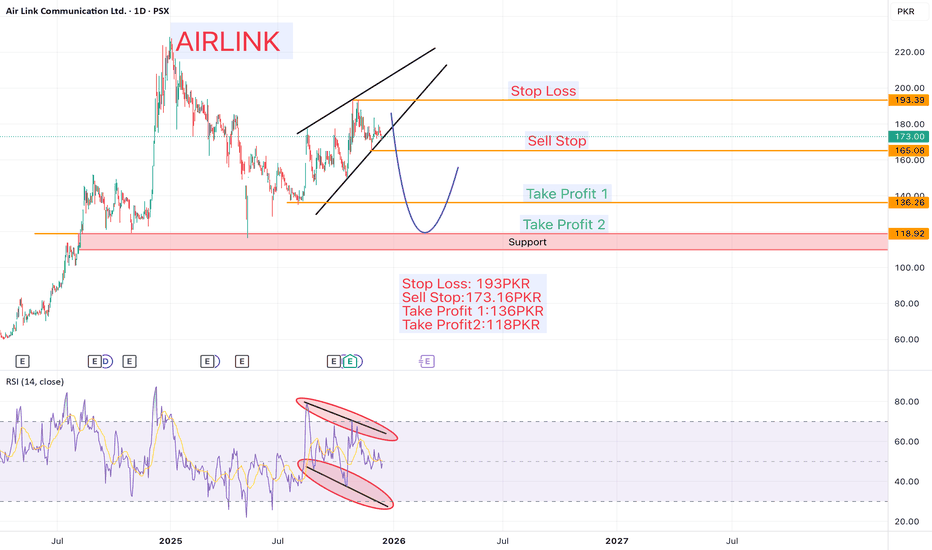
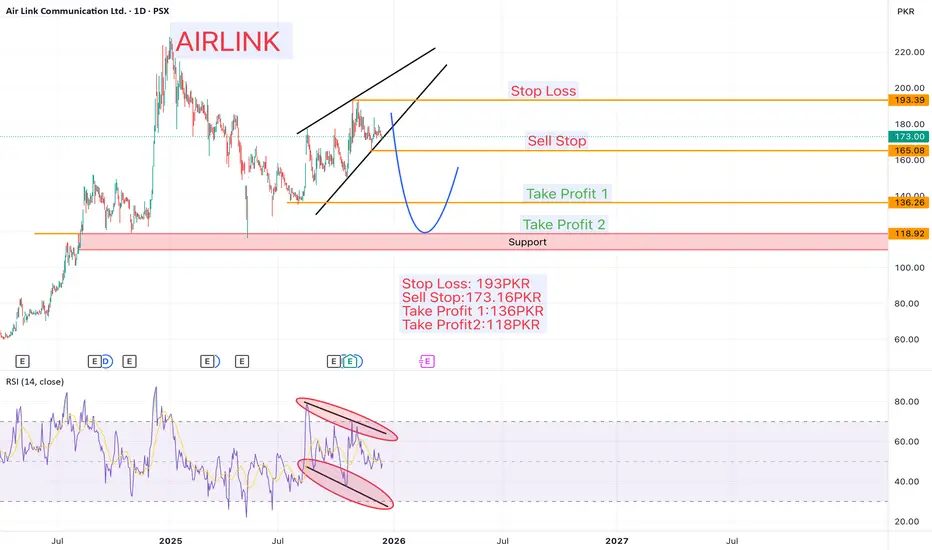
AIRLINK PSX Chart Analysis 12-Dec-25Stop Loss: 193 PKR
Sell Stop: 173.16 PKR
Take Profit 1: 136 PKR
Take Profit 2: 118 PKR
A Rising Wedge pattern has formed, supported by a clear bearish RSI divergence, indicating weakening bullish momentum and a potential downside reversal. If the Sell Stop at 173.16 PKR is triggered, the price is likely to continue downward toward the targets at 136 PKR and 118 PKR.
⚠️ Always remember to protect your capital with a proper stop-loss and disciplined risk management.
MCB Chart Analysis 28-June-26🔻 Sell Setup
Stop Loss: 432.06 PKR
Sell Stop: 419.00 PKR
Take Profit 1: 395.65 PKR
Take Profit 2: 368.89 PKR
Take Profit 3: 343.66 PKR
Trade Rationale:
Liquidity is resting above the Sell Stop (419.00 PKR), with a major liquidity zone near the Stop Loss (432.06 PKR). On the downside, a significant liquidity pool is located around 343.52 PKR.
Based on this liquidity concept, the expectation is that price may first sweep the buy-side liquidity above the entry zone before reversing to the downside. Once bearish confirmation is established and the Sell Stop is triggered, the anticipated move is toward the downside liquidity, targeting:
🎯 TP1: 395.65 PKR
🎯 TP2: 368.89 PKR
🎯 TP3: 343.66 PKR
⚠️ Disclaimer: This analysis is shared for educational purposes only and does not constitute financial or investment advice.
⚠️ Risk Management: Always protect your capital by using an appropriate stop loss, maintaining disciplined risk management, and never risking more than you can afford to lose.
Double Bottom Formation Technical Setup:
Dost Steel Ltd. (DSL) has formed a solid macro Double Bottom after twice validating structural support at 5.00 PKR. While price matched the previous low, the RSI (14) printed a clear higher low, establishing a strong Bullish Divergence that signals seller exhaustion and buyer accumulation.
Trading Strategy:
Trigger: Wait for a confirmed daily candle close above major resistance at 5.94 PKR on strong volume to trigger entry.
Target: 7.20 PKR
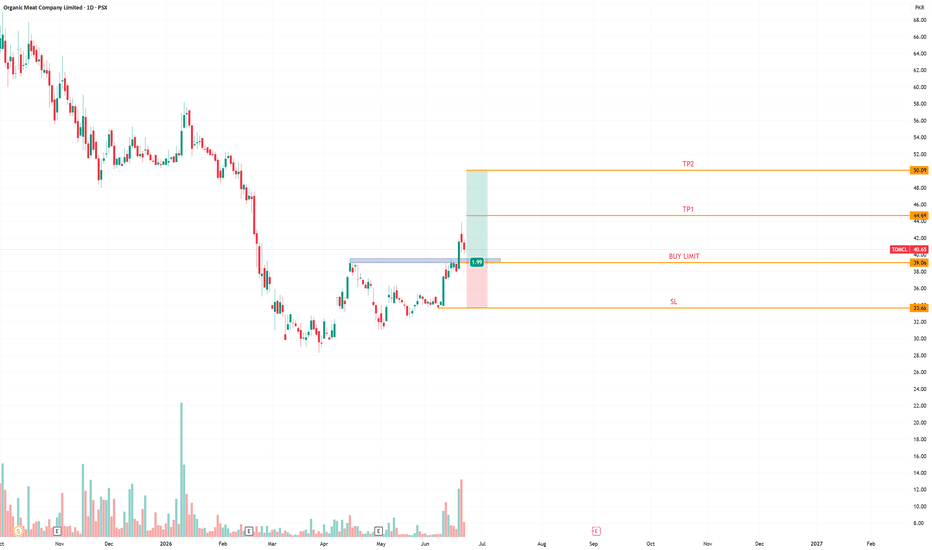
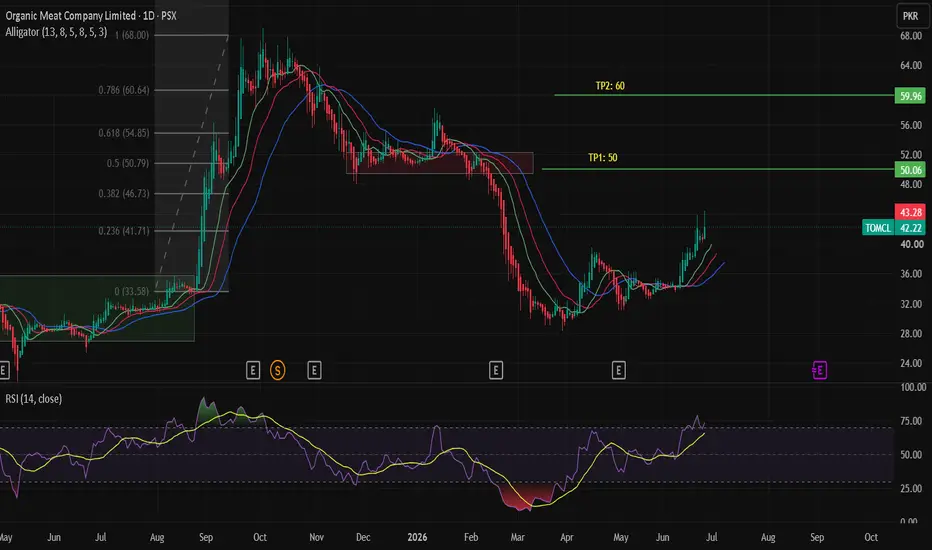
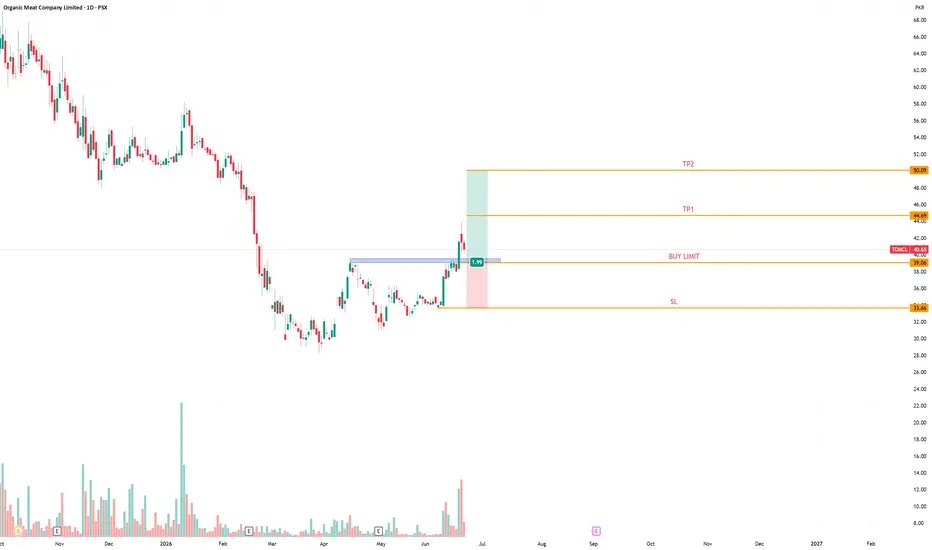
TOMCLTOMCL has broken out of its recent consolidation and is trading above the Alligator averages, confirming a bullish trend. Momentum remains positive, with RSI supporting further upside despite nearing overbought levels.
Best Buy: On a sustained close above 43 or a healthy retest of the breakout.
Upside Targets: 50 → 60
As long as price holds above the 39–40 support zone,
PAEL PSX Chart Analysis 1-April-26Stop Loss:32PKR
Buy Stop:35PKR
Take Profit 1:40PKR
Take Profit 2:44PKR
Take Profit 3:48PKR
Take Profit 4:52PKR
The market structure on the 1-hour, 4-hour, and daily time frames remains bearish, indicating that the broader trend is still downward. However, on the weekly time frame, the market appears to be entering a corrective bullish phase.
A bullish divergence on the Relative Strength Index suggests weakening bearish momentum, which may lead to a short-term upward correction.
If price breaks above the buy stop level, the market may move toward TP1, TP2, TP3, and TP4 as part of this corrective move before the broader bearish trend potentially resumes.
⚠️ Always protect your capital with proper stop-loss placement and disciplined risk management.
Levels to Play!SNGP Analysis
Closed at 99.23 (19-05-2026)
Inverse Cup & Handle & Head & Shoulders Pattern.
82 - 86 is a very important area. If this level is broken, the inverse cup & handle
pattern would be in play targeting around 32 - 33 with midway support around 65 - 70.
On the flip side, it needs to cross & sustain 106 - 108 to continue its upward movement.
92 - 93 is the immediate Support level.
The real hardle would be around 120 - 130 which is a Strong Resistance Zone.
MBL 2nd buy setup Allah Knows Best — And Allah Almighty is Powerful over Everything.
Alhamdulillah after hit TP1,Now MEBL is showing strength near an important breakout / resistance zone.
🔹 2nd Buy Only If:
Buy if Price sustains above 517.82 – 518 on daily closing basis.
🎯 Target Zone:
✅ 538
✅ 555
✅ 577 long TP
❌ If price fails to hold above 517.82 – 518, better to avoid fresh entry and wait for dip/support retest.
🔴 Strict SL: 504.61
Support zone remains around 483.76 – 481.56.
⚠️ Trade with proper risk management. This is only a technical view, not financial advice.
— Shariah PSX Bull
#PSX #MEBL #TradingView #TechnicalAnalysis #MeezanBank
PPL — 2nd Buy SetupAllah Knows Best — And Allah Almighty is Powerful over Everything.
Alhamdulillah, PPL is now near an important 2nd buy confirmation level.
🔹 2nd Buy Only If:
buy on current price or any dip but not going dow 241.94 on daily closing basis.
🎯 Targets / Orange Zones:
✅ TP1: 260.81
✅ TP2: 272.24
✅ TP3: 279.51
❌ If price fails to hold above 241.94, better to avoid fresh entry and wait for dip/support retest.
🔴 Strict SL: 239
⚠️ Trade with proper risk management. This is only a technical view, not financial advice.
— Shariah PSX Bull
#PSX #PPL #TradingView #TechnicalAnalysis
DGKC IS EXPECTED TO LEAD THE BULL RUN ....The script DGKC is looking promising at the current price levels keeping in view the fundamentals and technical of the company.
Bullish Points:
Technical:
1. Bullish Divergence
2. Making HH's HL's
3. Price above alligator and alligator is bullish
4. Weekly alligator is also awakening
5. Bullish Flag pattern projection 348
6. Trend Based FIB projection 348
7. Price Bouncing from Fib Level 0.618 (Golden Pocket)
Fundamentals :
1. DGKC IS HAVING SARMAAYA SCORE OF 83
2. DGKC IS HAVING SARMAAYA AGRESSIVE RANKING OF 13.
3. DGKC IS HAVING SARMAAYA EXPLOSIVE RATIO OF 2.39
What are your views about the DGKC projections ?
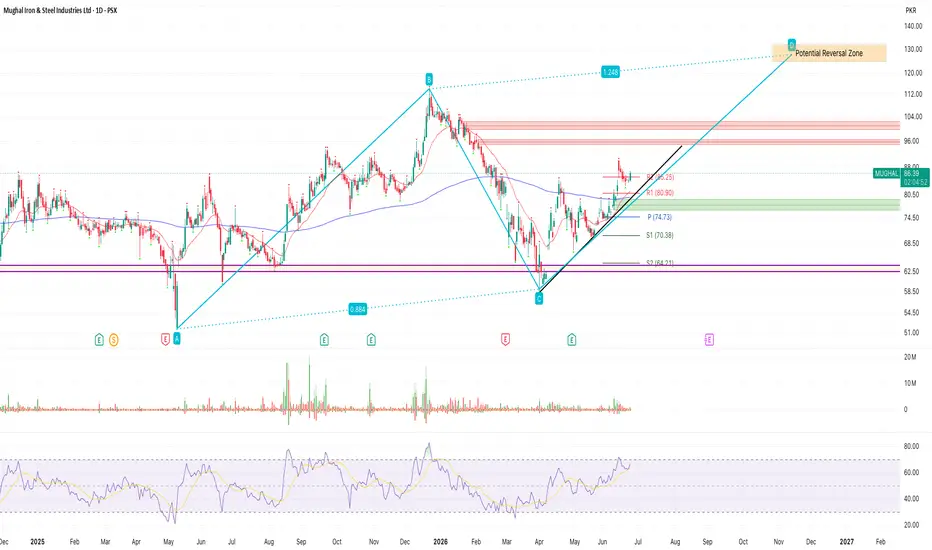
MUGHAL: Bulls Eyeing the 95-100 Supply Zone | Breakout Ahead?MUGHAL: Recovery Rally Continues, But a Big Test Lies Ahead
MUGHAL has quietly staged a strong recovery over the last few months. After finding support near the 58-60 area earlier this year, the stock has been making higher highs and higher lows, which is usually a positive sign for the overall trend.
One of the encouraging developments on the chart is that the stock has managed to reclaim its long-term moving average and has held above it despite recent market fluctuations. Buyers continue to step in on dips, keeping the short-term trend intact.
However, the stock is now approaching an area that could decide its next major move.
Key Resistance Levels
🔹 88-90 (Immediate resistance)
🔹 95-100 (Major supply zone)
🔹 125-130 (Potential medium-term target)
The 95-100 region stands out as an important area because the stock has struggled there in the past. It's also a zone where long-term sellers may become active again.
Key Support Levels
🔹 80-81
🔹 74-75
🔹 63-65
As long as the stock continues to hold above these support areas, the broader recovery story remains intact.
Bullish Scenario
The chart continues to look constructive.
If MUGHAL manages to break above 90 and then successfully clear the 95-100 supply zone, the next leg higher could begin.
🎯 Target 1: 100
🎯 Target 2: 112
🎯 Target 3: 125-130
The recent price action suggests that buyers are gradually gaining control, and a breakout above the supply zone could attract fresh momentum.
Bearish Scenario
Not every resistance breaks on the first attempt.
If the stock faces rejection around the 95-100 area, some profit-taking should be expected after the strong rally from the lows.
In that case, the first levels to watch would be 80 and then 75.
A pullback toward these levels would still be considered normal within an overall improving trend. The chart would only start to weaken if price closes below the 74-75 support zone.
Final Thoughts
For me, the chart remains positive, but the real battle lies in the 95-100 zone.
The stock has already done a lot of hard work by recovering from its lows and rebuilding a bullish structure. The next step is to see whether buyers have enough strength to absorb supply and push the stock into triple digits.
I'll be watching the 95-100 area closely over the coming weeks.
Disclaimer: This analysis reflects my personal view of the chart and is shared for educational purposes only. Please do your own research before making any investment decisions.
#MUGHAL #PSX #PakistanStockExchange #TechnicalAnalysis #ChartAnalysis #PriceAction #SwingTrading #Breakout #Bullish #SupportAndResistance #StocksToWatch #SteelSector #Investing #TradingView #MarketAnalysis
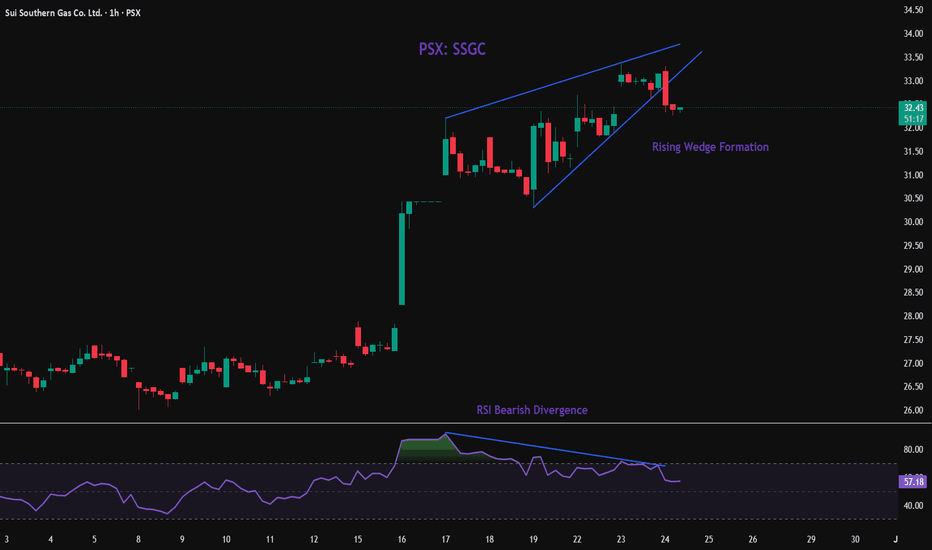
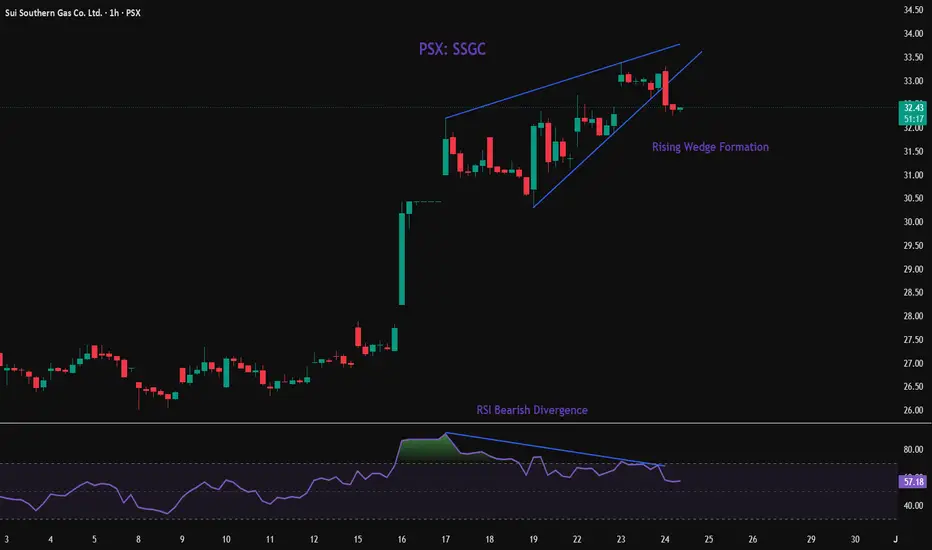
SSGC Profit Booking UpdateTechnical Analysis & Trade Logic:
The Market Update: This is a crucial risk management update for SSGC. We are calling for immediate profit booking if you are holding short-term positions.
Our Original Stance: Please note that our primary focus and original call on SSGC was for a long-term investment holding. We did not officially issue a short-term buying signal.
1H Weakness: However, looking at the lower timeframe (1H chart), the price action is now showing strong structural weakness and buying exhaustion.
Management Action: If you personally took a short-term trade on this counter, it is highly recommended to book your profits right here. Secure your gains before a potential short-term pullback happens, while long-term players can continue to monitor their macro setup.
AIRLINK: Bulls Eyeing a Breakout Above 170 | Next Stop 200?AIRLINK: Will 170 Finally Give Way?
AIRLINK has had a strong run since the March lows, climbing from around 120 to the 157 area. The stock has been making higher highs and higher lows, which is usually a good sign that buyers are still in control.
One thing I like about the chart is how AIRLINK managed to break above the 145–150 zone. This area had acted as resistance several times in the past, and the stock is now trading comfortably above it. As long as that breakout remains intact, the overall trend continues to look positive.
The next challenge, however, is right in front of us.
Key Resistance Levels
🔹 165–170 (Current resistance zone)
🔹 190–200 (Next major target area)
🔹 227.75 (All-Time High)
This 165–170 area is important because the stock has struggled here before. If buyers can push through it with strong volume, the chart could open up for a move toward the 190–200 region.
Key Support Levels
🔹 150
🔹 145
🔹 137
These are the levels I would be watching if the stock decides to take a breather after its recent rally.
Bullish Scenario
The bullish case is fairly straightforward.
If AIRLINK manages to close above 170 and hold that breakout, the next upside targets come into view quite quickly.
🎯 Target 1: 190
🎯 Target 2: 200
🎯 Target 3: 227 (ATH Retest)
The chart doesn't show a lot of major resistance between 170 and 190, which is why a breakout could attract fresh momentum buyers.
Bearish Scenario
Not every resistance breaks on the first attempt.
If AIRLINK gets rejected around 165–170, we could see some profit-taking after the recent rally. In that case, I would be watching the 150 and 145 areas first.
A pullback toward those levels would not necessarily change the trend. It would simply be a normal correction within a larger recovery.
The bullish structure would only start to weaken if the stock loses the 145 support zone.
Final Thoughts
For me, the chart looks constructive, but the story now revolves around one number: **170**.
The stock has already done the hard work by recovering from its lows and reclaiming important support levels. Now it's approaching the area where the market will decide whether this is just another bounce or the beginning of a larger move toward 200 and beyond.
That's the level I'll be watching in the coming sessions.
**Disclaimer:** This analysis reflects my personal view of the chart and is shared for educational purposes only. Please do your own research before making any investment decisions.
#AIRLINK #PSX #PakistanStockExchange #TechnicalAnalysis #ChartAnalysis #PriceAction #SwingTrading #Breakout #Bullish #SupportAndResistance #StocksToWatch #Investing #TradingView #Telecom #MarketAnalysis
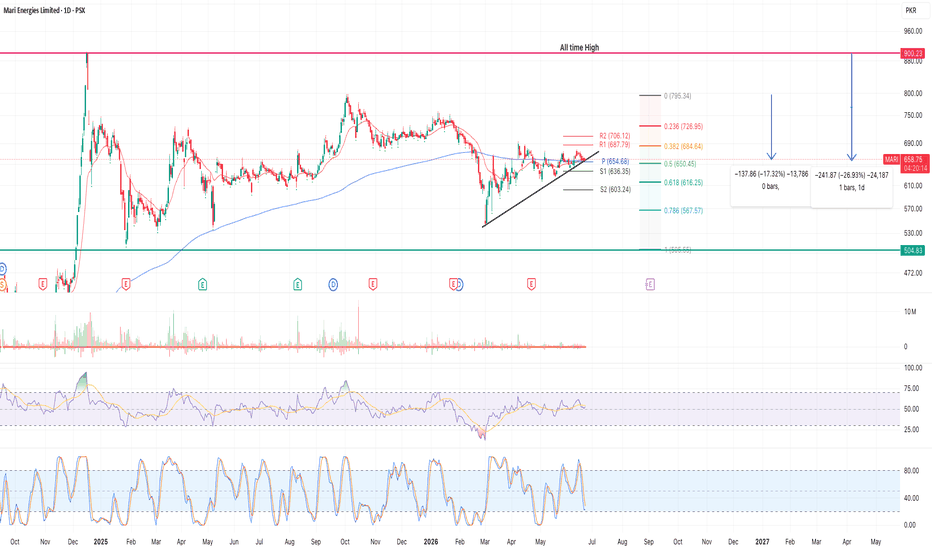
MARI: The Real Battle Isn't 900, It's 705Mari Energies (MARI) has been quietly building a strong base over the past few months, and the chart is starting to look increasingly interesting.
After recovering from the March lows, the stock has been making a series of higher lows while respecting a rising trendline. This tells us that buyers continue to step in on every meaningful pullback, keeping the overall trend structure intact.
At the moment, the most important zone on the chart is between 685 and 705. This area contains multiple resistance levels, including Fibonacci and Pivot resistance, making it the key hurdle that bulls need to overcome.
What stands out is that the stock has managed to hold above its longer-term moving average while the RSI remains in a healthy range. Momentum is neither overbought nor oversold, leaving room for a potential expansion move if buying pressure increases.
The only missing ingredient right now is volume. A convincing breakout above 705 accompanied by strong participation could open the door toward the 750–800 region, while a longer-term move toward the previous all-time high near 900 cannot be ruled out.
On the downside, the rising trendline and the 635–650 zone remain critical support areas. As long as these levels hold, the broader bullish structure remains valid.
Key Levels
🔹 Resistance: 685–705
🔹 Breakout Confirmation: Above 705
🔹 Support: 650
🔹 Major Support: 635
🔹 Bullish Targets: 750 → 800 → 900
For now, MARI appears to be in a "wait for confirmation" phase. The chart remains constructive, but the real signal will come when price decisively clears the 705 barrier.
What are your thoughts on MARI? Do you see a breakout coming, or will the stock continue consolidating before its next major move?
Disclaimer: This analysis is for educational purposes only and should not be considered financial advice. Always do your own research and manage risk accordingly.
#MARI #PSX #PakistanStockExchange #TechnicalAnalysis #ChartAnalysis #PriceAction #SwingTrading #Breakout #Bullish #SupportAndResistance #RSI #Fibonacci #StocksToWatch #OilAndGas #Investing #TrendAnalysis #MarketStructure #HigherLows #EnergySector #TradingView
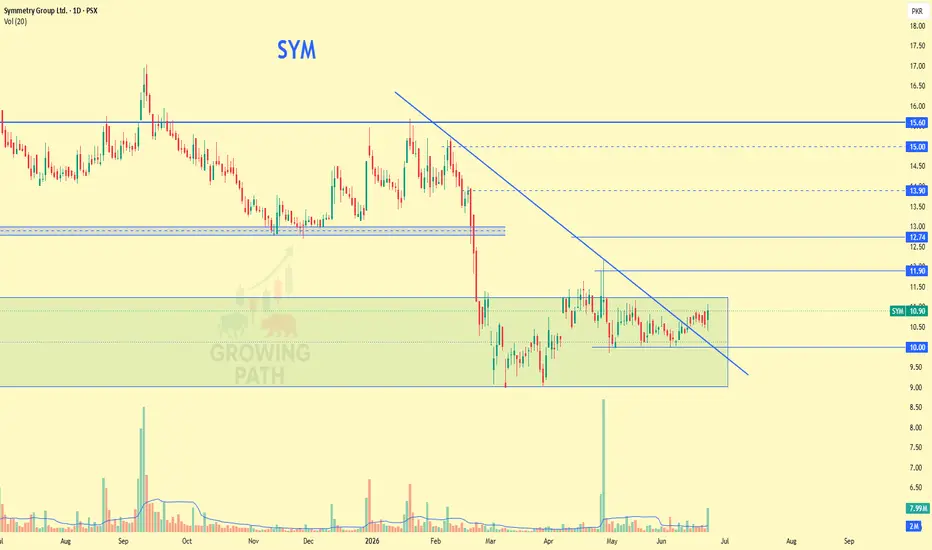
SYM | Accumulation Breakout Coming?
SYM is trading within a key accumulation zone between 10.50–11.00 while testing a long-term descending trendline. The formation of higher lows suggests buyers are gradually gaining control.
Entry: 10.50–11.00
Stop Loss: 10.00
Targets:
🎯 TP1: 11.90–12.00
🎯 TP2: 12.80–13.00
🚀 Extended: 14.00–15.00 (on strong breakout momentum)
A sustained move above the trendline with improving volume could open the path toward higher resistance levels. The setup remains valid while price holds above support.
Educational purpose only. Not financial advice.
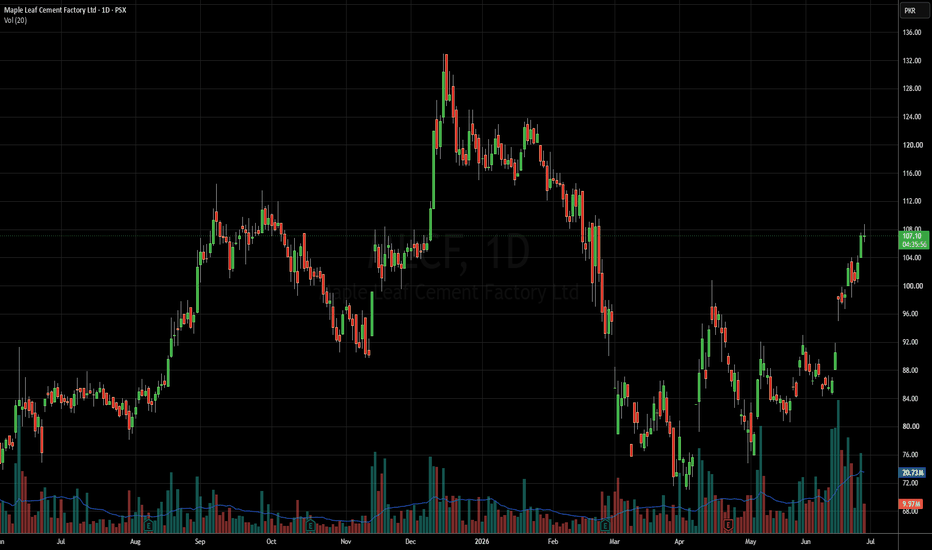
MLCF: A Classic Breakout with a Long-Term Growth CatalystWhy MLCF is a "Buy the Dip" Opportunity on the Monthly Chart
Technical Outlook:
The monthly chart for MLCF presents a compelling technical picture. The stock is currently breaking out of a long-term, multi-year consolidation phase (the pink trend area) on high volume (341.76M), signaling a potential major trend reversal 【turn0fetch0】. The RSI at 61.19 confirms bullish momentum without being overbought. Key levels to watch:
* Immediate Support: The ascending red trendline.
* Short-Term Resistance (TP1 & TP2): The chart's marked targets.
* Long-Term Target: The "Long-term TP" aligns with the fundamental expansion story.
Fundamental Catalyst:
The technical breakout is not happening in a vacuum. It is being fueled by a powerful fundamental catalyst: the Special Investment Facilitation Council (SIFC) has approved Maple Leaf's new cement plant as part of a larger $700 million sector investment package 【turn0search0】【turn0search20】【turn0search22】. This long-term capacity expansion story is the core reason for the bullish setup.
The Near-Term Fundamental Reality:
Investors must be aware of the current earnings picture. The most recent quarterly result (Q3 FY2026) showed a 30% year-on-year revenue surge to PKR 21.5 billion, driven by strong volume recovery. However, net profit declined by 18% YoY due to rising finance costs (PKR 1.6 billion) and higher taxes, highlighting near-term margin pressure.
The Investment Thesis:
This is a "near-term pain for long-term gain" stock. The technical breakout suggests the market is looking past the current margin squeeze and pricing in the future growth from the new plant. The fundamental data supports a long-term bullish view, with analysts forecasting a significant recovery in earnings and a consensus "Strong Buy" rating with an average 1-year price target of PKR 156.63 (a potential upside of ~55% from current levels)
Conclusion:
MLCF presents a rare opportunity where a clear technical breakout aligns with a transformative fundamental catalyst. While near-term earnings may be volatile, the long-term capacity expansion story under SIFC approval makes it a compelling investment for patient investors with an 8-18 month horizon. The risk is managed as long as the stock holds above the red trendline support on the monthly chart.