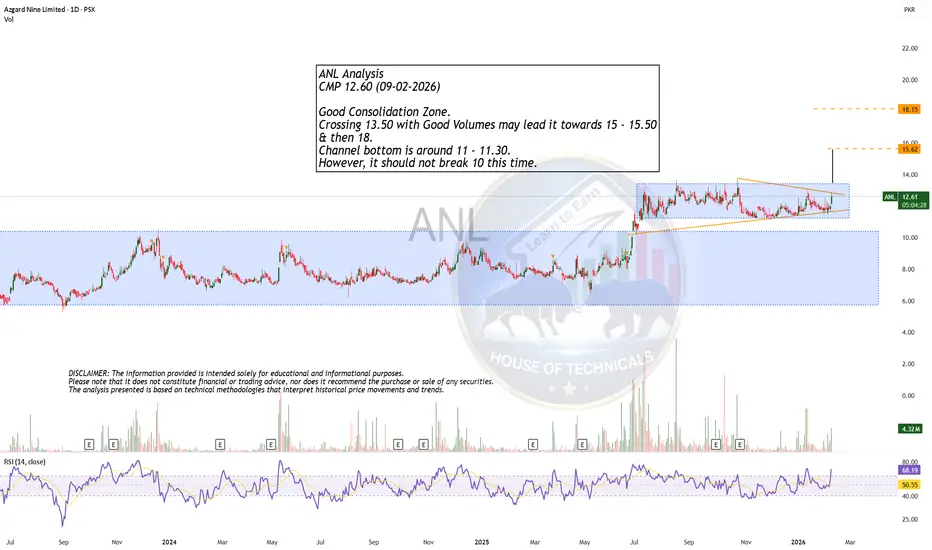
Ittefaq - LongAs of January 2026, Ittefaq is trading as a "penny stock" with high volatility. Here is the evaluation based on current market data and technical setups.
1. Financial & Fundamental Snapshot: Ittefaq has struggled with profitability recently, reporting a loss per share (EPS) of roughly PKR -4.38 for the trailing twelve months. However, it is trading at a significant discount to its Book Value (~PKR 23.62), making it a "deep value" play if the sector recovers.
Market Sentiment: Speculative / Bullish Reversal Key Risk High energy costs & weak gross margins
2. Technical Evaluation (Targets & Stop Loss): The stock is currently consolidating after a breakout from its long-term base. Many technical traders are watching the PKR 9.50 - 10.00 support zone closely.
Trading Plan for Jan/Feb 2026: Entry Range: PKR 10.00 - 10.30
Target 1 (Short-term): PKR 12.50 (Previous resistance level)
Target 2 (Medium-term): PKR 14.80 (Measured move from the weekly breakout)
Target 3 (Long-term): PKR 16.15 (Aligns with the Fibonacci extension)
Stop Loss (Strict): PKR 8.90 (A close below this level invalidates the bullish setup and sends it back into the "dead zone")
3. Sector Outlook Positive: Interest rate cuts in Pakistan are starting to stimulate the construction industry, which could lead to a "re-rating" of small-cap engineering stocks like Ittefaq.
Negative: High electricity tariffs remain a massive hurdle for steel furnaces. The Pakistan Association of Large Steel Producers (PALSP) is currently lobbying for lower power rates to keep the industry viable.
Summary Recommendation: Ittefaq is a speculative buy. It is not a "sleep-well-at-night" stock like MLCF or Lucky Cement. It is best suited for traders looking for high percentage gains on a breakout rather than long-term dividend investors.
Pro Tip: Keep your position size small. Because ITTEFAQ is a low-priced stock, even a PKR 1.00 move is a 10% swing in your portfolio.
DWAE – SECOND BUY SETUP | H | 22 JAN | By The Chart Alchemist DWAE – TECH BUY SET-UP | H | 22 JAN | By The Chart Alchemist
• Buy 1: Rs. 29.55 (current price)
• Buy 2: Rs. 26.40
Target Prices:
• TP1: Rs. 35.00
• TP2: Rs. 42.00
• TP3: Rs. 53.00
• TP4: Rs. 63.00
SL (H closing): Below Rs. 23.90
📢 Disclaimer: All trade signals are shared for informational purpose.
Do your own research before taking any position – “No claim, No blame”
GCIL BULLISH MOVE CONTUATION ON THE CHARTSThe script GCIL is looking good on the charts while making new HH's and HL's and showing a symmetrical behavior with a pullback of around 17-19% and then upside move of Rs. 11. The projections are of Rs. 44.5 as first targets .
The company is also fundamentally good and doing great.
What are your views ????
TATM (PSX) 30 MIN TIME FRAME
# Market Structure & Trend
* **Short-term trend has turned bullish**
* Price has **reclaimed the EMA Ribbon** (EMA 21, 50), which is a strong trend-reversal signal.
* EMA 21 is crossing above EMA 50 → **early bullish momentum confirmation**.
* Price is now trading **above key support 167.80–165.70**, which previously acted as resistance.
## 📈 Price Action Analysis
* Strong **bullish impulsive candle** breaking above recent consolidation.
* Breakout occurred with **expanding volume**, confirming genuine buying interest.
* Current price near **179.96**, approaching a **previous supply / resistance zone**.
**Key Levels**
* **Immediate Resistance:** 180.00 – 185.00
* **Major Resistance:** 190.00
* **Strong Support:** 167.80
* **Major Demand Zone:** 155.70
---
## 📉 Indicators Review
### 🔹 RSI (14)
* RSI at **77+**
* Indicates strong momentum, but **short-term pullback or consolidation is possible**
* Bullish as long as RSI holds above **55–60**
### 🔹 MACD (12,26)
* **Bullish crossover**
* Histogram expanding upward → momentum accelerating
* Confirms trend continuation, not exhaustion yet
### 🔹 DMI / ADX
* **+DI (green) above -DI (red)** → buyers in control
* ADX rising → **trend strength increasing**
* This supports further upside after minor retracements
### ✅ Bullish Scenario (Preferred)
* **Buy on pullback** near:
* 172 – 168 zone (EMA support)
* **Targets:**
* TP1: 185
* TP2: 190
* **Stop Loss:** Below 165 (daily close basis)
### ⚠️ Risk Scenario
* If price **fails to hold above 168**, expect:
* Retest of 160–155 demand zone
* Avoid fresh buying if price breaks **165 with volume**
## 📌 Final Verdict
✔ Trend reversal confirmed
✔ Momentum strong
✔ Best strategy: **Buy the dip, not the breakout**
FFL Bullish ABCD Breakout Setup FFL has closed above its supply zone and is currently trading above it, suggesting the start of a new bullish leg. Based on the ABCD harmonic projection, the next leg could extend toward 27 rupees. A buy at the current market price is recommended, with a stop loss below the last demand zone.
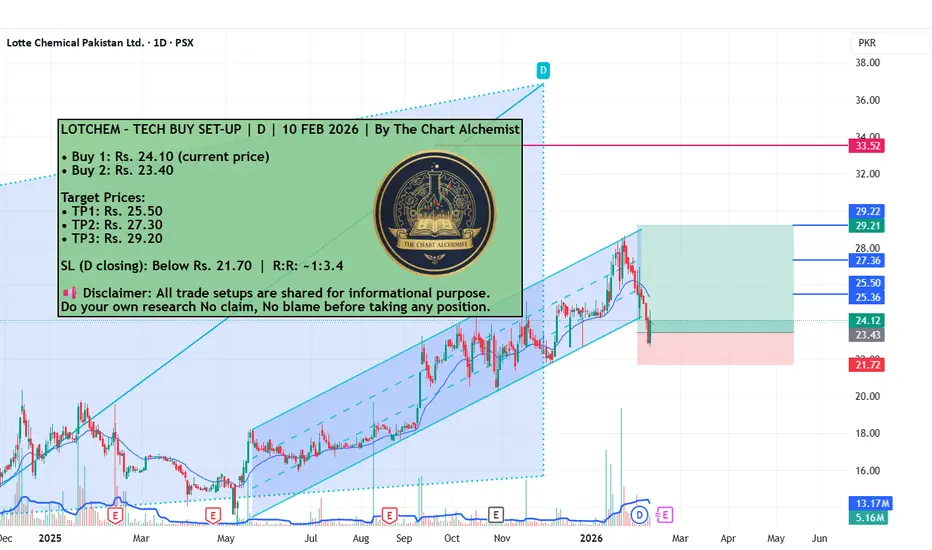
LOTCHEM BUYING OPERTUNITYLOTCHEM BUYING OPERTUNITY
✅ Entry
Buy zone: 30.20 – 30.80
(30 strong support, wait for pullback)
🛑 Stop Loss 28.80 if daily close below then exit
🎯 Targets
Target 1: 32.50
Target 2: 34.00
Extended Target: 35.50 (if market still strong then hold)
📈 Risk–Reward
Risk ≈ 1.5 – 2.0 rupees
Reward ≈ 4 – 5 rupees
TPL Corp Ltd (PSX) – Trendline Breakout Setup
TPL Corp is trading in a well-defined ascending trendline, indicating a bullish structural bias on the higher timeframe. After a strong impulsive move, price has entered a healthy pullback and consolidation phase, respecting trendline support — a classic continuation setup.
🔹 Bias: Bullish
🔹 Analysis: Rising Trendline / Continuation Pattern
Trade Plan
Buy Zone / Buy Stop: 9.20 – 9.60
→ Entry planned only on strength above consolidation, confirming continuation.
Stop Loss: 8.27
→ Below trendline and recent swing structure to invalidate bullish bias.
Targets
TP1: 11.37 – Previous resistance / partial profit zone
TP2: 14.40 – Major supply zone and measured move target
📈 Technical Confluence
Price holding above a rising trendline
Higher-low structure intact
RSI stabilising around mid-range with bullish divergence previously printed, suggesting momentum rebuilding
Risk-reward remains favourable if breakout sustains
🧠 Fundamental Context (Supportive)
TPL Corp, founded in 2000, has recently shown financial turnaround, reporting profitability in the quarter ended September 30, 2025, driven by strong revenue growth and cost management. Strategic partnerships with PTCL Group and Jazz add longer-term confidence, supporting the bullish technical outlook.
⚠️ Invalidation
A sustained break below 8.27 will negate this setup and signal deeper correction risk.
👉 Trade with confirmation. Risk management is key.
MFFL-NEXT BIG MOVE ?This analysis is purely based on the technicals.
1.FIB retracement at same exact level @ 0.786 - 0.886
2.Consoldiation of 260 Days
3.MACD crossover below the zero line
4.Retest completed
5.Spring @Buy 1/Buy2 (WT)
6.Price sustaining above EMA13
7.Volume improving with decrease in selling pressure.
CLOV – TECH BUY SET-UP | D | 21 JAN 2026 |By The Chart AlchemistCLOV – TECH BUY SET-UP | D | 21 JAN 2026 | By The Chart Alchemist
• Buy 1: Rs. 50 (current price)
• Buy 2: Rs. 47.3
Target Prices:
• TP1: Rs. 52
• TP2: Rs. 56
• TP3: Rs. 61
SL (D closing): Below Rs. 45 | R:R:5
📢 Disclaimer: All trade signals are shared for informational purpose.
Do your own research No claim, No blame
BUY CALL – NML (Swing Trade)Current Rate: 184
Buying Zone: 184
Stop Loss: 167.34
Targets:
Upside Targets: 200 → 215 → 234
Expected gain 27%
Time Frame: Medium Term (Swing)
Note: The price has retraced to its key support zone and formed a hammer candlestick , indicating a bullish reversal. This price action suggests renewed buying interest and signals a potential continuation of the prevailing uptrend.