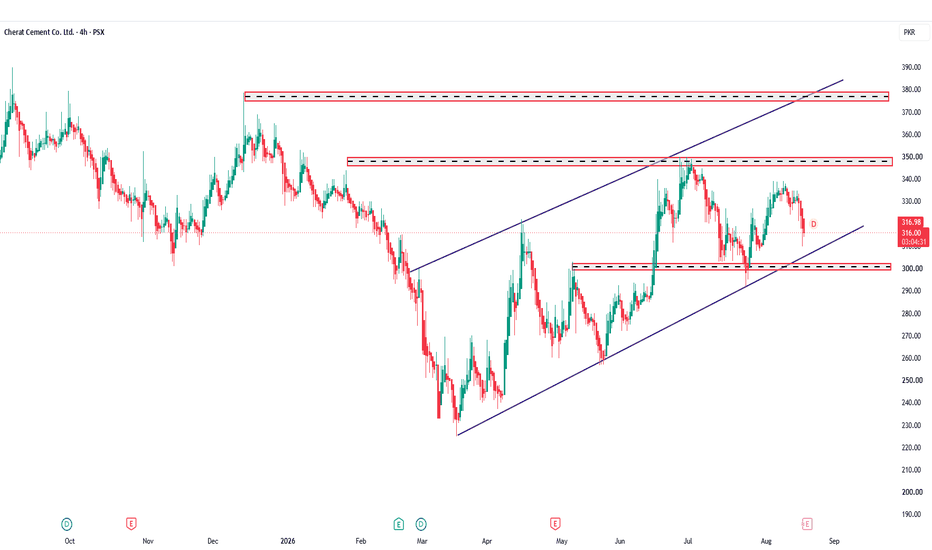
CHCCTwo scenarios
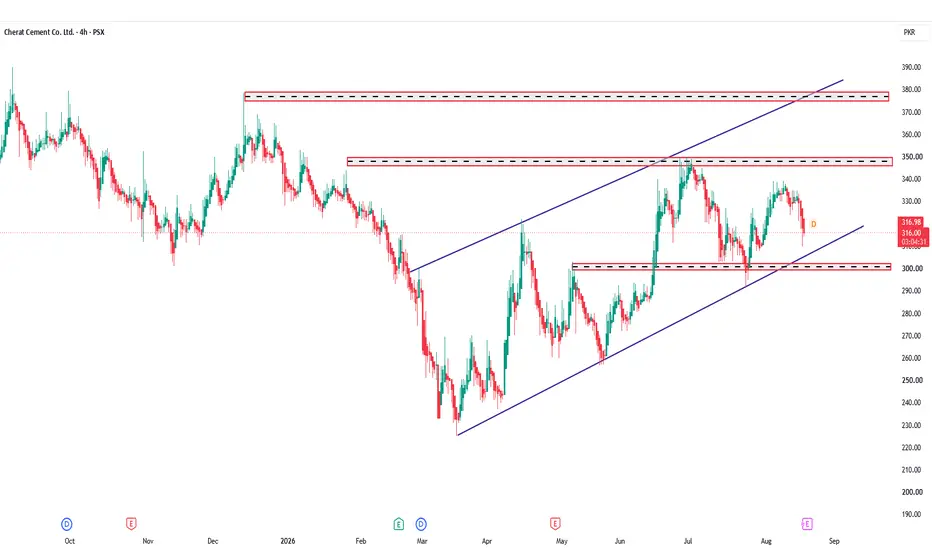
Bullish: If CHCC holds 300–305 and produces a strong 4H bullish rejection, I would expect 325 → 335/340 → 348/350. A confirmed 4H close above 350 would be a major development and could open 360, followed by 375–380.
Bearish: A decisive 4H close below 299, especially followed by a failed retest of 300, would damage the current structure. Then 290–292 becomes important; below that, the probability of a deeper correction toward 275–280 and eventually 260 rises.
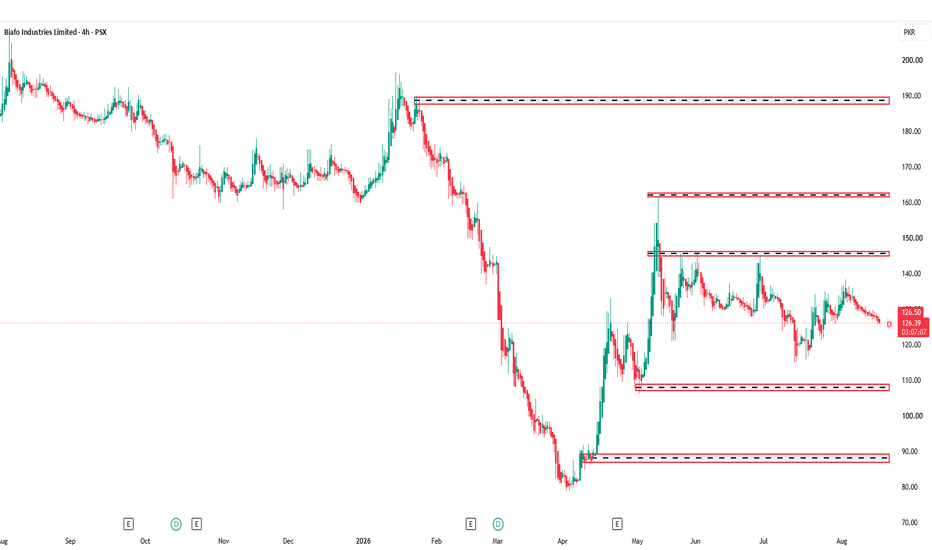
BIFOSince the May spike, BIFO has repeatedly failed to sustain moves above 145–147. More recently, the August move reached roughly 136–137 and has rolled back toward 126.
So I would classify the current 4H structure as neutral to mildly bearish, not yet a strong bullish setup.
The important point is 120. As long as BIFO holds roughly 119–120, the larger consolidation remains intact. A decisive 4H close below 119 would increase the probability of a move toward 108–110.
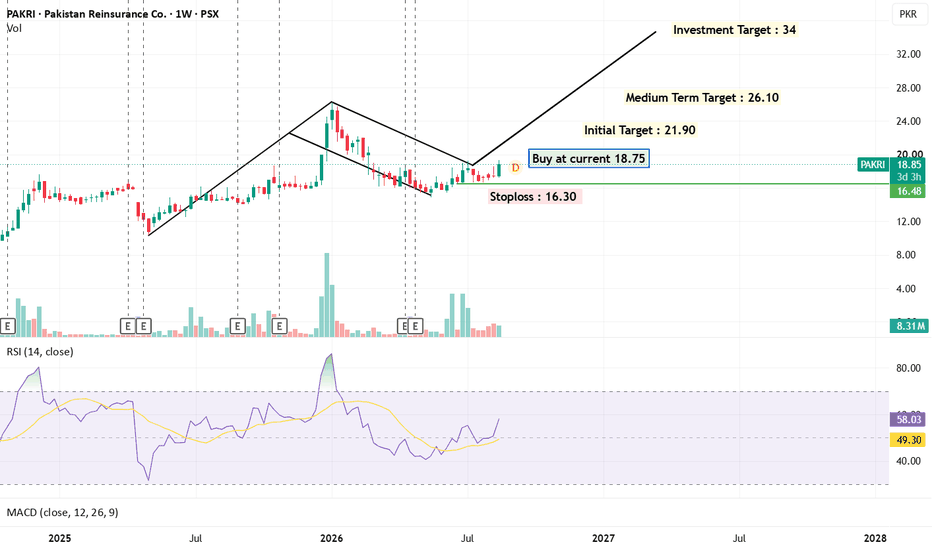
PAKRI becoming BullishTECHNICAL ANALYSIS: PAKRI (Pakistan Reinsurance Co.)
PAKRI is showing a bullish breakout on the weekly chart from a Cup & Handle pattern on a daily basis and a Flag pattern on a weekly basis.
KEY TRADE LEVELS
Entry Zone: Buy at current market price (19.00) or crossing above 19.30
Stop Loss: 16.30 (Strict risk management level)
Total Risk Per Share: 2.70 (based on 19.00 entry)
PROFIT TARGETS & RISK/REWARD RATIOS
Initial Target: 21.90
Reward: 2.90 | Risk to Reward Ratio: 1 : 1.07
Medium Term Target: 26.10
Reward: 7.10 | Risk to Reward Ratio: 1 : 2.63
Investment Target: 34.00
Reward: 15.00 | Risk to Reward Ratio: 1 : 5.56
#FaizanResearchDesk
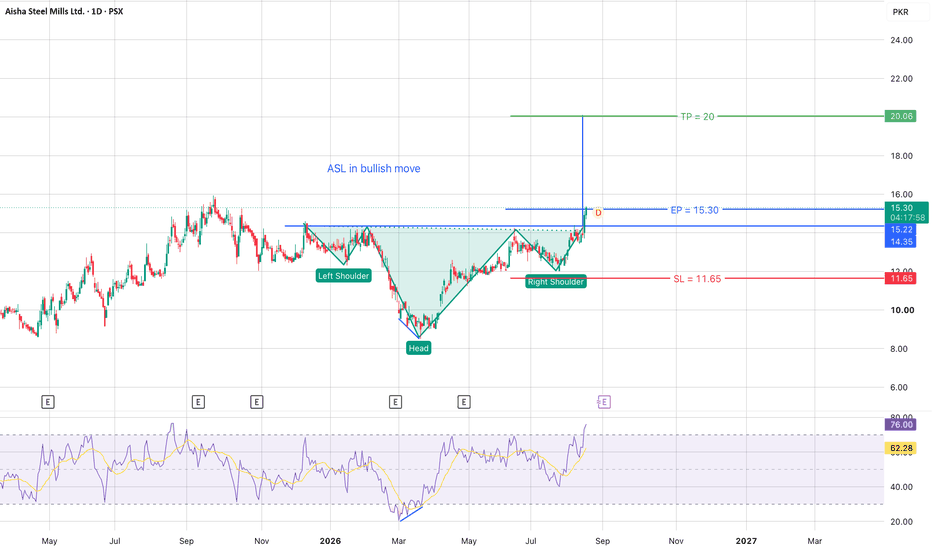
ASL Inverted Head & Shoulders Breakout# ASL – Aisha Steel Mills Ltd. | Inverted Head & Shoulders Breakout
ASL Technical Analysis – Inverted Head & Shoulders Bullish Breakout
Disclaimer: This analysis is for educational purposes only and should not be considered financial advice. Always follow proper risk management before taking any trade.
ASL has formed an Inverted Head and Shoulders pattern on the daily timeframe and has successfully broken above the neckline resistance around 14.50 .
The breakout above the neckline indicates a potential bullish trend reversal and opens the possibility of further upside toward the projected target of 20.00 .
Entry Price (EP): 15.30 – CMP
The current price around 15.30 is trading above the neckline breakout level, providing a potential continuation entry following the confirmed breakout.
Stop Loss (SL): 11.65
The stop loss is placed below the key structure support. A sustained move below this level would invalidate the current bullish setup.
Target (TP): 20.00
The projected target from the Inverted Head and Shoulders pattern is around 20.00.
Risk & Reward Analysis
Based on EP = 15.30:
• Risk: 15.30 − 11.65 = 3.65
• Maximum Risk: ~23.86%
• Potential Reward: 20.00 − 15.30 = 4.70
• Potential Gain: ~30.72%
• Risk-to-Reward Ratio: ~1 : 1.29
Trading Plan
• The 14.50 neckline breakout is the key bullish confirmation.
• EP at 15.30 represents the current breakout/continuation level.
• Maintain the stop loss at 11.65 .
• Monitor price action as it approaches the 20.00 target.
• If the price continues to move in favor of the trade, the stop loss can be progressively trailed to protect capital and accumulated gains.
The Inverted Head and Shoulders structure provides the bullish thesis, while disciplined risk management remains essential if the setup fails.
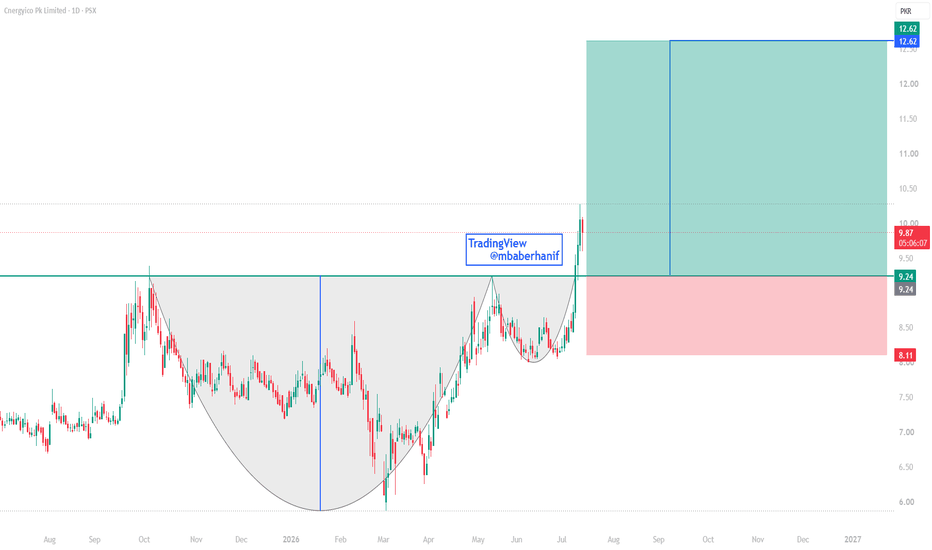
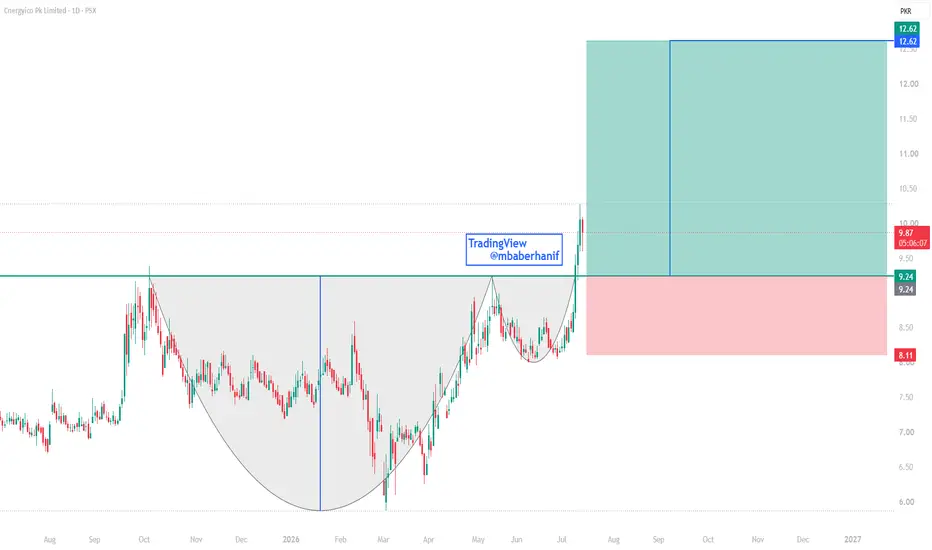
CNERGY | CUP & HANDLE PATTERN IN PLAYCNERGY has confirmed a rounded bottom (Cup & Handle) breakout above the key resistance of PKR 9.24, indicating potential for further upside.
Position: Buy (LONG)
Entry: Around PKR 9.24
Target: PKR 12.62
Stop Loss: PKR 8.11
Technical View:
Strong breakout above 9.24 confirms bullish momentum.
Pattern projection suggests an upside target of 12.62.
8.11 serves as the key support; a close below it would invalidate the bullish setup.
Any pullback towards 9.24 may offer a favorable re-entry opportunity.
Manage your risk with proper position sizing and avoid chasing extended moves.
HTL — Breakout ContinuationHTL is breaking above a multi-month base. The 9.4× volume explosion signals a structural shift in accumulation. SMA200 (48.82) is the immediate hurdle — a daily close above it opens the Fibonacci extension targets. Weekly MACD just crossed bullish, confirming the higher-timeframe trend change. With all three timeframes aligned and RSI only 63.4, there's plenty of room before overbought exhaustion.
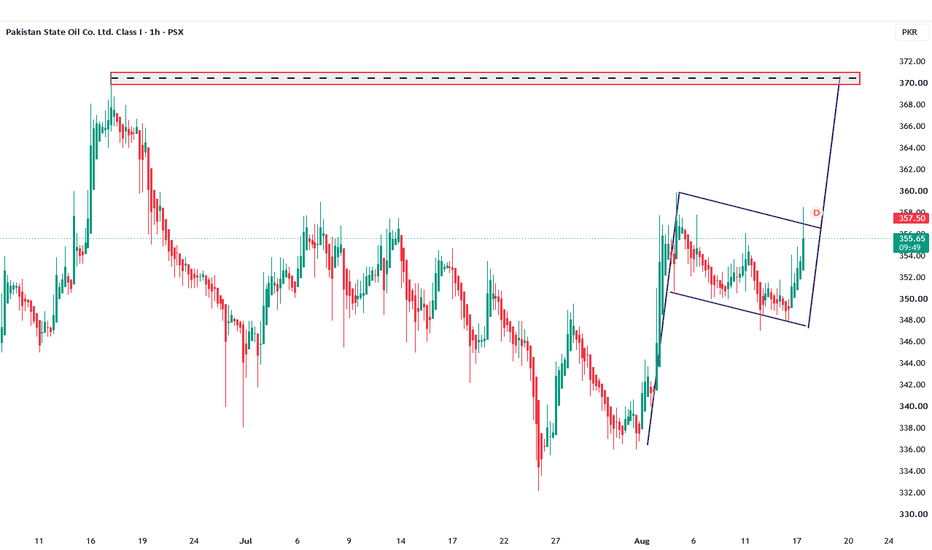
PSO — Pakistan State Oil (1D)PSO is trading in a long consolidation after a major correction. The risk-reward is attractive near current levels as long as 340 holds. A breakout above 362 could trigger the next leg higher toward 375, followed by 390–420 over the medium term.
Educational Purpose Only — Not Financial Advice.
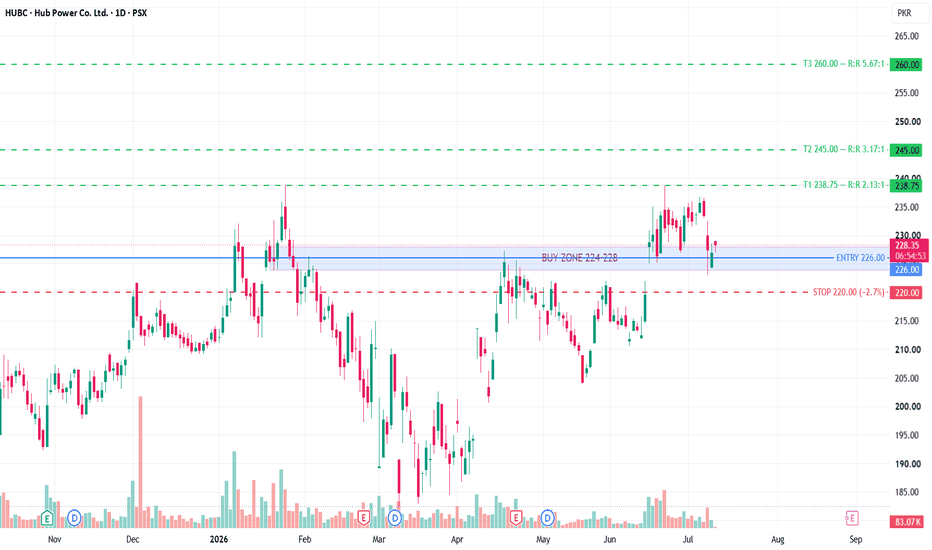
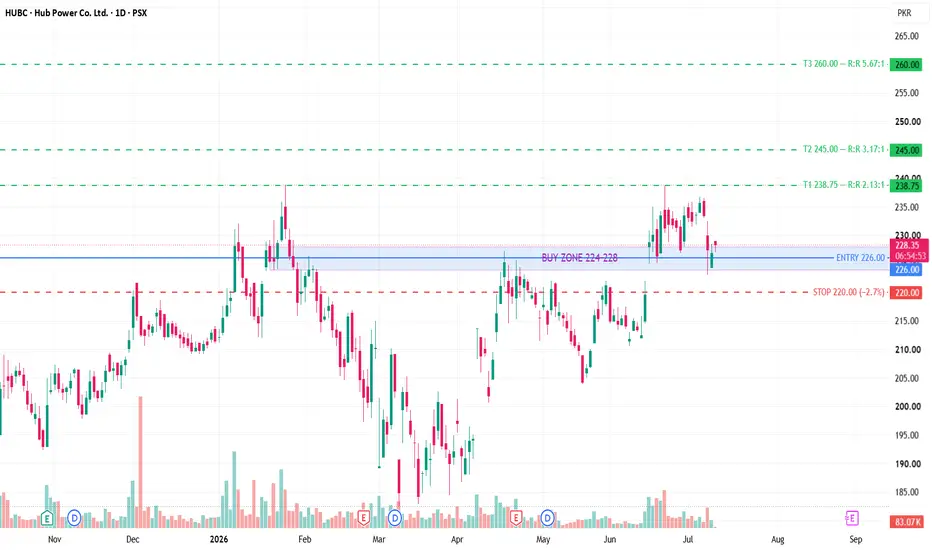
HUBCHUBC remains in a broader uptrend, although the stock has recently entered a consolidation phase after its strong advance. The current pullback is bringing price into a key support zone around 224–228 PKR, where the 38.2% Fibonacci retracement, EMA20/EMA50, and weekly support levels converge. With the RSI cooling to 50.5, momentum has largely reset, creating the potential for a fresh swing entry if buyers step back in.
An entry near 226 PKR offers a balanced risk-to-reward opportunity, with a stop loss below 220 PKR to protect against a deeper correction. If the support zone holds, HUBC could first target 238.75 PKR, followed by 245.00 PKR, while a stronger bullish continuation may extend toward 260.00 PKR. Although the setup is slightly less aggressive than some other names due to the ongoing consolidation, the multiple technical confluences still make HUBC an attractive swing trade candidate with 7/10 confidence and an estimated 68% probability of success.
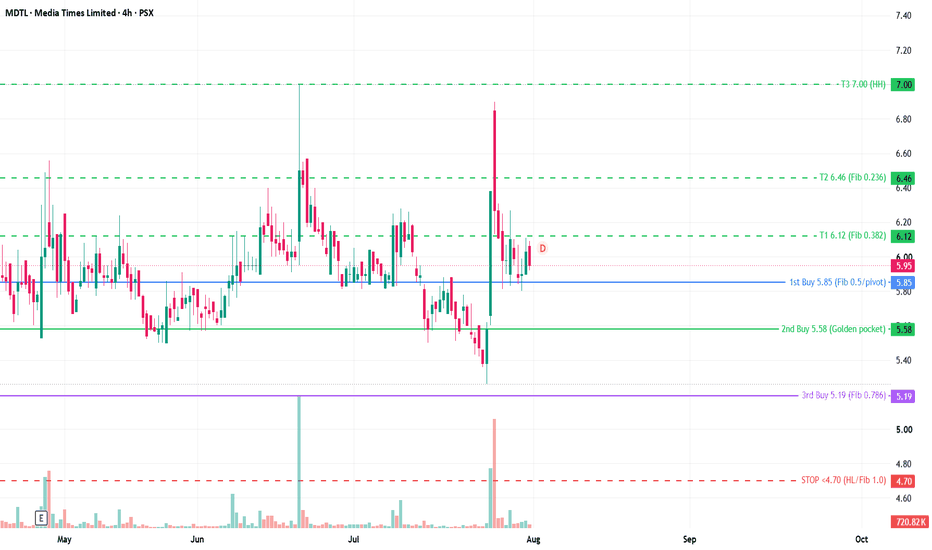
MDTL VERDICT: Bullish, but NOT a clean entry at current price
price at 5.94 it's above the golden pocket (5.58–5.51), not yet retracing into it. And volume is drying up (0.37× avg) with no accumulation signal at current levels.
Risk Plan — don't chase mid-range; wait for the retrace
1st Buy: 5.85
2nd Buy: 5.58 (5.58–5.51) high-probability zone
3rd Buy: 5.19
Stop: daily close below 5.26
Targets: T1 6.12 (R:R 1.7:1 from 2nd buy), T2 6.46, T3 7.00 (R:R 4.4:1 from golden pocket)
the golden-pocket entry (2nd buy) is the sweet spot — wait for 5.58, don't chase 5.94.
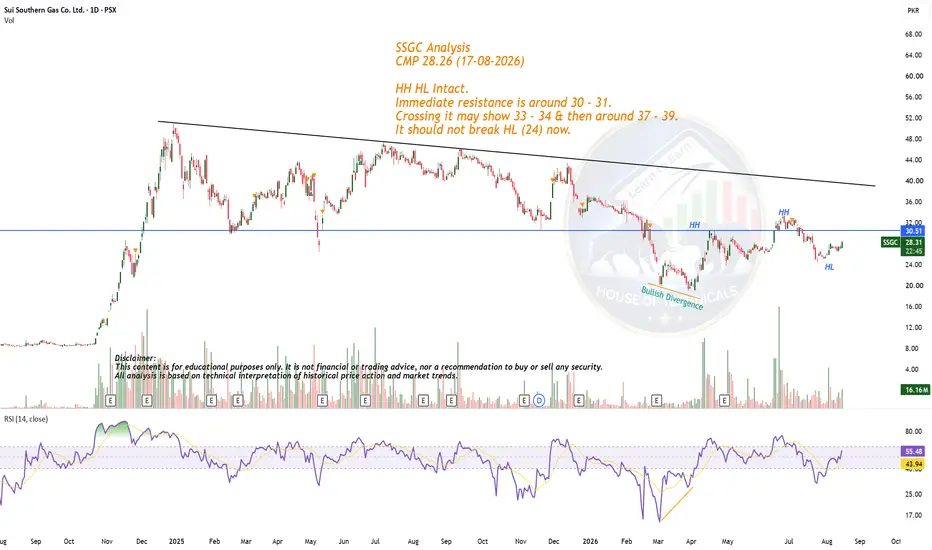
ABCD in SYM!SYM Analysis
Closed at 11.70 (02-07-2026)
HH HL.
ABCD pattern may play targeting around 13.50.
In case of selling pressure, important support seems
to be around 10.50 - 10.70
13.50 - 13.60 may act as strong resistance. Monthly
closing above this level is required for further upside.
It should not break its HL (around 9.80) now.
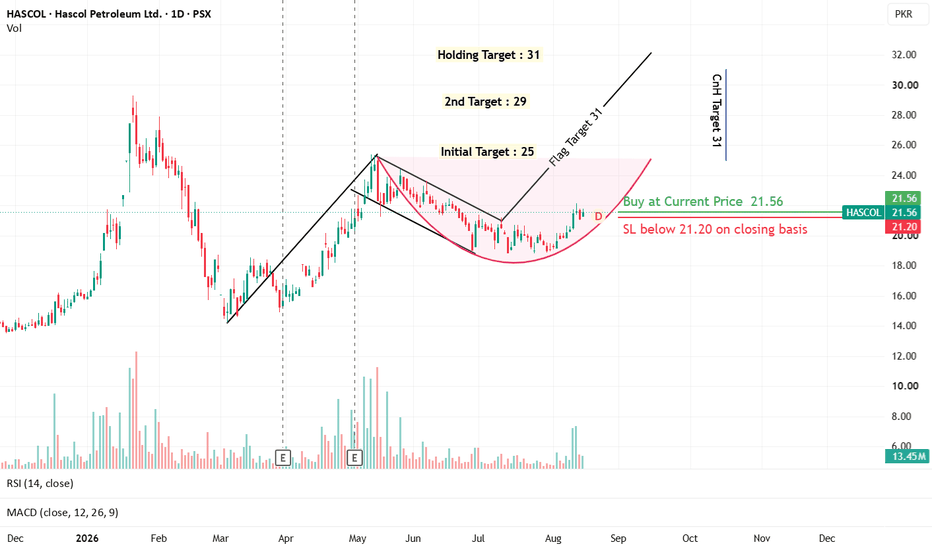
HASCOL on a strong moveHASCOL Petroleum Ltd. (PSX) — Trade Strategy
Trade Setup
Entry: PKR 21.56 (Current Market Price)
Stop Loss (SL): PKR 21.20 (Daily closing basis)
Max Risk: PKR 0.36 per share
Pattern:*Bullish Cup & Handle forming over a Flag pattern.
Targets & Risk-to-Reward
Initial Target (PKR 25.00): +PKR 3.44 reward (1 : 9.5 R:R). Book 30%–50% profits and move Stop Loss to breakeven (PKR 21.56).
2nd Target (PKR 29.00): +PKR 7.44 reward (1 : 20.6 R:R). Lock in additional gains and trail Stop Loss upward under recent swing lows.
Holding Target (PKR 31.00): +PKR 9.44 reward (1 : 26.2 R:R). Full exit based on complete pattern height projections.
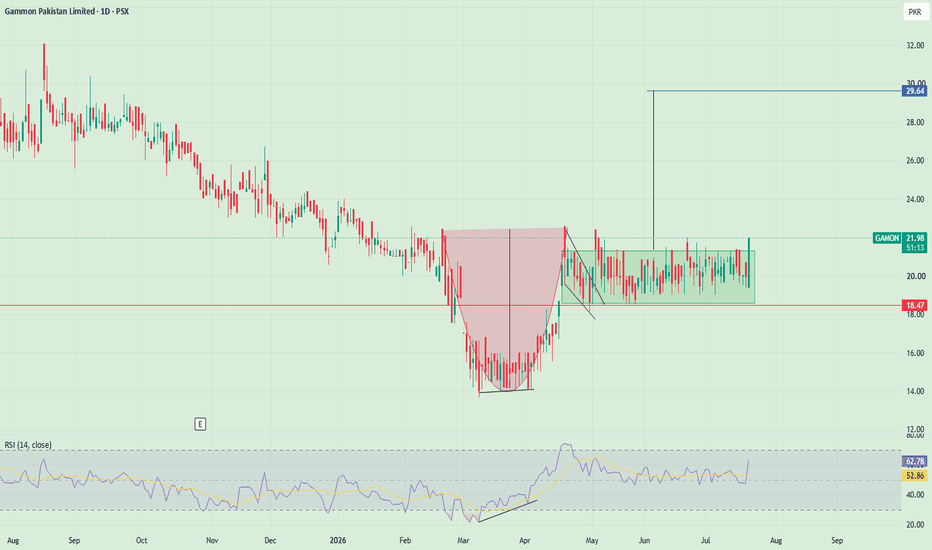
GAMON-Breakout bullish ProjectionGAMON has recently broke out of the consolidation box,there is also a bullish divergence backing the bullish stance,as per bullish cup and handle projection,the target is around 30.With a stop loss of 18.45 the target area of 30 presents a nice and healthy 35-40% up side.
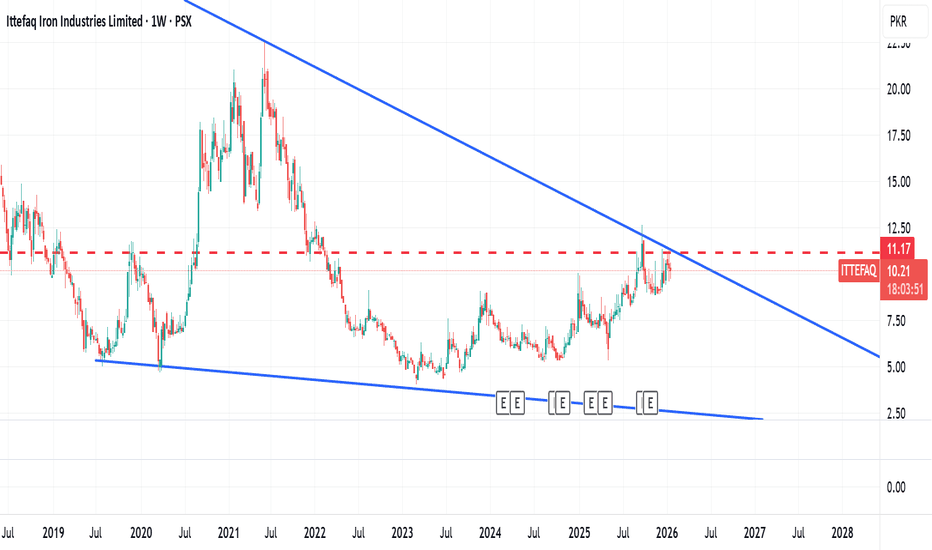
Ittefaq - LongAs of January 2026, Ittefaq is trading as a "penny stock" with high volatility. Here is the evaluation based on current market data and technical setups.
1. Financial & Fundamental Snapshot: Ittefaq has struggled with profitability recently, reporting a loss per share (EPS) of roughly PKR -4.38 for the trailing twelve months. However, it is trading at a significant discount to its Book Value (~PKR 23.62), making it a "deep value" play if the sector recovers.
Market Sentiment: Speculative / Bullish Reversal Key Risk High energy costs & weak gross margins
2. Technical Evaluation (Targets & Stop Loss): The stock is currently consolidating after a breakout from its long-term base. Many technical traders are watching the PKR 9.50 - 10.00 support zone closely.
Trading Plan for Jan/Feb 2026: Entry Range: PKR 10.00 - 10.30
Target 1 (Short-term): PKR 12.50 (Previous resistance level)
Target 2 (Medium-term): PKR 14.80 (Measured move from the weekly breakout)
Target 3 (Long-term): PKR 16.15 (Aligns with the Fibonacci extension)
Stop Loss (Strict): PKR 8.90 (A close below this level invalidates the bullish setup and sends it back into the "dead zone")
3. Sector Outlook Positive: Interest rate cuts in Pakistan are starting to stimulate the construction industry, which could lead to a "re-rating" of small-cap engineering stocks like Ittefaq.
Negative: High electricity tariffs remain a massive hurdle for steel furnaces. The Pakistan Association of Large Steel Producers (PALSP) is currently lobbying for lower power rates to keep the industry viable.
Summary Recommendation: Ittefaq is a speculative buy. It is not a "sleep-well-at-night" stock like MLCF or Lucky Cement. It is best suited for traders looking for high percentage gains on a breakout rather than long-term dividend investors.
Pro Tip: Keep your position size small. Because ITTEFAQ is a low-priced stock, even a PKR 1.00 move is a 10% swing in your portfolio.