Long
Long
 Long
Long
Long 
 Long
Long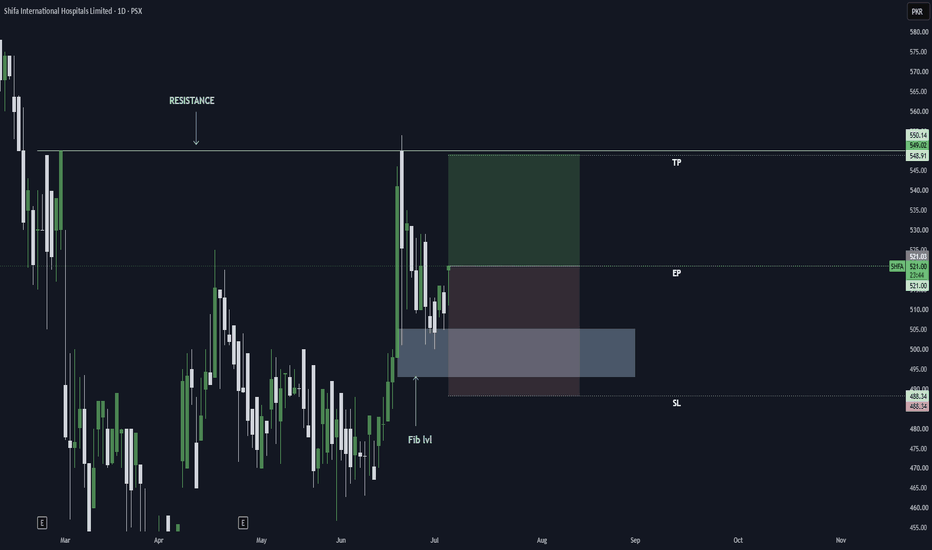
Kohinoor Energy Limited | July 06, 2026Kohinoor Energy Limited — Daily Bullish Continuation Idea | July 06, 2026
Symbol: Kohinoor Energy Limited — PSX
Timeframe: Daily
Chart Date: July 06, 2026
Kohinoor Energy Limited is showing a constructive bullish setup on the daily timeframe. After forming a base near the lower area, price delivered a strong bullish reaction and then started building a clean consolidation range above the previous imbalance zone.
Now the market is trying to move higher again from this range. The recent structure shows that buyers are still defending the area, and if price continues to hold above the range support, the next draw on liquidity can be the marked upside target.
My main idea is simple:
as long as price respects the current daily dealing range and does not break aggressively below it, I will look for a possible bullish continuation toward the higher target area.
For confirmation, I want to see:
Price holds above the current range support
No strong bearish close back below the structure
Bullish candles continue from this area
Breakout above the short-term range high
Continuation toward the marked target
I am not interested in chasing emotionally. A clean hold, retest, or breakout confirmation will make the idea stronger.
Patience pays. Confirmation is more important than prediction.  Long
Long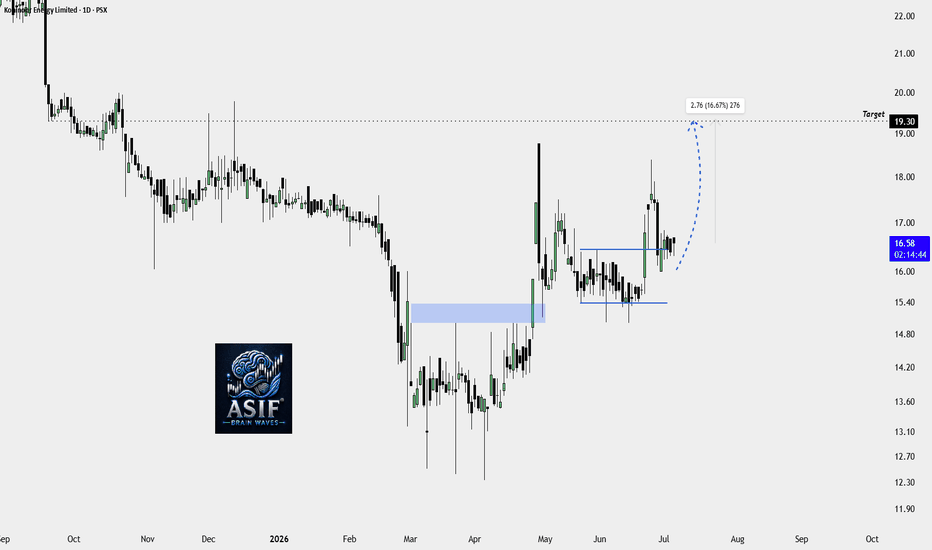
 Long
Long
 Long
Long
MUGHAL | Breakout Above PKR100 Could Unlock the Next Bullish LegAfter several months of rebuilding its structure, MUGHAL is once again approaching a key resistance zone that has rejected price multiple times in the past.
What caught my attention isn't just the rally—it's the improvement in market structure. The stock has transitioned from making lower lows to forming higher lows and higher highs, suggesting that buyers are gradually regaining control.
The highlighted ABCD measured move projects a potential upside objective around PKR 130, but that projection only comes into play if price can successfully clear the major resistance ahead.
Technical Overview
Price is trading above the 200-day moving average, indicating improving long-term sentiment.
The recent advance has created a series of higher lows, keeping the bullish structure intact.
RSI is strengthening and approaching bullish territory, reflecting positive momentum.
The ABCD harmonic projection points toward the PKR 130 region as a potential measured move.
🎯 Key Levels to Watch
🟨 Resistance Zone
PKR 95 – 100
This remains the most important area on the chart. It aligns with:
Previous swing resistance
Psychological Rs100 level
R1 and R2 Pivot Resistance
A decisive close above this zone, supported by stronger volume, would significantly improve the bullish outlook.
🟢 Support Levels
Pivot: PKR 83.87
As long as price holds above the pivot area, buyers remain in control.
Additional supports:
S1: PKR 77.75
S2: PKR 67.89
📈 Trading Plan
✅ Bullish Scenario
If MUGHAL closes above the 95–100 resistance zone with convincing volume, it would confirm a breakout and could pave the way for the next leg higher. In that case, the ABCD projection around PKR 130 becomes a realistic medium-term objective.
⏳ Neutral Scenario
If buyers fail to break resistance immediately, the stock may continue consolidating between the pivot area and resistance. A period of sideways movement after a strong rally would be healthy before another attempt.
⚠️ Bearish Scenario
A sustained move below the pivot level would weaken the current bullish structure and could increase the probability of a retest of the lower support zones.
💭 My View
The chart is becoming increasingly constructive, but I believe the 100 area is the real decision point.
Rather than chasing the current move, I would prefer to see a confirmed breakout with participation before assuming the measured move will play out.
For now, the trend favors the bulls—but confirmation remains the key.
⚠️ Disclaimer
This analysis is shared for educational purposes only and reflects my personal interpretation of the chart. It is not financial or investment advice. Always conduct your own research and use proper risk management before making any trading decisions.
#MUGHAL #PSX #PakistanStockExchange #TechnicalAnalysis #PriceAction #ChartPattern #ABCDPattern #SwingTrading #Breakout #StockMarket #Investing #TradingView #SupportResistance #MarketStructure #RiskManagement  Long
Long
 Long
Long
 Long
Long
Long 
Long 
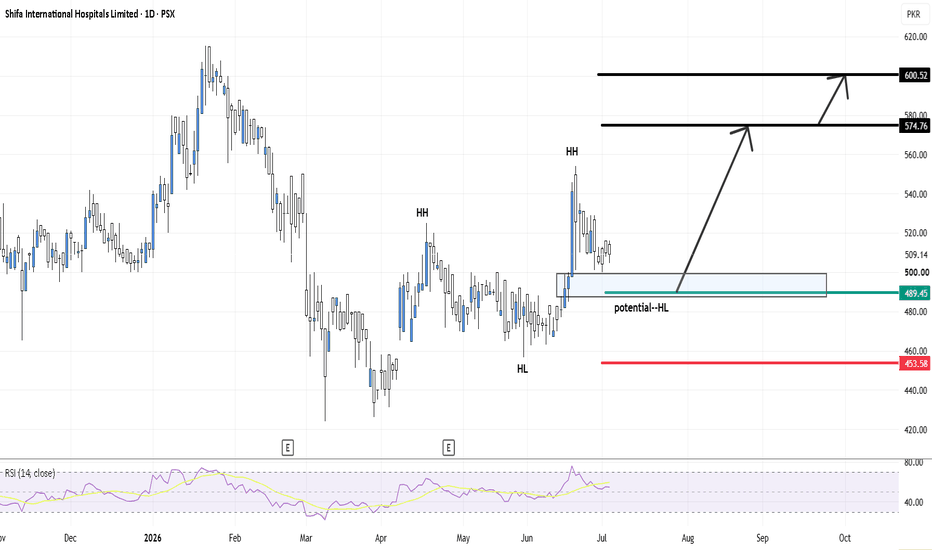
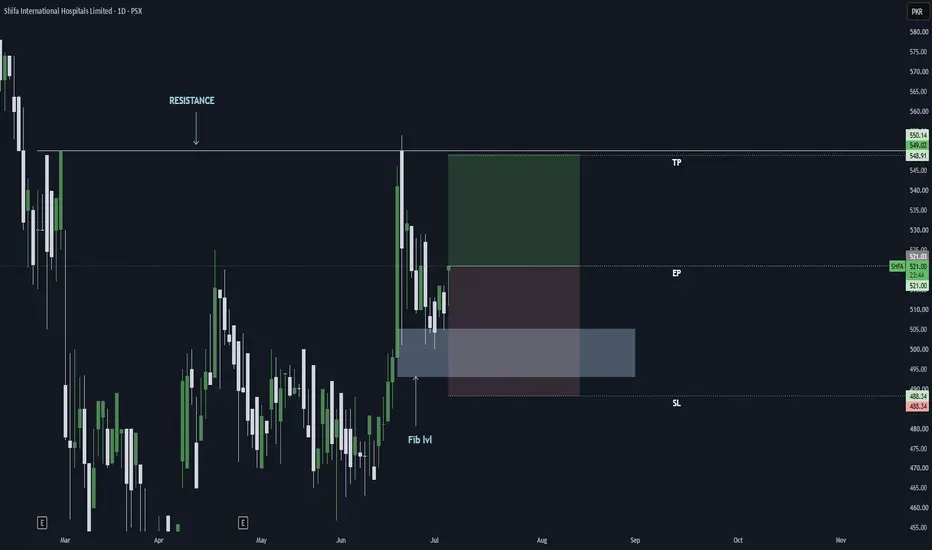
SHFA Technical Analysis (Daily + Weekly) / PSX The weekly timeframe is showing a Double Top pattern accompanied by Bearish RSI Divergence, indicating that bullish momentum is weakening. While this does not guarantee a reversal, it is an early warning that buyers should remain cautious and wait for price confirmation.
On the daily timeframe, SHFA has recently printed a Higher High (HH) and is now pulling back into the 489–500 demand/support zone, where a potential Higher Low (HL) could form. As long as this support zone remains intact, the overall bullish market structure is still valid.
📈 Bullish Scenario
The 489–500 support zone is the key area to watch.
Aggressive traders can consider buying at the current price while the stock is trading within the demand zone.
Conservative traders should wait for a bullish confirmation candle (such as a bullish engulfing, strong bullish rejection, or breakout candle) before entering a position.
Target 1: 574.76
Target 2: 600.52
📉 Bearish Scenario
The weekly Double Top and Bearish Divergence remain a risk. If the 489 support is broken with strong selling pressure and a daily close below this zone, the bullish setup will be invalidated, opening the door for a move toward 453.58.
🎯 Trading Plan
✅ Buy Zone: 489–500
✅ Entry Option 1: Buy at the current market price (Aggressive Entry).
✅ Entry Option 2: Wait for a bullish confirmation candle before buying (Conservative Entry).
🛑 Stop Loss: Below 453.58 (or according to your own risk management).
🎯 Targets: 574.76 → 600.52
"Trade what you see, not what you hope. The chart always rewards patience and discipline."
Disclaimer: This analysis is for educational purposes only and is not financial advice. Always use proper risk management before entering any trade. Long