Long
Long
National Refinery Limited Daily Patience Pays (July 2026)
**NRL Daily Outlook — Patience Pays**
**Symbol:** National Refinery Limited — PSX
**Timeframe:** Daily
**Chart Date:** July 04, 2026
National Refinery Limited is currently trading around an important higher-timeframe area. Price is sitting near the **monthly FVG**, and the market has also marked **equal-low liquidity** around this zone. This makes the current area very important, but I am not interested in rushing into the trade too early.
My main plan is to wait for price to pull back deeper first. The clean opportunity can come if the market moves down, takes liquidity below the current range, and then reacts from the lower demand / discount area. That area can become a better place to look for a bullish setup, especially if the market forms a proper bullish dealing range after sweeping liquidity.
The idea is simple:
price may first come down to collect liquidity, then if it shows bullish displacement and creates a clean dealing range, the next upside target can be the previous major high / buy-side liquidity area.
I like this setup because the upside potential is attractive, but the entry must be clean. Buying in the middle of the range is risky. I would rather wait for price to come into a better area, form confirmation, and then look for a possible long trade.
For me, the confirmation will be:
1. Price pulls back into the lower zone
2. Sell-side liquidity is taken
3. Bullish reaction appears
4. A bullish dealing range forms on the daily timeframe
5. Price starts holding above the FVG / reaction area
The main lesson here is simple: **patience pays.**
The best trade is not always the trade that is available right now. Sometimes the strongest setup comes after waiting for price to reach the right area first.
If the market gives the pullback and confirms bullish order flow, then I will look for a possible move toward the marked upside target. If price moves directly without giving confirmation, I will avoid chasing.
Risk is always involved, so confirmation is more important than prediction.
 Long
Long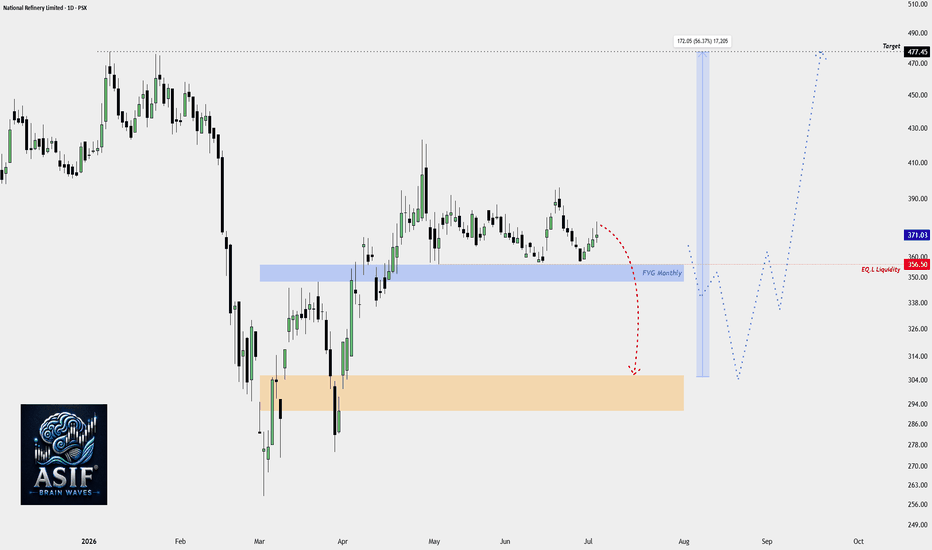
Trade Idea: LOADS Daily Outlook — Waiting Below (july 2026)**Trade Idea: LOADS Daily Outlook — Waiting Below Monthly Low**
**Symbol:** Loads Ltd. — PSX
**Timeframe:** Daily
**Chart Date:** July 04, 2026
Loads Ltd. has shown a strong recovery from the April low and price is now moving upward with a clear bullish reaction. The market has already created a decent upside leg, but I am not interested in chasing price at the current level.
My main interest is **below the previous month’s low**. I want to see price pull back, take liquidity below that low, and then form a **bullish dealing range on the daily timeframe**. For me, the clean setup will only start after the market shows a proper liquidity sweep and then gives a strong bullish reaction.
The idea is simple:
price may first move down to collect sell-side liquidity below the monthly low, then if it forms a bullish dealing range with displacement, I will look for a possible long setup from that area.
The upside target will be the marked **buy-side liquidity** above the current range. That is where resting liquidity is visible, and if the bullish dealing range confirms, price can later expand toward that area.
I do not want to buy in the middle of the move. I will wait for:
1. Price to move below the monthly low
2. Sell-side liquidity sweep
3. Bullish displacement on daily timeframe
4. Bullish dealing range / FVG formation
5. Entry only after proper confirmation
If price moves directly toward buy-side liquidity without giving the pullback, then I will avoid chasing. Patience is important here because the best opportunity may come only after liquidity is taken below the monthly low.
Risk is always involved, so confirmation is more important than prediction.
Pakistan State Oil Co. Ltd 2025 High Sweep (July 04, 2026)**Trade Idea Title:**
**PSO Monthly Outlook: 2025 High Sweep Followed by Possible Deep Pullback**
**Symbol / Market:** Pakistan State Oil Co. Ltd. — PSX
**Timeframe:** Monthly
**Chart Date:** July 04, 2026
After observing the monthly chart of **Pakistan State Oil Co. Ltd.**, the market has swept the **2025 high** and failed to continue higher. Instead of running upward, price reacted aggressively to the downside and created a clear bearish displacement. This tells me that the external buy-side liquidity above the major high has already been taken.
Now my main expectation is a deeper pullback toward the **2025 low area**. The move down looks strong because the market did not stay in a clean consolidation after the sweep. It quickly rejected from the high and formed a bearish structure, which supports the reversal/pullback idea.
A **yearly bullish FVG** is sitting below the current swing low. This area can become an important higher-timeframe support zone later, and from there price may push higher again. But because the market has already grabbed major external liquidity, I am not expecting a clean upside expansion inside the same yearly candle. A stronger bullish move may take time and could develop in the next one or two yearly candles.
When a market sweeps a major high, usually three scenarios can happen:
**1. Running highs**
Price continues higher after the sweep. In this case, that did not happen.
**2. Consolidation**
Price stays sideways after taking liquidity. This also looks less likely because price dropped quickly with bearish pressure.
**3. Reversal / deep pullback**
Price rejects the major high and starts moving toward downside liquidity. This is the scenario I am currently expecting.
My view is simple: **PSO may continue lower first, targeting the 2025 low area, then later react from the yearly bullish FVG and create a bigger upside move in the future.**
This is a higher-timeframe idea, so patience is important. I will wait for proper confirmation before taking any trade. Risk is always involved.
 Short
Short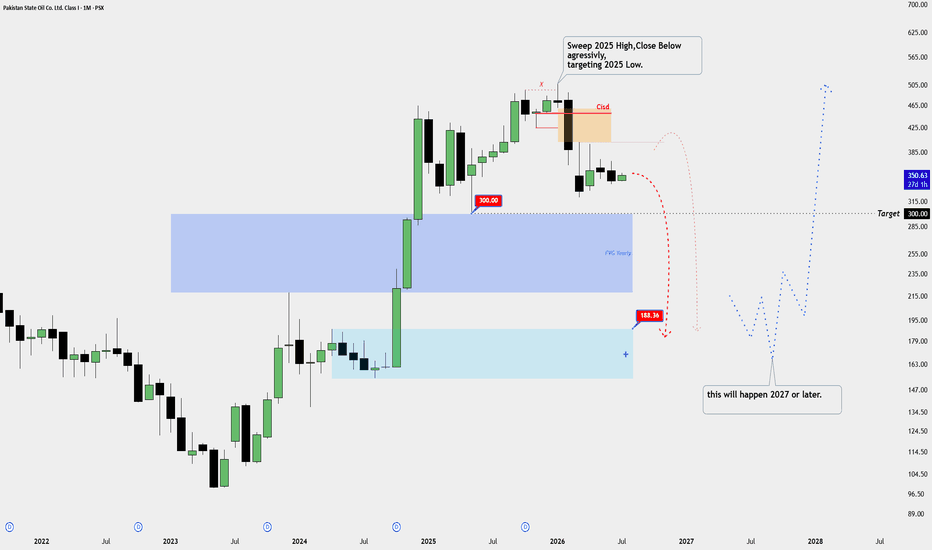
 Long
Long
 Long
Long
 Long
Long
 Long
Long
 Long
Long
Short 
 Long
Long
 Long
Long
 Long
Long
 Long
Long
 Long
Long