Microsoft and Google Are Winning. Why Did Only Stock One Rally?Two tech giants, two very different reactions. For a reason.
Microsoft NASDAQ:MSFT and Alphabet NASDAQ:GOOGL reported earnings Wednesday evening, giving Wall Street a fresh look at how the world's biggest technology companies are turning artificial intelligence into revenue.
Both had impressi
Where the world does markets
Join 100 million traders and investors taking the future into their own hands.
Get started for free$0 forever, no credit card needed

Supercharged
Supercharts

Nasdaq: Bearish Structure Favours Further DownsideThe Nasdaq has undergone a significant structural shift following its rejection from the recent highs. The subsequent sell-off broke through several important support areas, leaving the index trading below levels that previously attracted buyers.
The four-hour chart now reflects persistent selling
Gold Lands on the Monthly Low (4019) - Bounce or Breakdown?Gold has fallen about 180 points from 4199 this week. It broke the H4 head & shoulders neckline (4081) and today sliced through the 4044-4050 support. Price is now sitting on a major level:
4019 - the monthly low (Aug 26)
4018 - invalidation of the H4 AB=CD buy zone
4021 - the bottom of the H1 swin
FTSE100 UK inflation is the main focus todayUK inflation is the main focus for markets today. Higher-than-expected inflation increases the risk that the Bank of England will keep interest rates elevated for longer. This could put pressure on UK shares, particularly property companies and other interest-rate-sensitive sectors.
Comments from B
USD/JPY consolidation may be nearing its endUSD/JPY has been consolidating for some time, remaining below ¥159. However, Japan's consumer price index (CPI) report on 23 October and the Bank of Japan's interest-rate decision on 30 October could bring the sideways trading phase to an end.
Japan's headline and core CPI are both expected to rise
Is the Nasdaq 100 Heading Toward 29,294?Fundamental analysis of the Nasdaq 100
The Nasdaq Composite ended Tuesday, October 20, slightly lower, pressured by declines in major technology stocks, including Apple and Meta. Meanwhile, a pullback in oil prices after an earlier rise helped support broader US markets as investors assessed corpo
Anthropic Lost $80 Billion. Is the AI Boom in the Room with Us?Well... it kinda is.
Anthropic is preparing for one of the most anticipated stock market debuts in years, and investors are finally getting a closer look at the financial machinery behind its rapidly growing AI business.
The numbers are remarkable, although perhaps not entirely for the reasons y
Strategy (MSTR) to $200 and Bitcoin (BTCUSD) to $100k?!Strategy is poised to absolutely explode.
Exposed short positions charged for a squeeze
Market Makers Dealer Gamma will accelerate the short squeeze
SpaceX Epic Earnings - pushing BTC > $83k, MSTR > $145, SPCX > $155
Massive inflows from blackrock to Bitcoin - 10/19 saw over $600M in inf
Gold Refuses to Break — But Can the $4,100 Base Survive 5% YieldGold TVC:GOLD is doing something it shouldn't be doing. With the 10-year Treasury yield at 5.10%, the dollar above 101, and the Fed having just hiked for the first time since 2023, spot gold should be crumbling. Instead, it's holding $4,100 — and that resilience is the real story.
📊 Why This Ma
CoreWeave's Default Risk Is Soaring. Should AI Traders Worry?The AI boom has a debt problem.
CoreWeave NASDAQ:CRWV has become one of the biggest beneficiaries of the artificial intelligence boom. Its customers want enormous amounts of computing power , its revenue is growing rapidly and its contracts stretch years into the future.
Yet Wall Street is sud
See all editors' picks ideas
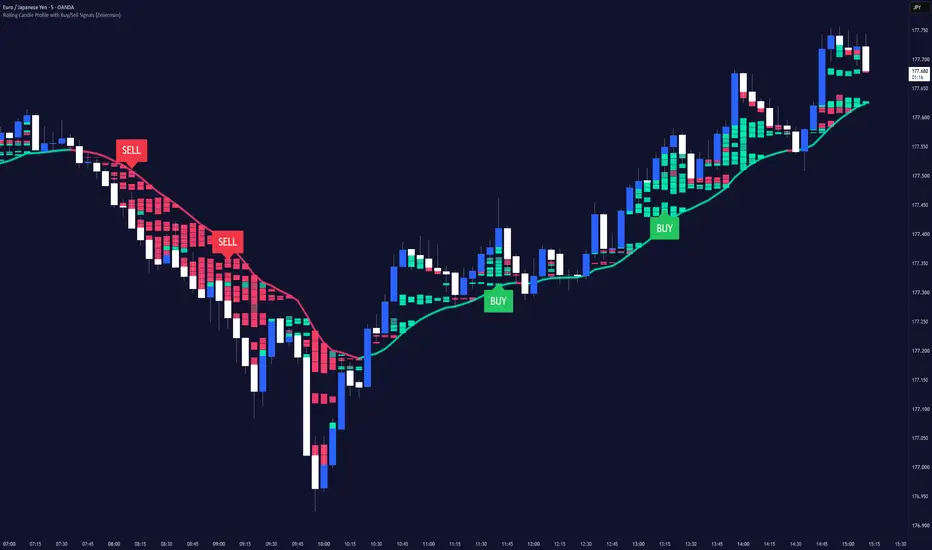
Rolling Candle Profile with Buy/Sell Signals (Zeiierman)█ Overview
Rolling Candle Profile with Buy/Sell Signals (Zeiierman) is a dynamic price-pressure indicator that visualizes buying and selling dominance, directional pressure concentrations, and weak-pressure regions directly on the chart.
The indicator constructs a 12-layer Rolling Pressure Prof
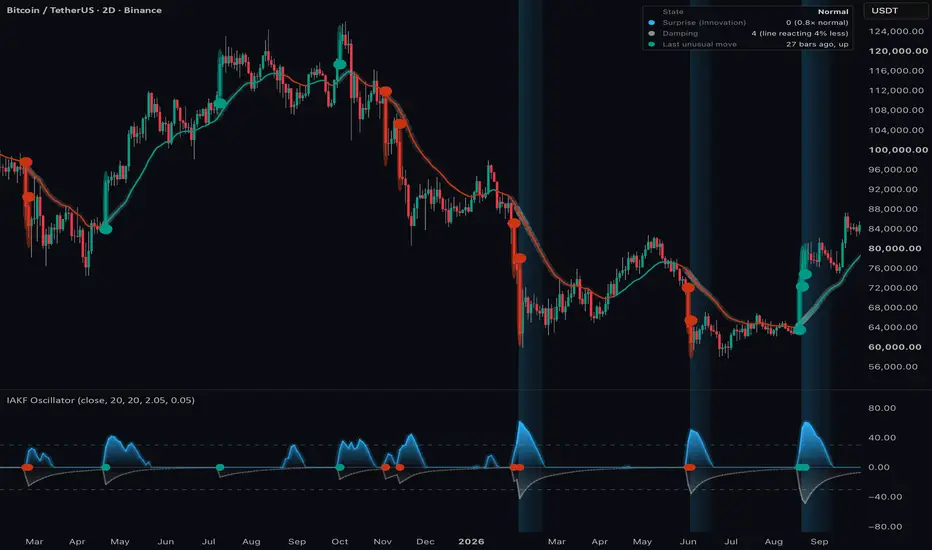
Innovation Adaptive Kalman Filter Oscillator█ OVERVIEW
The Innovation Adaptive Kalman Filter (IAKF) is a modern implementation of the Kalman filter that uses its own prediction errors to detect abnormal measurements and adapt its measurement-noise estimate.
This indicator is an oscillator that adapts recent research in GPS and inertial nav
Market Matrix (Zeiierman)█ Overview
Market Matrix (Zeiierman) is a multi-timeframe market analysis dashboard that brings together price structure, trend, momentum, and market strength into six compact indicator panels.
Instead of switching between multiple indicators and timeframes, Market Matrix displays higher-timefr
RedK Indicator Amplifier (RedK i-Amp)🟩 What is RedK i-Amp?
-------------------------------
RedK i-Amp is not an indicator in itself - it's a "wrapper" utility that "amplifies" another "source" indicator by improving its visual and alerting capabilities.
RedK i-Amp hooks to another indicator's plot and enables the addition of the fol
TASC 2026.10 A Low-Risk ETF-Trading Strategy█ OVERVIEW
This script implements concepts from a short-term ETF investment strategy outlined by Markos Katsanos in the article "Selecting Strong ETFs While Avoiding Sharp Overbought Reversals" from the October 2026 edition of TASC Traders' Tips . The strategy analyzes Katsanos' custom relative s
Buyers & Sellers Profile + Dynamic S/R (Zeiierman)█ Overview
Buyers & Sellers Profile + Dynamic S/R (Zeiierman) is a volume-profile and market-structure indicator designed to combine a large rolling Buyers/Sellers Volume Profile with dynamically generated support and resistance levels.
Instead of treating the volume profile and swing structure
Vol-Control Fund PositioningThe investors who sell because nothing happened
In 2017 the American stock market was so calm that a whole class of institutional portfolios held more equities than their own capital, simply because the rules they follow told them to. Reconstructed with the model behind this indicator, their estim
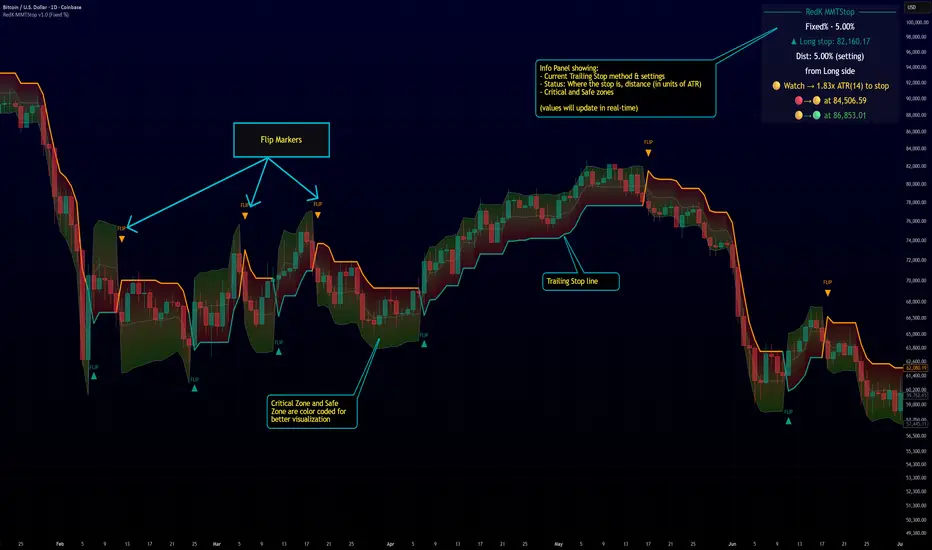
RedK Multi-Modal TrailingStop (RedK MMTStop)█ RedK MMTStop - Release Notes
Introduction & background
RedK MMTStop is a Multi-Modal Trailing Stop indicator - Let's quickly explore the "trailing stop" concept first as a refresher - then explain what a multi-modal trailing stop indicator does.
A "Trailing Stop" is what helps traders avoi
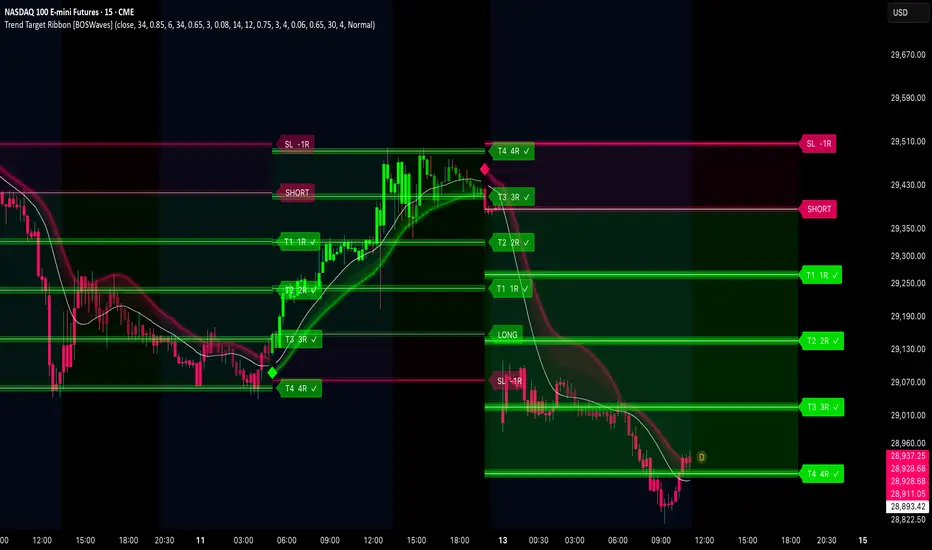
Trend Target Ribbon [BOSWaves]Trend Target Ribbon - ALMA Conviction Trend Detection with Integrated Structure-Based Position Planning and R-Multiple Target Tracking
Overview
Trend Target Ribbon is an ALMA-based trend identification system that combines slope-normalized momentum confirmation with standard deviation band
Wyckoff [theUltimator5]This indicator was designed to be a comprehensive, intuitive, overly engineered algorithm that plots Wyckoff accumulation and distribution patterns on the chart as they arise. It shows the current status of the regime on a side panel, while also overlaying the accumulation or distribution schematic
See all indicators and strategies
Community trends
Microsoft and Google Are Winning. Why Did Only Stock One Rally?Two tech giants, two very different reactions. For a reason.
Microsoft NASDAQ:MSFT and Alphabet NASDAQ:GOOGL reported earnings Wednesday evening, giving Wall Street a fresh look at how the world's biggest technology companies are turning artificial intelligence into revenue.
Both had impressi
NIO Bottoming Out?The chart shows repeated failures to sustain recoveries since the 2021 peak.
Possible Floor at $3.22 , the Skull & Bones Order number.
MACD Positive Divergence: 2025-2026
Bottoming Pattern Possible, SIMILAR to RKLB in Apr. 2024
Targets: potential gravity to the Fibonacci ratios you'd study in t
BA: Bearish Earnings Momentum and Huge Ascending-Wedge!Hello Community,
welcome to my new analysis of BA on the weekly timeframe perspective. In the recent times I have spotted interesting setups within the stock market which have the potential to lead to profitable trading opportunities, like with BA on the short side. Therefore, I have spotted all t
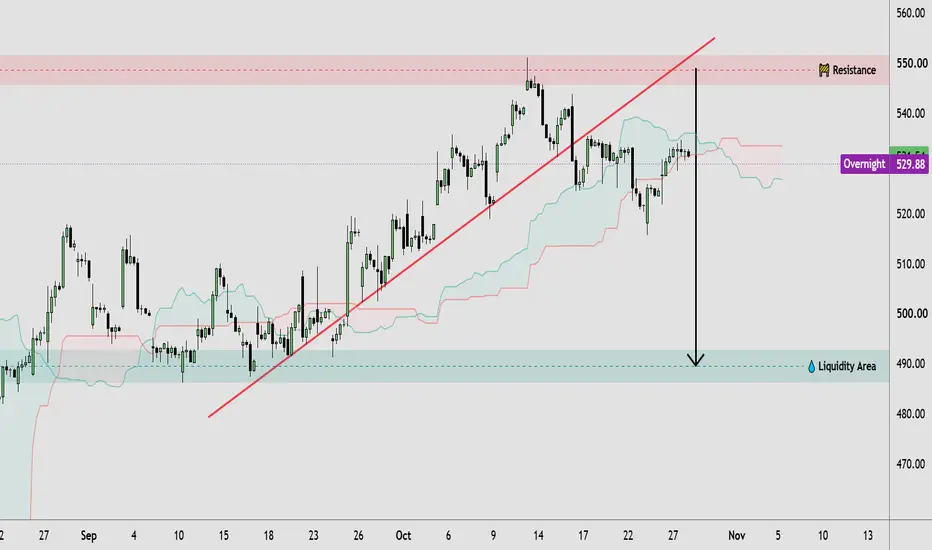
MSFT: Trendline Breakdown Risk and $490 Liquidity Zone🔹 MSFT price action shows a strong recovery from the September lows, forming a series of higher highs and higher lows along an ascending trendline. However, the recent rejection near the 548–550 resistance zone suggests that bullish momentum may be facing selling pressure. Price is currently consoli
SANDISK CORP (SNDK:US)SANDISK CORP
(SNDK:US)
Although the stock has a high beta and high volatility, fundamentally it benefits from the supercycle in NAND memory for AI data centers (where data center revenue has grown by over 200%). With a P/E ratio below the market average and solid free cash flow generation, it rema
GOOGLE Bear Cycle initiates new crash to $275.Google (GOOG) has been trading within a Channel Up since its 2014 restructuring under the parent company Alphabet Inc. Within this 11-year span, the 1W MA100 (green trend-line) has offered systemically the most frequent buy opportunities. On only two occasions did the price touch lower the 1M MA50 (
Oracle - This higher timeframe support is massive!🔮Oracle ( NYSE:ORCL ) is now sitting at major support:
🔎Analysis summary:
After just trading in a very narrow range for the past months, Oracle is finally showing some movement. On the higher timeframe though, Oracle is still retesting a major support area. Quite likely that Oracle will final
NVDAUSDT (Nvidia) 5X SHORT (PP: 150%) · High Probability BearishThis is a long-term bearish chart setup, it has been in the making a long time, since April 2026. The pattern is now fully complete. A double-top leads to a challenge of the main support level that holds the bullish market. Yesterday, a rejection is happening below 220, the main resistance short-ter
Buying the dip on $GOOGLBuying the dip on NASDAQ:GOOGL 📉
Still bullish on Google long term. AI spending is a concern, but the core business remains strong.
Adding to my position and thinking 5–10 years ahead.
Not trying to time the bottom. Just building my portfolio one step at a time.
If you're truly a long term inv
See all stocks ideas
Today
TILEInterface, Inc.
Actual
—
Estimate
0.62
USD
Today
BTSGBrightSpring Health Services, Inc.
Actual
—
Estimate
0.47
USD
Today
CVXChevron Corporation
Actual
—
Estimate
4.87
USD
Today
REGNRegeneron Pharmaceuticals, Inc.
Actual
—
Estimate
16.42
USD
Today
NVTnVent Electric plc
Actual
—
Estimate
1.40
USD
Today
XOMExxonMobil Holdings Corporation
Actual
—
Estimate
4.12
USD
Today
LYBLyondellBasell Industries NV
Actual
—
Estimate
2.57
USD
Today
OMFOneMain Holdings, Inc.
Actual
—
Estimate
1.56
USD
See more events
Community trends
ETHEREUM: Major Descending Triangle-Formation, Reversal Setup!Hello Community,
welcome to my new analysis of Ethereum from a 4-hour timeframe perspective. In my recent analysis, I detected important signs within ETHEREUM which will determine the upcoming directions profoundly. Therefore, I am considering all the underlying factors that will drive the upcomin
BITCOIN - Aggressive behavior of bulls in the 80000BINANCE:BTCUSDT.P during the Asian session is forming a local distribution toward support and testing the key liquidity zone. The bulls continue their aggressive play in the 80,000 zone.
Fundamentally, the market is waiting for a driver, but at the same time, within the counter-trend correctio
Btcusd Liquidity Analysis | Potential Reversal from key supportMarket Structure & Liquidity Analysis | Potential Reversal from Key Support
1. Market Overview
The current chart presents an important technical situation in which price is approaching a major support zone after an extended period of bearish market structure. The overall price action shows a seque
Underwhelming Bitcoin rally to $115 - 118k, October 2025SYMBOL: COINBASE:BTCUSD | DIRECTION: LONG NEAR TERM, SHORT THEREAFTER | TIMEFRAME: 12-Day
Published: October 2026
Yes, underwhelming. With all serenity, a 42% move in a raging bull market is background noise. Equivalent to the noise a mouse expels on its last breath having caught that unlucky
Bitcoin Breaks Out Ahead of the FOMC — Is a Bull Trap Coming?Bitcoin recovered from around $79,000 toward $81,000 ahead of one of the most important macro events of the week.
Markets largely expect the Federal Reserve to keep rates unchanged, meaning the bigger catalyst may be Kevin Warsh’s tone on a possible December rate hike.
Can Bitcoin survive a hawki
BTCUSDT (Bitcoin) 4X LONG with 355% Profits Potential—High riskRisk is much higher when entering at resistance. Normally, we recommend always entering at support, never when prices are high.
Why take the chance now? Why a 4X Bitcoin long when the market failed to hit 90K?
Good morning, I hope you are having a wonderful day.
Bitcoin is facing resistance after
#BTCUSDT #12h (Binance) Symmetrical triangle breakdown [SHORT]BTC (Bitcoin) lost 50MA again, let's try to re-short it on the retest, targeting 200EMA support.
⚡️⚡️ #BTC/USDT ⚡️⚡️
Exchanges: Binance Futures, Bitget Futures
Signal Type: Regular (SHORT)
Leverage: Isolated (18.0X)
Amount: 5.2%
Entry Targets:
1) 83159.6 - 100.0%
Take-Profit Targets:
1) 77851.8 -
BTCUSDT Long: Latest Bounce off Demand Suggests a Test of SupplyHello traders! Here’s my technical outlook based on the current BTCUSDT (4H) chart structure. BTCUSDT previously declined inside a descending channel and tested the Demand Zone near 79,300. Price then bounced along the Trend Line, showing signs of buyers stepping in.
Currently, BTCUSDT is trading b
bitcoin at the $79k crossroads will bulls ignite a rally to 85kBTCUSD is trading around $79,742, approaching a major demand zone near $79,000 after a sharp rejection from the $81,500 resistance area. This pullback could create a potential buying opportunity if buyers defend demand and selling pressure begins to weaken.
The key bullish scenario is a rebound from
BITCOIN 1D MA200 test around 74.5k possible based on this.Bitcoin (BTCUSD) has completed 3 straight red weeks, something it last did in May 2026. This is caused due to its inability to cross above its 1W MA100 (green trend-line) last month. This rejection is technically causing a pull-back, which may extend all the way to its 1D MA200 (red trend-line).
La
See all crypto ideas
XAUUSDHello Traders! 👋
What are your thoughts on Gold?
Gold continues to trade within a descending channel on the daily timeframe. The price has recently broken below the identified support zone and is currently retesting the broken area, which is expected to act as resistance.
Following the completion
SILVER (XAGUSD) – Bearish Continuation & Downside Target Setup📊 SILVER (XAGUSD) – Bearish Continuation & Downside Target Setup
🔍 Market Overview
Silver is maintaining a strong bearish structure on the 4-hour timeframe, with price trading around 53.99 after an extended decline from higher levels. The market continues to form lower highs and lower lows, whil
GOLD - Bear Market. A Correction Before the Drop IC:XAUUSD tests the area of interest at 4070 and comes under a wave of selling during the Asian session, maintaining the bearish trend. The fundamental and technical backdrop is not on the metal's side...
The dollar remains in a bullish trend, and oil remains strong. The fundamental backdrop i
XAU/USD - Rising Channel Rejection Confirms Bearish SetupSetup Overview:
XAU/USD on the 30-minute timeframe has faced a sharp rejection from the well-defined 4,070–4,082 resistance zone after testing the upper boundary of the rising channel. Sellers have regained control near the D-point rejection, and bearish pressure is building as price moves toward
THE KOG REPORT - FOMC THE KOG REPORT – FOMC
This is our view for FOMC, please do your own research and analysis to make an informed decision on the markets. It is not recommended you try to trade the event if you have less than 6 months trading experience and have a trusted risk strategy in place. The markets are extr
GOLD Price Update – Clean & Clear ExplanationGold is facing strong selling pressure after failing to sustain its bullish momentum near the 4,067–4,080 critical reversal zone. Price made a sharp upward move, but the rejection from this resistance area indicates that sellers are becoming more active and buyers are struggling to maintain control.
USOIL 30Min Engaged ( Bearish Reversal Detected )HANZO MARKET LIQUIDITY REPORT
USOIL
Timeframe: 30min (Volume Basis)
Scale: Higher Timeframe Context / Deep Volume analysis
━━━━━━━━━━━━━━━━━━━━━━
Market Observation
This analysis is focusing on structural behavior, liquidity zones, Volume analysis
and key areas of interest within the current range.
XAUUSD | Bearish Breakdown & Downside Continuation SetupXAUUSD | Bearish Breakdown & Downside Continuation Setup
### Fundamental View
Gold remains under selling pressure as markets reassess the Federal Reserve’s monetary-policy outlook. The Fed kept interest rates unchanged at 3.75%–4.00% at its October meeting, but persistent inflation and hawkish dis
GOLD (XAU/USD): Bearish Continuation Now Confirmed!Gold formed two distinct bearish patterns on an intraday time frame.
I see confirmed bearish flag formation alongside a double top pattern featuring a lower high.
Both the neckline of the double top and the support level of the flag have been violated
I anticipate that the market may decline furt
Gold XAUUSD 4H Analysis Key Support Liquidity & Bullish BreakoutGold XAUUSD 4H Analysis | Key Support, Liquidity & Bullish Breakout
Market Overview
Gold (XAUUSD) is showing an important reaction around the S1 Key Support / Demand Zone after an extended bearish move on the 4-hour timeframe. The chart highlights major supply zones, liquidity areas, local resista
See all futures ideas
EUR/USD Under PressureWelcome back, traders!
EUR/USD remains under selling pressure on the H4 chart, with a clear descending trendline defining the broader bearish structure. Price is testing a major support zone after another rejection from the upper resistance area.
The market is now at an important decision point.
EURUSD 4H: ICT Liquidity Sweep, BOS, MSS & Order BlockEURUSD 4H Analysis | ICT Smart Money Concepts, Liquidity Engineering & Market Structure
1. Higher-Timeframe Market Structure — Bearish Context
EURUSD is displaying a broader bearish structure, characterized by lower highs, lower lows, and repeated breaks of previous support levels. This indicates
GBP/USD | Old major sellside liquidity sweep awaits Cable!By analyzing the 4H chart of GBPUSD we can see that it has been on a bearish run for a while and it has swept away the sellside liquidity below 1.3299 level, and currently is being traded at around 1.3277 level.
I expect Cable to continue dropping towards the 1.3137 level, to sweep the sellside li
EURUSD Long: The Post-Decline Base Could Become a LaunchpadHello traders! Here’s my technical outlook based on the current EURUSD (1H) chart structure. EURUSD previously declined under the Trend Line and formed a range near the Demand Zone. Price then bounced from the 1.1120 Demand Zone, showing signs of buyers stepping in.
Currently, EURUSD is trading bel
USDJPY 30Min Engaged ( Bullish & Bearish Reversal Detected )HANZO MARKET LIQUIDITY REPORT
USOIL
Timeframe: 30min (Volume Basis)
Scale: Higher Timeframe Context / Deep Volume analysis
━━━━━━━━━━━━━━━━━━━━━━
Market Observation
This analysis is focusing on structural behavior, liquidity zones, Volume analysis
and key areas of interest within the current range.
The Descending Wedge Euro Is Approaching Its Moment of TruthHello traders! Here’s my technical outlook based on the current EURUSD (3H) chart structure. EURUSD previously started to decline under the Trend Line and formed a descending wedge near the Seller Zone. Price then tested the Buyer Zone and bounced, showing early signs of a bullish reversal.Currently
EURUSD Eyes a Rebound as Markets Await The ECB MeetingEURUSD Eyes a Rebound as Markets Await The ECB Meeting/b]
EURUSD fell below the structure zone indicating further decline. However from the left side we can see that both times created 2 false bearish breakouts.
It's very risky and likely it can create another false bearish breakout.
Yesterday, t
USDJPY: Buyers Target a Return to 159From intervention to consolidation
In mid-summer, USDJPY reached 163—a level not seen in decades and, considering the pair’s modern history, effectively an all-time high.
BoJ intervened forcefully, and the pair fell roughly 1,000 pips in just a few days. Price then recovered. When it returned to
GBP/USD Rejection From Descending TrendlineHello traders!
Today, I'm looking at a key setup developing in GBP/USD has formed a well-defined descending trendline on the 30-minute chart, with repeated rejections and lower highs confirming a clear bearish structure. The latest rebound failed near the marked resistance zone, showing that selle
See all forex ideas
Trade directly on Supercharts through our supported, fully-verified, and user-reviewed brokers.