• Products
  • Community
  • Markets
  • Brokers
  • More
Get started
  • Markets
  • /USA
  • /Stocks
  • /Ideas
NAUFF - The Golden Ratio Meets Major SupportNAUFF remains within its broader bullish structure, while the current correction is bringing price back toward an important technical support area.🎯 The zone is formed by the intersection of three major confluences: 1️⃣The 0.618 Fibonacci retracement, marked in orange and commonly known as the golden ratio. 2️⃣The psychological $1 round number, which may act as an important support level. 3️⃣The rising blue trendline, acting as long-term non-horizontal support. 📌The alignment of these three factors makes this area an important decision zone for the stock’s next directional move. As long as the intersection continues to hold, the broader bullish bias remains intact, and we will be watching for trend-following long setups.🐂 A confirmed bullish reaction from this support area could suggest that the current correction is approaching completion and that the next bullish impulse may be developing. However , price confirmation remains important. A sustained break below the confluence zone would weaken the current bullish scenario and require a reassessment of the structure. In brief, NAUFF is retesting a technically significant three-confluence support zone. If buyers continue defending the intersection, the area could provide the foundation for the next bullish impulse movement.📈 ⚠️Disclaimer: This analysis is provided for informational and educational purposes only. It does not constitute financial advice or a recommendation to buy or sell any security. Technical conditions can change, and no outcome is guaranteed. Always conduct your own research and manage risk appropriately. Good luck! All Strategies Are Good; If Managed Properly! ~Richard Nasr
OTC:NAUFFLong
by TheSignalyst
55
RSI Range Shift: The Lesson Nobody Taught YouHello Friends, welcome to RK_Chaarts, RSI Range Shift - The Lesson Nobody Taught You This post is for education only, not a buy or sell recommendation. Manage your risk. Be honest. When you first learned RSI, someone told you this - above 70 sell, below 30 buy. I followed this rule for a long time and kept losing. Selling strong stocks too early, buying weak stocks too early. Then I noticed something on my charts that changed how I use RSI completely. Let me break it down topic by topic using this Apple daily chart as an example. Topic 1 : What is RSI Range Shift ? RSI does not move randomly between 0 and 100. It lives in different zones depending on the trend. In an uptrend, RSI stays roughly between 35 and 80. In a downtrend, RSI shifts down and stays roughly between 20 and 65. Same indicator, same settings, but completely different behaviour. The zone where RSI is living tells you the real trend. Topic 2 : RSI Behaviour in an Uptrend Look at the green boxes on the Apple chart. In every uptrend, RSI never really went below 35-40. Every dip in price, RSI came near 40 and bounced back up. And it kept touching 70-80 again and again while the stock kept climbing. Lesson here - a stock sitting at RSI 70-80 for weeks is not weak, it is strong. Strongest trends stay overbought the longest. If you sold every time RSI crossed 70, you missed the entire move. Topic 3 : RSI Behaviour in a Downtrend Now look at the red boxes. Complete opposite story. RSI got stuck between 20 and 65. Every bounce in price, RSI went up to 60-65 and died there. It could not cross 70. And here is the painful part - when RSI hit 30, it was not a bottom. Price kept falling. Oversold can stay oversold in a downtrend. Buying just because RSI touched 30 is how people catch falling knives. Topic 4 : Where to Buy and Where to Sell Once you know which zone RSI is living in, entries become simple. In an uptrend - when RSI comes down to the 40 area and starts turning up, that is your dip buying zone. Not RSI 30. In a proper uptrend RSI may never even reach 30. In a downtrend - when RSI bounces to 60-65 and starts turning down, that is where rallies die. That is a zone to book profits or sell, not to chase a breakout. Simple line to remember - buy dips in strength, sell rallies in weakness. Topic 5 : The Early Warning Signal This is the most powerful part. When RSI breaks its range, the trend character is changing. If a stock was holding RSI 40 on every dip for months and suddenly RSI cracks below 35 and stays there, be alert. The uptrend may be ending. Many times this warning comes before the price structure breaks. Check the chart yourself - every green to red transition started with RSI losing its support zone first. Topic 6 : How to Apply This From Tomorrow Step 1 - Open the daily chart of any stock you trade. Step 2 - Zoom out and see where RSI took support and resistance in the last few months. Step 3 - Decide the zone. Holding 40 and touching 70-80 means bull range. Stuck below 65 and hitting 25-30 means bear range. Step 4 - Trade the boundaries of that zone, not the textbook 30-70 lines. Step 5 - The day RSI breaks its zone, respect the warning. Final Words Stop asking "is RSI overbought or oversold". Start asking "which zone is RSI living in". That one question tells you the trend, where to buy dips, where to sell rallies, and warns you before the trend flips. Try it on your own charts. You will see the same pattern everywhere. I am not Sebi registered analyst. My studies are for educational purpose only. Please Consult your financial advisor before trading or investing. I am not responsible for any kinds of your profits and your losses. Most investors treat trading as a hobby because they have a full-time job doing something else. However, If you treat trading like a business, it will pay you like a business. If you treat like a hobby, hobbies don't pay, they cost you...! Hope this post is helpful to community Thanks RK💕 Disclaimer and Risk Warning. The analysis and discussion provided on in.tradingview.com is intended for educational purposes only and should not be relied upon for trading decisions. RK_Chaarts is not an investment adviser and the information provided here should not be taken as professional investment advice. Before buying or selling any investments, securities, or precious metals, it is recommended that you conduct your own due diligence. RK_Chaarts does not share in your profits and will not take responsibility for any losses you may incur. So Please Consult your financial advisor before trading or investing.
NASDAQ:AAPLEducation
by RK_Chaarts
44
Microsoft - Starting the $2 trillion bullrun!👑Microsoft ( NASDAQ:MSFT ) is creating the bottom now: 🔎Analysis summary: For over five years, Microsoft has been creating a long term bullish consolidation. But right now, Microsoft is also retesting an incredibly strong confluence of support. Since we already saw bullish confirmation, Microsoft is now heading for a $2 trillion move higher. 📝Levels to watch: $400 Keep your #LONGTERMVISION🙏 — Phil (@TheTraderPhil)
NASDAQ:MSFTLong
04:56
by TheTraderPhil
33
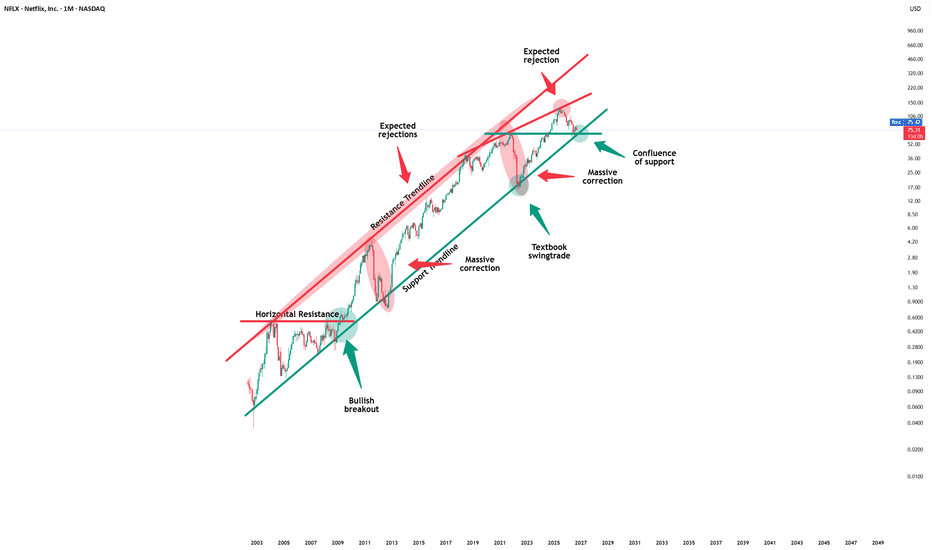
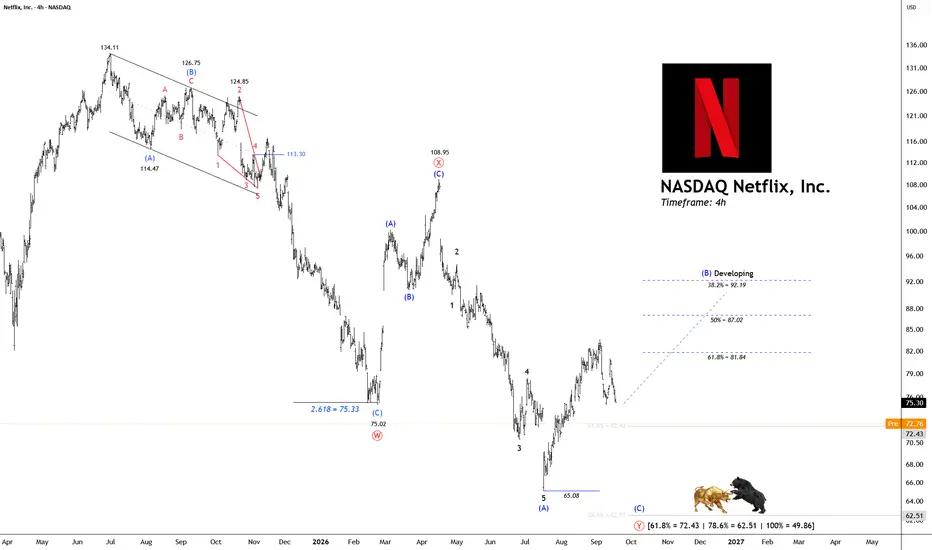
Netflix (NFLX) - Buy Signal AlertNetflix (NFLX) is currently pulling back and in its 1:1 measured move. Entry Zone: $50.31 Stop Loss: $36.29 🎯 Targets: Half Profit: $72.99 Main Target: $129.16 Raise your stop-loss to the entry price once the price reaches $72.99.
NASDAQ:NFLXLong
by ImpulseDon
11
LUMN at Key SupportWith the candles I circled in blue, I think LUMN is currently re-testing a key level that dates back to August 2002. This was the first major test of an area that originally acted as 2-week resistance around January 1998. Later, price tested the $6.54 level, which developed after that initial test. In 2020, LUMN revisited the $6.54 area, and then in 2022, it tested the midpoint between the two key zones—$6.54 (the second test) and $6.19 (the first test). During that period, the area transitioned from support to resistance, further confirming its significance. Years later, these two zones continue to prove their importance. The $6.54 and $6.19 levels have repeatedly acted as major support and resistance. Most recently, price bounced directly from the $6.19 zone, once again reinforcing it as a key level to watch. Also, I think theres a valid dragon at play that failed its break outs.
NYSE:LUMN
by Zed_Yeu_Em
11
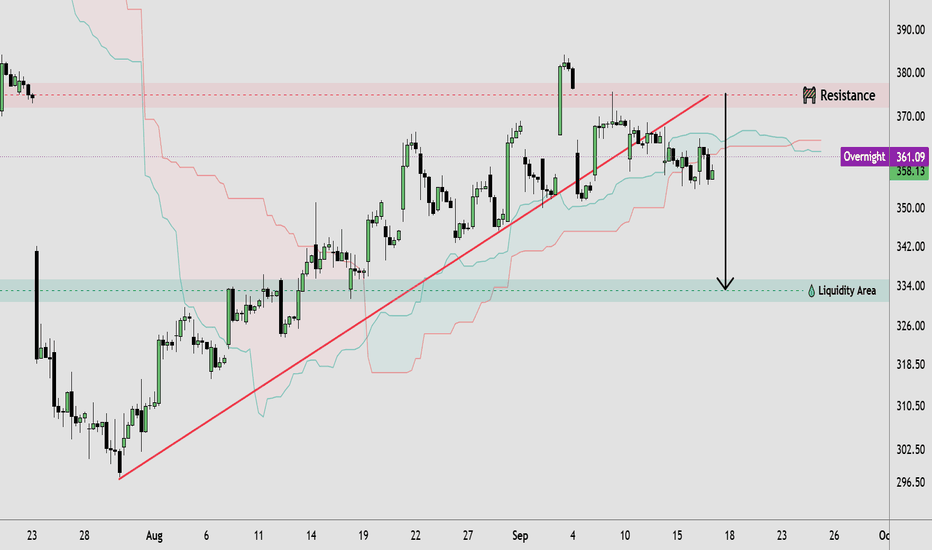
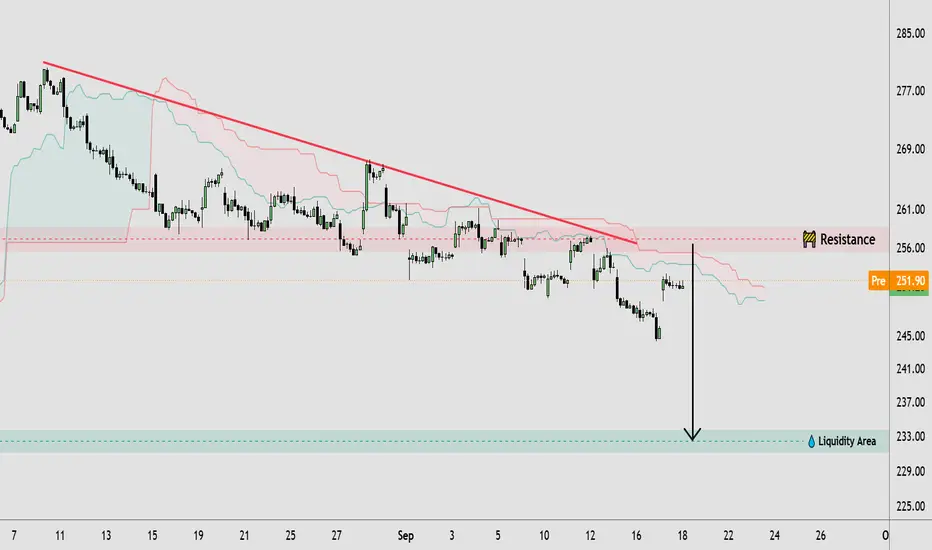
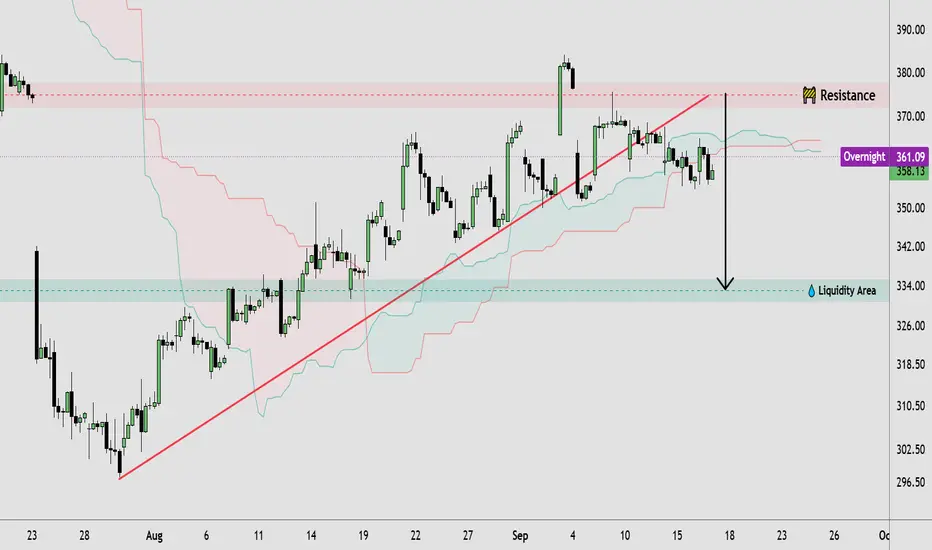
TSLA Bearish Rejection from Fair Value Gap (FVG) Tesla (TSLA) is showing bearish momentum after rejecting the Fair Value Gap (FVG) and failing to reclaim the overhead supply zone. Price remains below the Ichimoku resistance, suggesting sellers are still in control. If the current bearish structure holds, a continuation toward the major support zone around **$372.70** becomes the primary target. A decisive break below the recent swing low would strengthen the downside outlook, while a sustained move above the FVG and resistance area would invalidate the bearish scenario. 🎯 **Target:** **$372.70** ❌ **Invalidation:** Sustained breakout above the FVG/resistance zone (around **$410–$420**) ⚠️ **Trade idea only — wait for confirmation and manage risk properly.**
NASDAQ:TSLAShort
by Alpha_Trade_Scope
Updated
2222
ONDS is ready to popONDS has been heavily shorted, but the long-term story is only improving. In various interviews, I've watched the CEO deliver a compelling story for the future and it seemed ONDS has a chance to become a drone empire. I was so convinced that I decided to invest my 401K and ROTH accounts in ONDS. On the technical front, I see we may be ready to start a bull run. - 61.80% retracement from all time lows to recent highs - RSI is oversold - SMI is ready to move up after a failed attempt in early July - Descending trendline will soon be tested and broken - The last three candles are identical to a morning (doji) star pattern Being patient and sitting through short-term volatility is the key to success. ONDS issued long-dated common stock warrants with an exercise price of $28.00 per share as part of a major $1 billion institutional financing package that closed in January 2026. This will be a potential 10x banger in the years to come, so $28 is not the upper ceiling. ONDS is ready to pop as early as Tuesday or Wednesday (July 21-22).
NASDAQ:ONDSLong
by trader315269
22
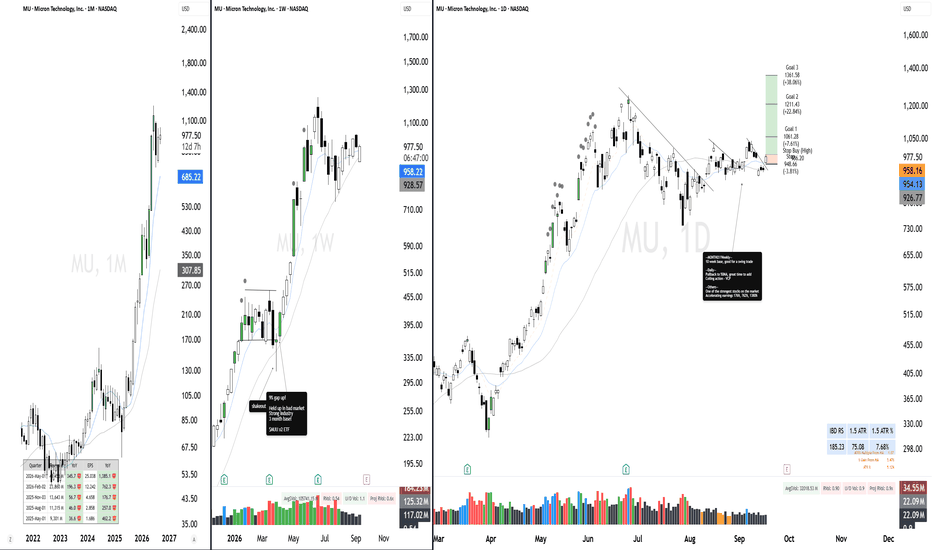
$MU: Why the Odds Favor a Break Below $800 NASDAQ:MU : Why the Odds Favor a Break Below $800 NASDAQ:MU NASDAQ:NVDA NASDAQ:AMD NASDAQ:SOXX NASDAQ:SMH NASDAQ:QQQ AMEX:SPY
NASDAQ:MUShort
02:30
by Swing_Trader_Saan
11
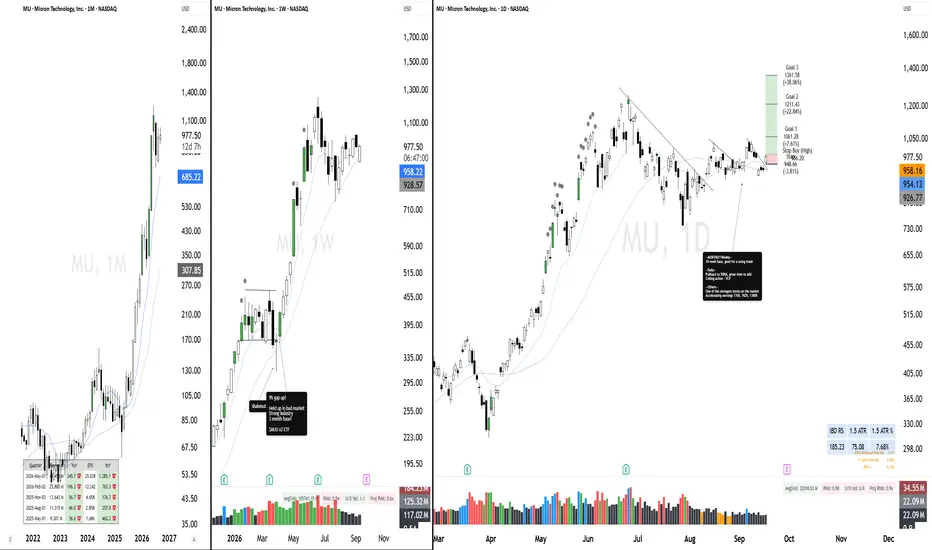
$MU: I'm In. Waiting for More AccumulationAs I mentioned in one of my Ideas last week: "I'm still extremely bullish on the long-term outlook for the memory industry, but I don't think now is the right time to buy." Since its June high, NASDAQ:MU has corrected nearly 35% , while SK hynix has fallen more than 40% from its peak. I don't think the selling is over yet—let's keep our expectations realistic. What the chart is telling us: A Head & Shoulders pattern has been confirmed. A fresh supply zone has formed. Buyers stepped in on July 17, but failed to reclaim higher prices. Based on the current structure, I believe NASDAQ:MU is likely to continue lower toward the $680–640 support zone , where I expect a higher-probability accumulation opportunity. Last week's trading plan & current update: ✅ Bought 20% of my intended position between $870. ⏳ Watching price action around $980 before deciding whether to take partial profits or add to my position. (I lowered my original target from $1,040–1,060.) ⏳ If NASDAQ:MU continues to correct, I'll begin accumulating more aggressively in the $680–640 zone. Long-term target: $1,500+ That view hasn't changed. An industry with order books stretching well into the coming years isn't going to lose its long-term story overnight. The fundamentals of the memory sector remain intact. AI-driven demand, DRAM, and HBM are still powerful long-term growth drivers. I'm staying bullish on AI and memory. For now, I'm simply waiting for the market to offer a better opportunity. If you also want to plan your U.S. stock trades over the weekend—without constantly switching between apps for Gold, Crypto, and Stocks—you should check out rToken. Unlike synthetic assets that rely on oracles or on-chain liquidity pools, rToken routes orders through broker channels directly to the real NASDAQ and NYSE order books, allowing 24/7 trading while maintaining real U.S. equity liquidity with the efficiency of the crypto market. This is one of the most interesting bridges between traditional equities and crypto trading that I've seen recently.
NASDAQ:MULong
by GDJ_Jinn
11
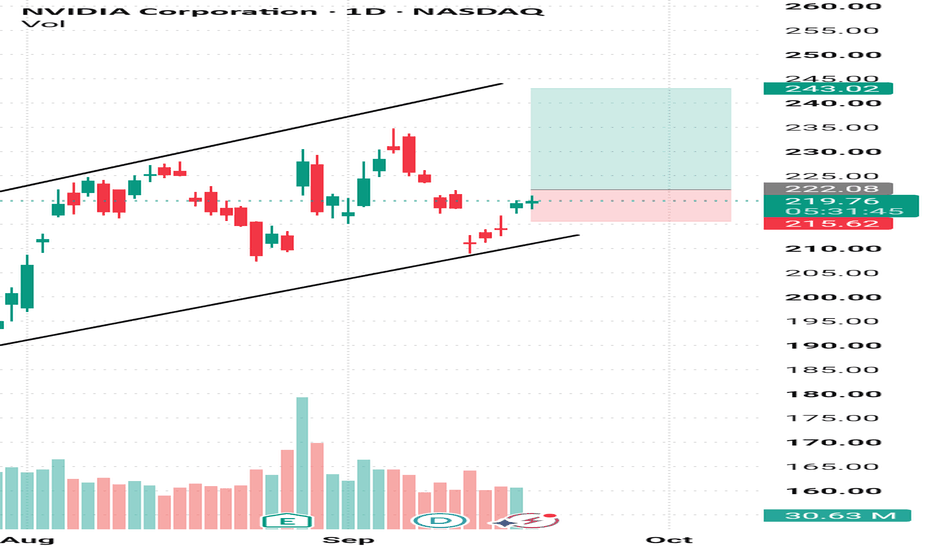
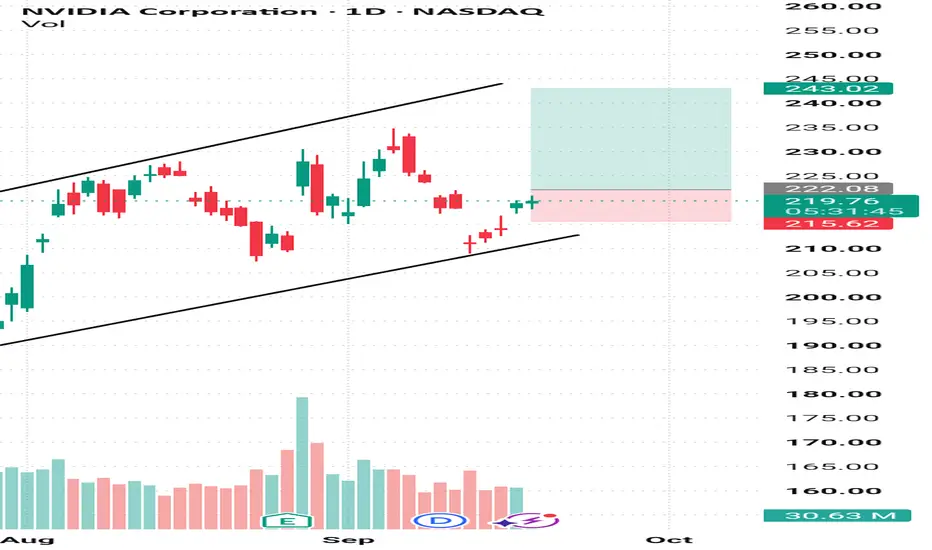
NVIDIA Short-Term Downtrend: Another 3% Drop Expected, TargetingHi, NVIDIA has entered a short-term downtrend, which I believe may continue for a while. In the short term, I expect the stock to fall at least another 3%, with a target price of $199.50.
NASDAQ:NVDAShort
by MadWhale
ExxonMobil Could Be AcceleratingExxonMobil pulled back after rallying in the first quarter, and some traders may think it’s accelerating again. The first pattern on today’s chart is the series of lower highs since late March. The energy giant has returned to that falling trendline as oil rises. Could it break out? Second, prices bounced earlier this month at the rising 200-day simple moving average. That may reflect a bullish long-term trend. Next, MACD is rising and the 8-day exponential moving average (EMA) has crossed above the 21-day EMA. That may suggest short-term momentum is turning bullish. Finally, XOM is an active underlier in the options market. (Its average daily volume of 60,200 contracts ranks first among energy stocks in the S&P 500, according to TradeStation data.) That could help traders take positions with calls and puts. TradeStation has, for decades, advanced the trading industry, providing access to stocks, options and futures. If you're born to trade, we could be for you. See our Overview for more. Past performance, whether actual or indicated by historical tests of strategies, is no guarantee of future performance or success. There is a possibility that you may sustain a loss equal to or greater than your entire investment regardless of which asset class you trade (equities, options or futures); therefore, you should not invest or risk money that you cannot afford to lose. Online trading is not suitable for all investors. View the document titled Characteristics and Risks of Standardized Options at www.TradeStation.com . Before trading any asset class, customers must read the relevant risk disclosure statements on www.TradeStation.com . System access and trade placement and execution may be delayed or fail due to market volatility and volume, quote delays, system and software errors, Internet traffic, outages and other factors. Securities and futures trading is offered to self-directed customers by TradeStation Securities, Inc., a broker-dealer registered with the Securities and Exchange Commission and a futures commission merchant licensed with the Commodity Futures Trading Commission). TradeStation Securities is a member of the Financial Industry Regulatory Authority, the National Futures Association, and a number of exchanges. TradeStation Securities, Inc. and TradeStation Technologies, Inc. are each wholly owned subsidiaries of TradeStation Group, Inc., both operating, and providing products and services, under the TradeStation brand and trademark. When applying for, or purchasing, accounts, subscriptions, products and services, it is important that you know which company you will be dealing with. Visit www.TradeStation.com for further important information explaining what this means.
X
by TradeStation
Walmart May Be Trending LowerWalmart had a big run between 2022 and early 2026, but now it may be going the other way. The first pattern on today’s chart is the pair of peaks in February and May. That double top may signal a reversal of the preceding uptrend. Second, the retail giant gapped lower after announcing results on May 21. It stayed below levels from the session before making another push to the downside. Prices then recovered. But is that bounce a potential bearish flag? Third, the 8-day exponential moving average (EMA) is below the 21-day EMA. That may reflect a short-term downtrend. Fourth, Wilder’s Relative Strength Index (RSI) has stayed under 50 after hitting oversold conditions. That may also be consistent with short-term weakness. Finally, WMT is under its 50- and 200-day simple moving averages. That may reflect a longer-term reversal. TradeStation has, for decades, advanced the trading industry, providing access to stocks, options and futures. If you're born to trade, we could be for you. Learn more here about TradingView’s Broker of the Year! Past performance, whether actual or indicated by historical tests of strategies, is no guarantee of future performance or success. There is a possibility that you may sustain a loss equal to or greater than your entire investment regardless of which asset class you trade (equities, options or futures); therefore, you should not invest or risk money that you cannot afford to lose. Online trading is not suitable for all investors. View the document titled Characteristics and Risks of Standardized Options at www.TradeStation.com . Before trading any asset class, customers must read the relevant risk disclosure statements on www.TradeStation.com . System access and trade placement and execution may be delayed or fail due to market volatility and volume, quote delays, system and software errors, Internet traffic, outages and other factors. Securities and futures trading is offered to self-directed customers by TradeStation Securities, Inc., a broker-dealer registered with the Securities and Exchange Commission and a futures commission merchant licensed with the Commodity Futures Trading Commission). TradeStation Securities is a member of the Financial Industry Regulatory Authority, the National Futures Association, and a number of exchanges. TradeStation Securities, Inc. and TradeStation Technologies, Inc. are each wholly owned subsidiaries of TradeStation Group, Inc., both operating, and providing products and services, under the TradeStation brand and trademark. When applying for, or purchasing, accounts, subscriptions, products and services, it is important that you know which company you will be dealing with. Visit www.TradeStation.com for further important information explaining what this means.
NASDAQ:WMT
by TradeStation
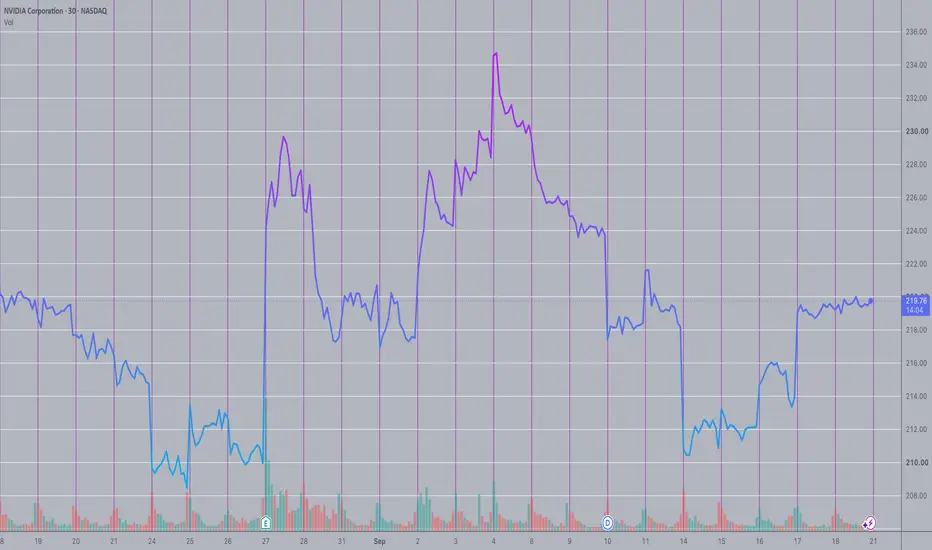
NVIDIA | Momentum or DistributionAI Leadership Faces a Critical Test – Momentum or Distribution? NVIDIA begins the week at a pivotal technical level as markets assess whether institutional investors continue accumulating AI leaders or begin rotating into other sectors. While the long-term AI narrative remains intact, short-term price action is likely to be driven by earnings expectations, valuation sentiment, and overall Nasdaq strength. The first hour of trading could provide valuable insight into institutional positioning for the week ahead. Key Market Drivers 🤖 Continued global investment in AI infrastructure and enterprise computing. 💻 Data center and GPU demand remain the primary long-term growth engine. 📊 U.S. earnings season could reshape expectations for the semiconductor sector. 🏦 Treasury yields and Federal Reserve outlook may influence high-growth technology valuations. 🌍 Geopolitical developments and semiconductor export policies remain key sentiment risks. Trading Plan 🟢 Bullish Scenario: Look for a sustained move above the opening range supported by rising volume, signaling institutional accumulation. 🔴 Bearish Scenario: Failure to hold key intraday support or repeated rejection near resistance may indicate profit booking and short-term distribution. "The biggest opportunities aren't created by headlines—they're created when institutional capital confirms the trend. Let price lead, not emotion."
NASDAQ:NVDA
by globuscapitas
Updated
USAR 1W - key confluence zone on the weekly chartNASDAQ:USAR Price has returned to the $14.70–$15.64 range, which previously acted as the main resistance throughout the 2024–2025 cycle. After the breakout, the market is now forming the first full retest of this area, now as potential support. Several technical factors are converging in this zone: previous resistance now acting as potential support, 50% Fibonacci retracement of the entire upward impulse, 100-period moving average on the weekly timeframe, and RSI and Stochastic in deeply oversold territory after the decline. This combination creates an area of increased interest for buyers. Aggressive entry during a continuing decline carries elevated risk. A more rational approach is to wait for confirmation on lower timeframes and the formation of a reversal structure within the zone. Near-term resistance sits at $20.07. The next key target is around $27.67, where intermediate supply is located. From a technical perspective, the market is now at a point where risk and potential reward are beginning to form an asymmetric opportunity.
NASDAQ:USARLong
by TotoshkaTrades
IREN | WeeklyNASDAQ:IREN — Quan-Entangling Model Quan-Analysis | Projecting Primary Wave ⓹ Extension 📈 As illustrated on the weekly chart below, through the interaction between the support and resistance Rays of both Quan-Structures ➤ Δ and λᵣ, the Primary-degree correction in Wave ⓸ may have further developed into a more complex Flat formation instead of the prior Double Zigzag. With the newly revised Quan-Structure Δ, the corrective structure remains firmly supported at the defined converging Rays confluence ➤ $ 32.22 , which may now be respected as the extreme point of the entire Primary-degree corrective phase. By projecting Primary Wave ⓹ as an extension through Ray 2 within Quan-Structure ψ, the defined HPQ Target ➤ $144 🎯 remains achievable into October —representing a potential + 333 %📈 impulsive advance. Quan-Entanglement Principle ➤ From my Quan-Analytical perspective, all identified Quan-Structures within a chart frame interact simultaneously to influence price behaviour—defining the direction of corrections, consolidations, expansions, structural formations, and their corresponding timelines. The degree of each expansion or formation is determined through the interaction of the identified Quan-Structures, as illustrated on the higher time frame. #SmartInvesting #StrategicAnalysis #FutureVision #TrendAnalysis #MarketInfrastructure #QuanAnalysis #QuantumEntanglement #QuantumShift
NASDAQ:IRENLong
by ElliottChart
MSFT | Deep Correction Complete—Bulls Target The Liquidity Above By analyzing the #MSFT (Microsoft) chart on the 4H timeframe, we can see that the broader trend remains bullish, and the deep correction that shook out weak hands looks to be complete. Price has reclaimed structure off a key demand area, and the setup now points toward the liquidity resting overhead. 📊 4H Timeframe On the 4H, the bigger picture is an uptrend that went through a deep corrective phase inside a descending channel. Two things then flipped the script: price printed an internal CHoCH (iCHoCH), signaling the correction was losing steam — and then, on the push lower into the Demand Zone ( $344.31 – $365.42 ), it executed a clean liquidity sweep, running the stops resting below before launching higher with force. That's the classic trap: take the liquidity, then reverse. Since reclaiming from demand, price has been grinding higher and is now building a smaller corrective channel after the last leg up, trading around $394.03 . A break of this corrective channel to the upside is the trigger that opens the door toward the stacked buy-side liquidity (BSL) overhead at $466.21 , $489.53 , and ultimately $555.39 . The entire bullish thesis stays valid as long as price holds above the Protected Low at $344.31 , with deeper structural support at $310.25 . 🎯 The Bias My base case is bullish continuation. The trend is up, the deep correction completed with an iCHoCH and a liquidity sweep into demand, and price has already reclaimed with strength. The trigger is a break of the current corrective channel to the upside — on that break, the draw is toward the BSL pools above ($466.21 → $489.53 → $555.39). In my view, as long as MSFT holds above the Protected Low ($344.31), every dip remains a buying opportunity rather than a reversal — the sweep already did its job of clearing the sellers. 📰 Fundamental Backdrop The bullish structure lines up with a compelling fundamental setup. Microsoft has been the laggard of the "Magnificent Seven," down roughly 20% year-to-date and about 29% from its record high, as investors punished the sector over fears that AI could disrupt legacy software — but that sell-off has left the stock at its cheapest forward multiple since 2023 (around 20–22x earnings), which many analysts frame as a rare entry point. The next major catalyst is fiscal Q4 earnings on July 29, and sentiment into it is constructive: the prior quarter beat with $81.3 billion in revenue (up 17% YoY), and analysts widely expect the print to spark a recovery. The Street is overwhelmingly bullish — the average target sits around $559–592 (well above current price), with fresh Buy reiterations citing Azure and M365 tailwinds plus underappreciated earnings power, and Microsoft just overhauled its cybersecurity unit to monetize AI-driven threats. The risk to respect: the enormous AI capex bill (FY2026 guidance up near $190 billion, ~61% higher YoY) is growing faster than revenue and could pressure margins — so the July 29 commentary on spend and Azure growth is the real test. But with the valuation reset and earnings imminent, the fundamental picture aligns with the bullish technical read. This analysis will be updated as the market evolves. If this breakdown added value, drop a like 👍 and a comment 💬 to support the work — and share where you see Microsoft heading next! Best Regards, BigBeluga 🐳
NASDAQ:MSFT
by BigBeluga
55
NOKIA: Is It Time to Take Another Look at the Stock?Is it time to pay attention to Nokia once again? Once the global leader in mobile phones, Nokia later suffered a dramatic stock market collapse following the arrival of the first smartphones, particularly Apple's. After trading near its lows for almost 14 years, between 2012 and 2026, Nokia's stock appears to have entered a new long-term uptrend since mid-2025, supported by the company's return to profitability. Yet almost nobody buys Nokia smartphones anymore. So why is the stock attracting investors again? The answer lies in artificial intelligence. In reality, Nokia is no longer the smartphone manufacturer the general public knew fifteen years ago. Today, the company is a global leader in telecommunications infrastructure, with businesses focused on 5G mobile networks, fixed broadband networks, optical networking, cloud infrastructure, and software solutions for telecom operators and large enterprises. The rapid expansion of artificial intelligence represents a new growth opportunity. AI data centers, hyperscalers, and the increasing demand for high-speed connectivity require networks that are faster, more reliable, and more energy-efficient. Nokia provides exactly the equipment and technologies that make this infrastructure possible. With profitability restored, a healthier balance sheet, and a valuation that remains attractive compared with many technology companies, Nokia is once again drawing the attention of investors. The market now sees a company well positioned to benefit from the major structural trends of the coming years: artificial intelligence, cloud computing, fiber optics, advanced 5G, and eventually 6G. From a technical analysis perspective, the stock has broken above an exceptionally strong long-term accumulation pattern—a horizontal trading range that lasted 14 years. Such a breakout is one of the most powerful bullish reversal signals in technical analysis. Any pullback toward the former upper boundary of this range, between €8 and €10, should be viewed as a potential buying opportunity, particularly if the stock retests its 200-day moving average. The chart below shows the weekly Japanese candlesticks of Nokia shares, highlighting the recent breakout above a 14-year trading range that lasted from 2012 to 2026. This is a powerful long-term accumulation pattern marking the end of a bear market. From a valuation standpoint, Nokia also appears inexpensive compared with its direct competitors. The table below compares Nokia's valuation with companies operating in the same industry. Nokia stands out as attractively valued based on both its forward P/E ratio and its Price-to-Sales ratio. DISCLAIMER: This content is intended for individuals who are familiar with financial markets and instruments and is for information purposes only. The presented idea (including market commentary, market data and observations) is not a work product of any research department of Swissquote or its affiliates. This material is intended to highlight market action and does not constitute investment, legal or tax advice. If you are a retail investor or lack experience in trading complex financial products, it is advisable to seek professional advice from licensed advisor before making any financial decisions. This content is not intended to manipulate the market or encourage any specific financial behavior. Swissquote makes no representation or warranty as to the quality, completeness, accuracy, comprehensiveness or non-infringement of such content. The views expressed are those of the consultant and are provided for educational purposes only. Any information provided relating to a product or market should not be construed as recommending an investment strategy or transaction. Past performance is not a guarantee of future results. Swissquote and its employees and representatives shall in no event be held liable for any damages or losses arising directly or indirectly from decisions made on the basis of this content. The use of any third-party brands or trademarks is for information only and does not imply endorsement by Swissquote, or that the trademark owner has authorised Swissquote to promote its products or services. Swissquote is the marketing brand for the activities of Swissquote Bank Ltd (Switzerland) regulated by FINMA, Swissquote Capital Markets Limited regulated by CySEC (Cyprus), Swissquote Bank Europe SA (Luxembourg) regulated by the CSSF, Swissquote Ltd (UK) regulated by the FCA, Swissquote Financial Services (Malta) Ltd regulated by the Malta Financial Services Authority, Swissquote MEA Ltd. (UAE) regulated by the Dubai Financial Services Authority, Swissquote Pte Ltd (Singapore) regulated by the Monetary Authority of Singapore, Swissquote Asia Limited (Hong Kong) licensed by the Hong Kong Securities and Futures Commission (SFC) and Swissquote South Africa (Pty) Ltd supervised by the FSCA. Products and services of Swissquote are only intended for those permitted to receive them under local law. All investments carry a degree of risk. The risk of loss in trading or holding financial instruments can be substantial. The value of financial instruments, including but not limited to stocks, bonds, cryptocurrencies, and other assets, can fluctuate both upwards and downwards. There is a significant risk of financial loss when buying, selling, holding, staking, or investing in these instruments. SQBE makes no recommendations regarding any specific investment, transaction, or the use of any particular investment strategy. CFDs are complex instruments and come with a high risk of losing money rapidly due to leverage. The vast majority of retail client accounts suffer capital losses when trading in CFDs. You should consider whether you understand how CFDs work and whether you can afford to take the high risk of losing your money. Digital Assets are unregulated in most countries and consumer protection rules may not apply. As highly volatile speculative investments, Digital Assets are not suitable for investors without a high-risk tolerance. Make sure you understand each Digital Asset before you trade. Cryptocurrencies are not considered legal tender in some jurisdictions and are subject to regulatory uncertainties. The use of Internet-based systems can involve high risks, including, but not limited to, fraud, cyber-attacks, network and communication failures, as well as identity theft and phishing attacks related to crypto-assets.
NYSE:NOK
by Swissquote
Webull Is Trying to Break Out of Its DowntrendNASDAQ:BULL Webull Corporation, ticker BULL, has had a rough run since its April 2025 IPO. After coming public during a volatile market backdrop, the stock has spent much of its short trading history moving lower. Now, the chart is starting to show something more interesting. On the weekly chart, BULL appears to be working its way out of a descending channel. The upper and lower boundaries of that channel line up with several prior resistance and support points, including a recent test near the end of June. A breakout from a descending channel does not automatically mean a new uptrend has started, but it is enough to put the stock back on the watchlist. The key level to watch first is around $7.50. This zone has mattered before, acting as both support and resistance. A clean weekly close above that level would be the first sign that buyers are starting to regain control. The next test sits close by: the 200-day simple moving average, currently around $7.68. If BULL can reclaim both the $7.50 zone and the 200-day moving average, the technical picture gets much more constructive. In that bullish scenario, the next major upside target could be around $16.50. That area has acted as resistance in the past, making it a natural place to watch if momentum continues. From current levels, that would represent a significant move, so confirmation matters. There is also a catalyst on the calendar. Webull has earnings coming up in August, and that could help push the stock higher if the market likes the results. Of course, the opposite is also true: earnings could trigger a retest of the lows if the reaction is negative. For now, BULL is a momentum setup that needs proof. The descending-channel break is interesting, but the stronger signal would be a confirmed move above $7.50 and the 200-day moving average. Until then, it remains a watchlist idea rather than a fully confirmed breakout. If you liked this article, please consider boosting it! It only costs you a mouse click. This is not financial advice. Always do your own research and manage risk carefully.
NASDAQ:BULLLong
02:40
by riseab0v3
Next Volatility Period: Around August 14th Hello? Nice to meet you, fellow traders. If you "follow" me, you can always get new information quickly. Have a great day. ------------------------------------ The price is showing signs of falling back into the 346.45 ~ 381.59 range. Therefore, the key question is whether it can find support in the 346.45 ~ 381.59 range and rise. The important support and resistance zone is between 268.07 and 299.29, so you should prepare a response plan if the price falls below 346.45. Therefore, 1st: 346.45 ~ 381.59 2nd: 268.07 ~ 299.29 It is a buying opportunity when the price receives support near the 1st and 2nd levels mentioned above. Since the next period of volatility is expected to begin around August 14th, I believe this support test holds significant meaning. - The confirmation of support is crucial because the price must receive support in the 346.45 ~ 381.59 range to rise along the ascending channel. ----- Thank you for reading to the end. I wish you a successful trade. --------------------------------------------------
NASDAQ:TSLA
by readCrypto
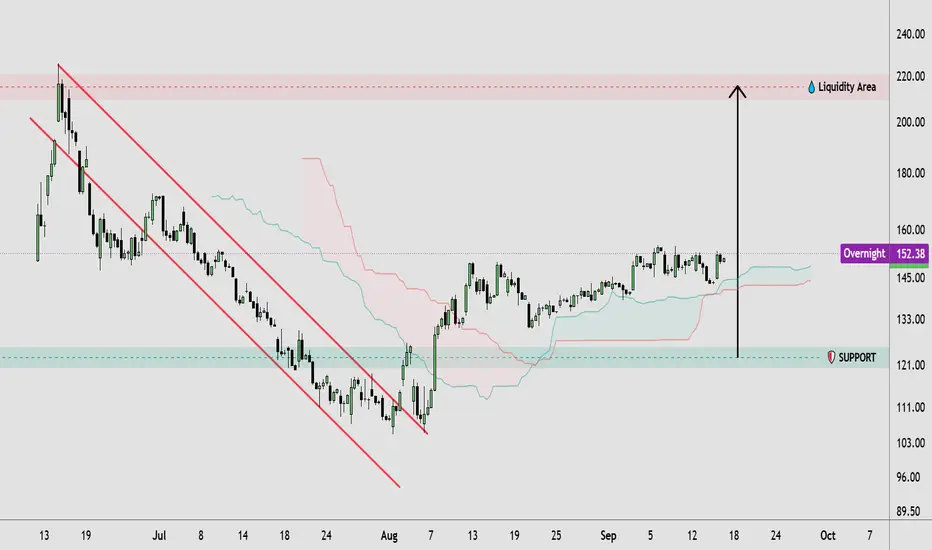
COIN: Forming 3 Month long inverse H&S PatternForming 3 month long Inverse H&S pattern. Currently forming right shoulder. 152.56 is the Right Shoulder Level. aggressive buyer can make entry now with SL below 152.56 or more safer play below the head i.e 139 Level. Breakout of 173 will confirm the pattern and it's breakout.
NASDAQ:COIN
by dharam4511
Is AI's Thirst About to Reprice the World's Water Stocks?The United Nations warns that the world has entered an era of global water bankruptcy. Four billion people already live under water stress, and AI data centers are projected to consume 9.3 trillion liters of water annually by 2030. That volume could cover the basic household needs of 1.3 billion people. Against this backdrop, Essential Utilities (NYSE: WTRG) trades at 20.1 times earnings, a clear premium to the global water utility average of 14.9. The company plans 1.4 billion dollars in infrastructure spending while PFAS cleanup mandates and regulatory pressure threaten that premium. Is the market underpricing the scarcest asset of the AI age, or overpaying for it? The technology layer is shifting just as fast. Conventional air cooling cannot handle heat fluxes above one kilowatt per chip, pushing operators toward liquid and immersion cooling in a market set to reach 27.1 billion dollars by 2035. The expiration of Asetek's seminal Pump-on-Block patent has unleashed royalty-free manufacturing of compact cold plates worldwide, reshuffling the competitive deck among Munters, IBM, and CoolIT. Meanwhile, water networks have become an active cyber battlefield. CISA and the FBI warned in April 2026 of Iranian-affiliated groups exploiting internet-facing utility controllers, China's Volt Typhoon maintains persistence inside US critical infrastructure, and May 2026 brought the first documented AI-assisted attack on a water utility, targeting Monterrey's network in Mexico. The geopolitical stakes may be highest of all. Ethiopia's completed Grand Renaissance Dam threatens to cut Nile flows to Egypt by up to 25%, and both nations are preparing militarily while rival Red Sea alliance blocs crystallize around them. The full analysis, with all data tables and sources, breaks down what this collision of compute, water, and geopolitics means for utility valuations.
NYSE:WTRGLong
by UDIS_View
Devastating setupMarket leader in the AI agent sector, which I already described in the previous idea +++++ Analysis The price is approaching earnings (Wednesday) with a clear W-formation. The key breakout for the start of the bullish move is a close above $110, accompanied by increasing volume. Good earnings could push it higher as early as Wednesday, while a negative report will bring the price back to retest the blue support level. Devastating target in the $150 area, and maybe even $170 to fill the GAP. I'd say let's set our alerts properly to maximize the loot.
NYSE:NOW
by balinor
11
$RKLB — Long-term Support Retest The NASDAQ:RKLB stock is currently holding its long-term rising highs line and long-term support line, which are crucial levels for the stock's overall trend. Additionally, a reversal candle has formed after a drop, indicating potential buying interest. With a close stop loss in place, it's possible to enter this trade with relative safety. The distant averages are likely to provide further support and help pull the price up. This setup will be invalidated if the stock fails to hold its long-term support line. Not financial advice.
NASDAQ:RKLBLong
by Stockguruvip
112233445566778899101011111212131314141515161617171818191920202121222223232424252526262727282829293030313132323333343435353636373738383939404041414242
…999999

Made by humans

Select market data provided by ICE Data Services. Select reference data provided by FactSet. Copyright © 2026 FactSet Research Systems Inc.Copyright © 2026, American Bankers Association. CUSIP Database provided by FactSet Research Systems Inc. All rights reserved. SEC filings and other documents provided by Quartr.© 2026 TradingView, Inc.

More than a product
  • Supercharts
Screeners
  • Stocks
  • ETFs
  • Bonds
  • Crypto coins
  • CEX pairs
  • DEX pairs
  • Pine
Heatmaps
  • Stocks
  • ETFs
  • Crypto coins
Calendars
  • Economic
  • Earnings
  • Dividends
  • IPOs
More products
  • News Flow
  • Portfolios
  • Fundamental Graphs
  • Yield Curves
  • Options
  • Macro Maps
  • Pine Script®
Apps
  • Mobile
  • Desktop
Community
  • Social network
  • Wall of Love
  • Refer a friend
  • House Rules
  • Moderators
Ideas
  • Trading
  • Education
  • Editors' picks
Pine Script
  • Indicators & strategies
  • Wizards
  • Freelancers
  • Paid Spaces
Tools & subscriptions
  • Features
  • Pricing
  • Market data
  • Gift plans
Trading
  • Overview
  • Brokers
  • Brokers comparison
  • The Leap
Special offers
  • CME Group futures
  • Eurex futures
  • US stocks bundle
About company
  • Who we are
  • Space mission
  • Blog
  • Help Center
  • Careers
  • Media kit
Merch
  • TradingView store
  • Tarot cards for traders
  • The C63 TradeTime
Policies & security
  • Terms of Use
  • Disclaimer
  • Privacy Policy
  • Cookies Policy
  • Accessibility Statement
  • Security tips
  • Bug Bounty program
  • Status page
Business solutions
  • Widgets
  • Charting libraries
  • Lightweight Charts™
  • Advanced Charts
  • Trading Platform
Growth opportunities
  • Advertising
  • Brokerage integration
  • Partner program
  • Education program
Community
  • Social network
  • Wall of Love
  • Refer a friend
  • House Rules
  • Moderators
Ideas
  • Trading
  • Education
  • Editors' picks
Pine Script
  • Indicators & strategies
  • Wizards
  • Freelancers
  • Paid Spaces
Business solutions
  • Widgets
  • Charting libraries
  • Lightweight Charts™
  • Advanced Charts
  • Trading Platform
Growth opportunities
  • Advertising
  • Brokerage integration
  • Partner program
  • Education program
Look FirstLook First