Long
Long
 Short
Short
Even Strong Companies Can FallA strong and successful company today does not guarantee that it will remain dominant forever. History has shown that even companies with powerful brands, strong financial positions, large customer bases, and dominant market positions can eventually decline or lose their relevance.
Historical Examples
Kodak was once one of the most powerful photography companies in the world. It dominated the film industry for decades. However, the rapid transition from traditional film to digital photography changed the entire industry. Kodak failed to adapt effectively and eventually filed for bankruptcy protection.
Nokia was once the world's largest mobile phone manufacturer. Its brand was extremely strong, and its products were used by millions of people worldwide. However, the arrival of smartphones and intense competition from Apple and Android manufacturers dramatically changed the market. Nokia lost its dominance because technology and consumer preferences evolved faster than the company could respond.
BlackBerry was once the preferred smartphone brand for businesses and governments. At one point, its market position seemed extremely strong. However, touchscreen smartphones and app ecosystems transformed the industry. BlackBerry eventually lost a significant portion of its market relevance.
These examples demonstrate an important lesson for investors: a strong company can still face serious challenges when technology, competition, consumer behavior, or the business environment changes.
What Does This Have to Do With Adobe?
Adobe is undoubtedly a major company with strong products, an established ecosystem, recurring subscription revenue, and globally recognized brands such as Photoshop, Illustrator, and Premiere Pro.
However, being fundamentally strong does not mean the company is completely protected from future risks.
The creative software industry is changing rapidly, particularly because of artificial intelligence. New AI-powered tools, competitors, and alternative platforms could potentially put pressure on Adobe's traditional business model. If users discover cheaper, faster, or more innovative alternatives, Adobe could face increasing competition.
Another important factor is valuation and investor expectations. A company can have strong financial fundamentals while its stock price still struggles or declines. The stock market does not only evaluate how strong a company is today—it also considers how much future growth is expected. If future growth slows down or fails to meet investors' expectations, the share price can come under significant pressure.
This does not mean that Adobe will necessarily collapse or become another Kodak or Nokia. Adobe remains a major player with significant strengths. However, history teaches us that no company should ever be considered completely untouchable or guaranteed to succeed forever.
The Key Lesson for Investors
Strong fundamentals do not guarantee a continuously rising stock price.
A company may remain profitable while its stock price declines. A company may have a powerful brand while gradually losing market share. A dominant company may also face disruption from new technology.
That is why investors should avoid blindly assuming that a famous and financially strong company will always remain strong.
Even giants can fall. The market is constantly changing, competition never stops, and technological disruption can transform an entire industry faster than investors expect.
Adobe is strong today—but every investor should understand that strength today is not a permanent guarantee for tomorrow.
That is why, when I say Adobe’s stock price could fall below $100, it is not an impossible scenario.
Disclaimer: This is my personal opinion and general market analysis. It is not financial advice. Investors should conduct their own research before making any investment decision.  Short
Short
GRAB (Grab Holdings): The Ultimate Macro DisconnectAccumulating the Low $3s
If you want a textbook example of a company executing flawlessly while the stock gets punished by macro headwinds, look no further than $GRAB.
As seen on the daily chart (image_9.png), the stock has suffered a brutal slide from the $6.60 zone late last year all the way down to $3.25. Emerging market tech has been battered by FX volatility, shifting interest rate expectations, and rotational selling. The macro winds simply aren't letting it fly.
However, the underlying business is a cash-generating juggernaut right now. Here is why the current $3.00 - $3.30 zone is a prime area to build a long-term position, along with a structured accumulation plan.
The Fundamental Disconnect: A Valuation Anomaly
While the chart looks heavy, Grab's actual Q2 2026 earnings were an absolute blowout:
Massive Top-Line Growth: Q2 revenue grew 22% year-over-year, hitting $997 million.
Record Profitability: They posted a record profit of $235 million for the period (up $215 million YoY).
Shareholder Yield: Management knows the stock is cheap. They recently raised their full-year guidance and announced a massive $750 million share repurchase program.
They have established dominance in Southeast Asia's mobility, delivery, and digital banking sectors. The company is printing cash, but the market is pricing it like a distressed asset.
The Technical Setup: Historical Floor
Looking at image_9.png, the technical mechanics are straightforward:
The Support Zone: The $3.00 to $3.30 range has historically acted as a massive structural floor (as seen before the massive run-up to $6.60). We are currently testing this exact liquidity pool at $3.25.
Oversold Conditions: The price has cleanly broken below the dynamic moving average and is experiencing capitulation-style selling. The sellers are running out of ammunition in this demand zone.
The 4-Week Accumulation Plan (DCA Strategy)
Because macro headwinds (like currency fluctuations) can keep the price suppressed longer than expected, we do not want to deploy all our capital at once. We want to buy slowly and steadily over the next month.
Total Allocated Capital: 100% (Divide into 4 Tranches)
Tranche 1 (25% - Immediate Entry): Execute at the current market price near $3.25. You are securing your baseline position right on the historical support line.
Tranche 2 (25% - Week 2): Set a limit order at $3.15. If the broader market experiences a slight pullback, you catch the discount. If it doesn't trigger, buy at market at the end of Week 2.
Tranche 3 (25% - Week 3): Set a limit order at $3.05 (the absolute bottom of the structural floor). If the price holds above this, execute at market at the end of Week 3.
Tranche 4 (25% - Week 4): Keep this as dry powder. If the stock breaks below $3.00 on macro panic, you use this to aggressively average down in the $2.80 - $2.90 range. If the stock begins its reversal, you use this to add on the first confirmed higher-low.
Price Targets
Once the macro rotation favors emerging markets again, the rebound will be aggressive.
Target 1 (Short-Term Reversion): $4.00 - $4.20. This aligns with the downward-sloping moving average and the first major resistance block shown on the chart.
Target 2 (Mid-Term Fair Value): $5.45 - $6.00. This aligns with the average 12-month Wall Street analyst consensus.
Target 3 (Macro Bull Run): $7.00. The high-end analyst target, requiring a complete shift in emerging market sentiment.
The company is buying back its own stock by the hundreds of millions. Smart money is accumulating the low $3s. Manage your risk, build your position slowly, and let the fundamentals catch up to the chart.
Are you accumulating NASDAQ:GRAB at these levels, or waiting for the macro environment to shift first? Let me know your average cost below! 👇  Long
Long
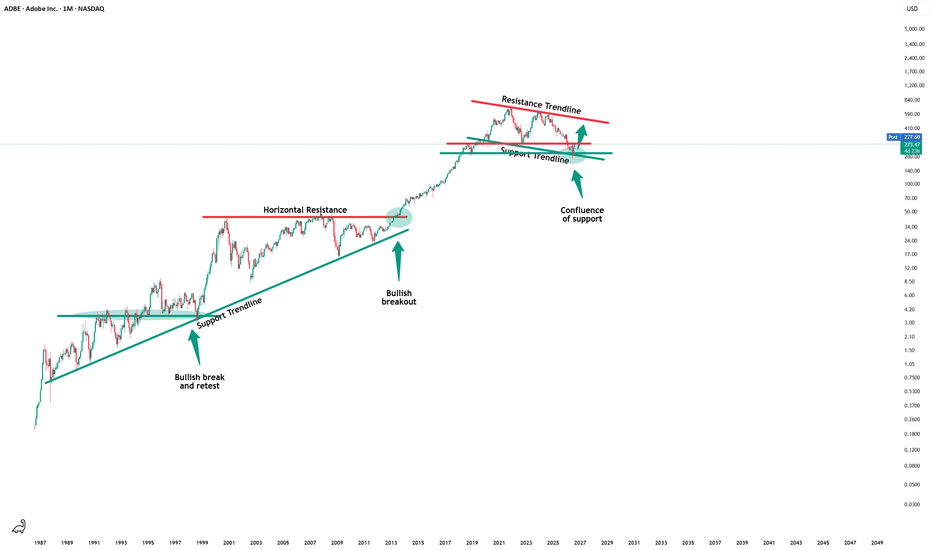
Price drop sharply deeperHere are several reasons why Adobe stock may struggle to rise, even if the company still has strong fundamentals:
Strong competition in AI: Adobe faces increasing competition from companies offering cheaper or even free AI-powered creative tools.
Investor concerns about AI disruption: Generative AI could disrupt Adobe's traditional business model and reduce the demand for some of its existing products.
High valuation expectations: When a company has been highly valued for years, investors expect strong growth. If growth slows, the stock can come under pressure.
Slowing growth: Even a profitable company can struggle in the stock market when its revenue and earnings growth no longer meet investor expectations.
Changing customer behavior: Customers now have more alternatives, including subscription-based and AI-driven creative tools.
Technical selling pressure: When important support levels are broken, selling momentum can accelerate as traders and investors become more cautious.
Strong fundamentals do not guarantee a rising stock price: The stock market is forward-looking. Investors focus not only on current performance but also on future growth potential.
Conclusion:
In my opinion, Adobe's strong fundamentals alone may not be enough to push its stock price higher. Concerns about AI competition, slowing growth, high expectations, and negative market sentiment could continue to put pressure on the stock.
Disclaimer: This is my personal opinion and market analysis, not financial advice. Short 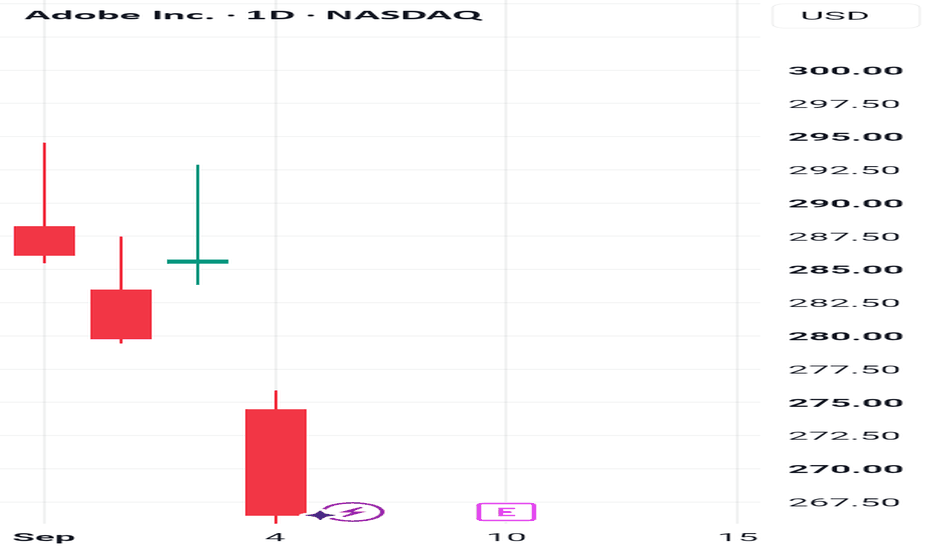
Meta Stock Tests the Path Toward $650Over recent trading sessions, a meaningful bullish bias has once again become relevant around Meta's stock price performance in the short term. Over the last five trading sessions, the stock has gained more than 10%, a move that continues to highlight consistent buying pressure within the market.
Part of this momentum has been supported by Meta's continued focus on strengthening its artificial intelligence strategy. Among the company's recent developments, Muse stands out as its new personal AI agent, which is expected to integrate with applications such as Instagram and Facebook. This dynamic has helped reinforce confidence around the stock because the market is beginning to perceive that the significant investments made in artificial intelligence are being transformed into tangible products that could help provide long-term margin stability. As these developments begin to meet the expectations outlined by the company, recent buying pressure could continue to remain relevant over the coming weeks.
An Important Bearish Trendline Remains the Dominant Pattern: Despite the recent bullish price action, which has brought the stock closer to the psychological $650 area, buying pressure has not yet been strong enough to threaten the major bearish trendline that has remained in place for several months. For now, this continues to be the most important technical structure on the chart. Unless buyers manage to overcome key resistance levels, this trendline could continue dominating price action during the coming weeks.
MACD: The MACD histogram continues to hold above the neutral 0 level, reflecting that the average strength of short-term moving averages remains supportive of a bullish bias. As long as this behavior persists, the bullish momentum could continue to play an important role in the short term.
RSI: The RSI also continues to trade above the neutral 50 level, suggesting that average buying momentum remains favorable for the stock. However, it is also important to note that the RSI slope has begun to flatten and show signs of slowing momentum. This behavior may be signaling a gradual loss of strength as the stock approaches important resistance levels on the daily chart.
Key Levels to Watch:
$650: A major resistance area that represents the most important round-number level on the chart and also coincides with the long-term bearish trendline. Price action that manages to establish itself above this level could put the current bearish structure at risk and create room for a more dominant bullish bias over the longer term.
$622: A nearby barrier that coincides with the 50-period Simple Moving Average and could begin creating challenges for the stock's recent advance. If price action fails to establish itself consistently above this level, corrective downside moves could begin to emerge during the coming trading sessions.
$595: An important support level that corresponds to the 200-period Simple Moving Average. Price action moving below this area could begin to restore relevance to a bearish bias that has lost momentum in recent weeks and favor an extension of the broader bearish trendline as the dominant chart structure.
Written by Julian Pineda, CFA, CMT – Market Analyst $SAIL are we on the bench or on the field?Why Smart Money is Waiting for the Dust to Settle
Tomorrow morning, September 9, NSE:SAIL steps up to the earnings plate, and the options market is pricing in a massive 17.97% implied move.
Looking at the daily chart , the price looks heavy after today's -5.47% haircut down to $17.79. However, the underlying fundamentals and recent corporate moves paint a picture of a company aggressively positioning itself to capture the future of AI and identity security.
Here is the critical breakdown of the fundamental catalysts, the technical structure, and the professional game plan for navigating this massive volatility.
The Fundamental Setup: Growth vs. Cash Burn
The narrative around SailPoint is a classic tug-of-war between impressive top-line growth and the structural realities of their profitability:
The Expectations: Consensus estimates are calling for Q2 revenue around $310 million to $310.4 million, and adjusted EPS of $0.07 to $0.08 per share. Wall Street will be heavily focused on Annual Recurring Revenue (ARR) growth, net retention, and forward guidance to drive the move.
The AI Pivot & Expansion: In June, SailPoint signed a letter of intent to acquire Entro Security to integrate with their new "Agentic Fabric". This is a strategic play to dominate the non-human identity security market. Wall Street is buying this narrative TD Cowen recently noted that SailPoint's ARR outlook sits 9% above consensus.
Upgrades & Guidance: Analysts from Cantor Fitzgerald and Barclays have recently raised their price targets to $25 and $21, respectively. Furthermore, management recently raised their FY2026 revenue guidance to a range of $1.05 billion to $1.058 billion.
The Red Flag: Despite the top-line revenue growth of roughly 24% year-over-year, SailPoint is still fundamentally unprofitable, posting heavy net losses of $157.42 million over the trailing 12 months. In a macro environment that punishes cash-burning tech companies, any deceleration in ARR or weak forward guidance will be met with brutal selling pressure.
The Technical Structure: Trapped in the Range
The price action on the Daily chart perfectly reflects this fundamental tug-of-war:
The Macro Chop: After a brutal capitulation down to the $10.50 zone earlier this year, the stock staged a violent V-shaped recovery, pushing back above the $20.00 psychological level.
The Moving Average Rejection: The recent summer rally ran out of steam exactly at the dynamic moving average. The recent drop to $17.79 confirms that sellers heavily defended the $20.00 - $22.00 liquidity pool ahead of the print.
The Implied Move Targets: A roughly 18% implied move from the current $17.79 close translates to a $3.20 swing.
Upside Target (~$21.00): This perfectly aligns with the recent structural resistance. A gap up into this zone will face immediate sell pressure from trapped longs.
Downside Target (~$14.60): This drops the price right back into the previous consolidation zone, filling the structural void left by the recent rally.
The Game Plan
Holding directional equity through an almost 18% implied volatility event on an unprofitable tech stock is gambling, not trading. Position sizing would be important to keep an eye here.
1. Do Not Front-Run: If you are not already holding a structured options position (like an Iron Condor to harvest IV crush), step aside. The premium is far too expensive to buy directional calls or puts right now.
2. The Upside Breakout: If they post a blowout quarter and gap up into the $21.00 resistance, do not buy the open. Wait for the first 30-60 minutes of trading to see if the market absorbs the supply. If we see a confirmed 1-hour close above $21.50, the structural downtrend is broken, and you can look for continuation setups toward the recent analyst $25 targets.
3. The Downside Flush: If guidance disappoints or ARR growth decelerates, the stock is likely to crater toward the mid-$14s. Let the dust settle, look for daily candle wicks to form in that demand zone indicating institutional absorption, and hunt for a capitulation bounce on the lower timeframes.
Are you playing the IV crush, or waiting for the post-earnings breakout to deploy capital? Let me know your NSE:SAIL execution strategy in the comments below! 👇 CRWV Vs. NVDA: The "Shovel" vs. The "Mine"Why CoreWeave Offers the Higher Beta Upside IMHO!
Everyone knows NASDAQ:NVDA is the undisputed king of the AI revolution. They sell the shovels (GPUs) for the AI gold rush. But when a company reaches a multi-trillion-dollar market cap, the days of explosive, multi-bagger upside become mathematically constrained.
If you are looking for the next phase of alpha in the AI infrastructure supercycle, you have to look at the companies building the physical mines where those GPUs operate. Enter NASDAQ:CRWV (CoreWeave).
Looking at the 4-hour chart , we are seeing aggressive accumulation pushing the price back toward the $100 psychological level after shaking out weak hands in the mid-$80s. But the real story is in the fundamentals. Here is why CRWV presents a structurally higher upside potential than NVDA moving forward, along with the critical risks you must manage.
The Fundamental Symbiosis: How Both Benefit
Nvidia and CoreWeave are entirely symbiotic. AI compute demand is growing exponentially, and hyperscalers (like AWS and Azure) are struggling to keep up.
CoreWeave operates as an AI-specialized "neocloud," building massive, high-density data centers optimized specifically to run Nvidia's hardware. Nvidia benefits by selling billions in chips, and CoreWeave benefits by renting out that fully integrated compute capacity to AI labs and enterprises at a premium.
The Case for CRWV's Outsized Upside
Nvidia is essentially maxed out on valuation multiples; its growth is now a known quantity. CoreWeave, on the other hand, is uniquely positioned to capture the aggressive, physical build-out phase with far more runway:
The Nvidia Backstop: Nvidia doesn't just sell to CoreWeave; they are deeply invested. In January 2026, Nvidia directly invested another $2 billion into CRWV stock. More importantly, they established a $6.3 billion capacity agreement where Nvidia agreed to act as a backstop, promising to buy unsold compute capacity if other customers do not utilize it. Nvidia has essentially de-risked CoreWeave's expansion.
The Massive Backlog: CoreWeave’s Q2 2026 numbers were staggering. Revenue grew 112.5% year-over-year to $2.58 billion. But the true upside lies in their backlog, which currently sits at roughly $104 billion in contractually committed future revenue.
Analyst Upgrades: Wall Street is waking up to this pricing power, with major firms like Truist recently hiking their price targets to $165.
The Red Flag: The Cash Burn Monster
As a trader, I cannot ignore the elephant in the room: CoreWeave's balance sheet is stretched to the absolute limit.
This is a capital-intensive, "build-first, profit-later" model. In Q2, despite the massive revenue, CRWV posted a net loss of $626 million and suffered negative free cash flow of roughly -$5.74 billion. They are relying on aggressive debt financing (floating rate loans and massive credit facilities) to fund these data centers.
The Stabilization Thesis: This massive cash burn is a feature, not a bug, of early-stage infrastructure project financing. As their massive multi-gigawatt pipeline of data centers actively goes live over the next 12 to 18 months, capital expenditures will peak and naturally taper off. Once the infrastructure is built and the $104 billion backlog begins converting into realized operational cash flow, those margins will stabilize, and the massive debt load will become serviceable.
What is your take on this two giants?
I hear you!  Long
Long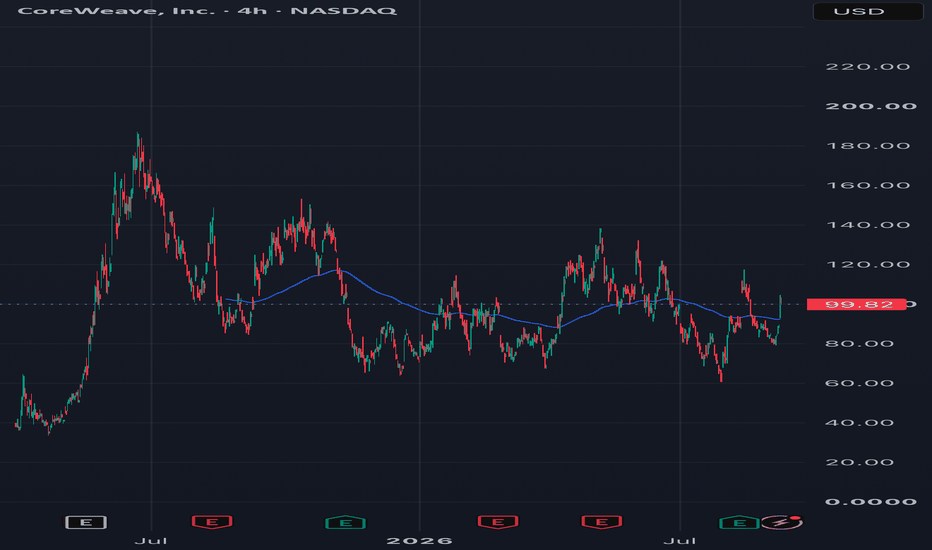
$PATH (UiPath): The Post-Earnings Flush | A Structural Play
If you have been watching PATH after its latest Q2 earnings report, the chart looks brutal. After grinding its way up toward the $19 level, the stock suffered a massive gap down, currently sitting around the $14.00 zone as seen on the daily chart.
But when you strip away the immediate market panic and look at the actual numbers, this sell-off smells like a classic overreaction. Here is the fundamental thesis and the technical game plan for why NYSE:PATH is flashing a prime accumulation opportunity.
The Fundamental Thesis: The AI Transition is Working
The market aggressively punished the stock (dropping over 16%) primarily due to modest ARR guidance and a soft Q3 outlook. Management noted longer decision-making cycles as enterprises evaluate their mix of deterministic and AI-driven automation. Persistent attrition among smaller customers also contributed to the negative sentiment.
But under the hood, the core enterprise business is thriving and deeply embedded:
Top-Line Beat: UiPath delivered Q2 revenue of $410.3 million (up 13.4% YoY), comfortably beating analyst estimates of $397.9 million. Adjusted earnings also hit expectations at $0.15 per share.
Enterprise Growth: The big fish are scaling. Customers generating over $1 million in Annual Recurring Revenue (ARR) grew by 21% to 387.
AI & Cloud Adoption: This is the most crucial structural metric—Cloud ARR surged 19% YoY to approximately $1.3 billion, and 18 of their top 20 deals actively included AI integration.
The transition to agentic AI is causing temporary friction in sales cycles, but UiPath is successfully embedding itself into massive corporate infrastructures. Management even slightly lifted their full-year revenue guidance to a midpoint of $1.79 billion. The underlying fundamentals do not justify this violent markdown.
The Technical Setup: The Value Zone
Looking at the Daily chart, the mechanics of this drop give us a clear roadmap:
The Liquidity Flush: The harsh gap down wiped out months of gradual retail accumulation. However, this $13.50 - $14.00 zone has historically acted as a major structural floor before the massive rally earlier this year.
The Gap Magnet: Markets abhor a vacuum. The huge gap left behind on the daily chart stretching up toward $17.00 provides a highly visible liquidity magnet once the institutional absorption is complete.
Washout Phase: The initial panic selling is exhausting. We are now hunting for the transition from distribution to quiet accumulation.
The Execution Playbook (Cold-Blooded)
We do not catch falling knives blindly, even with a strong fundamental thesis. Here is how you position like a professional:
1. Wait for Stabilization: Let the dust settle. Do not buy the middle of a collapsing daily red candle. We want to see the daily candles compress, lower wicks form, and a solid structural floor build near this $14.00 level.
2. The LTF Trigger: Drop down to the 15-minute chart for execution. Wait for a volume surge that signals absorption, followed by a period of stabilization. Your trigger is a clean 2-bar streak of bullish confirmation. That is the signal that smart money is done pushing the price down.
3. Averaging & Risk: Deploy your first tranche on that LTF confirmation. Set a strict, leverage-adjusted Stop Loss below the macro historical lows (the $10.00 - $11.00 zone). If that level breaks, you cut the trade instantly with zero emotion. As the daily chart establishes a confirmed Market Structure Break (MSB) to the upside, pyramid into your winning position on the higher lows to maximize your size for the gap fill.
The market is pricing in panic over delayed sales cycles, but the $1M+ enterprise ARR metrics tell a story of dominant growth. Let the technical structure confirm the bottom, manage your risk, and wait for the squeeze.
Are you buying the fear on NYSE:PATH , or waiting for lower levels? Let me know your accumulation zones in the comments below! 👇
Disclaimer: This analysis is for educational purposes for the finance trading community. It is not financial advice. Always trade your own plan and manage your risk strictly.  Long
Long
 Short
Short
ORCL: An Elliott Wave roadmap through the next resistance testsORCL has recovered from its July low, but the next useful question is whether buyers can establish strength above $171–172. That is the first decision point in this daily Elliott Wave roadmap. The more ambitious targets depend on several further confirmations.
This chart covers September 30, 2022 through September 8, 2026. The latest displayed regular-session close is approximately $162.52. Prices are in USD on the TradingView ORCL daily chart; some historical anchors remain visually rounded.
The working count treats the advance from roughly $61 in 2022 to $345.72 in September 2025 as Cycle wave . The blue Primary-degree 1–5 sequence describes that advance. The subsequent decline is provisionally counted as an A–B–C correction within Cycle , with a possible ending low at $114.50 on July 28, 2026. Purple Intermediate-degree subdivisions add detail inside Primary wave 5 and the corrective A, B and C legs. This is a selected, nested subdivision, not a claim that every internal swing has a unique interpretation.
The distinction between a plausible count and a confirmed turning point matters. A completed-looking correction can evolve into a more complex structure. Elliott analysis is most useful here as a framework for asking what price must do next, and what would invalidate the interpretation. Labels organize the evidence; they do not remove uncertainty.
The 2025 acceleration and subsequent deep retracement can be read as a transition from an extended advance into a larger correction. That interpretation supports watching for a new cycle, but it does not establish that the new cycle has begun. A rally can still be part of the correction it appears to be escaping.
For a practical decision framework, I would first look for a daily close above $171–172, followed by a retest that holds and a higher low. A brief intraday break followed by rejection would be weaker evidence. Until that confirmation develops, patience remains a valid position. Even after confirmation, the distance to the next resistance zone needs to justify the risk of the particular setup.
The target ladder is deliberately conditional:
• $200–205: the first recovery reference. A 38.2% retracement of the $345.72-to-$114.50 decline is approximately $202.83.
• $250–260: a more substantial test, combining the June wave B high near $250.25 with the 61.8% recovery level near $257.39. Sustained acceptance above this area would strengthen the case for a larger trend reversal.
• $340–346: the previous cycle-high region. This only becomes a relevant continuation objective after the lower resistance zones have been reclaimed.
• $395–410: a longer-term projection, conditional on the July low surviving and price eventually breaking above $346. The arithmetic reference is $114.50 + 1.0 × ($345.72 − approximately $61), or roughly $399. It is a measured-wave reference, not a promise or a timed forecast.
The alternative deserves equal visibility. A break below $114.50 would invalidate the claim that Cycle ended at the July low. A more complex W–X–Y correction would then remain possible, with roughly $94–100 as the next reference zone; the 88.6% retracement of the 2022–2025 advance lies near $93.46. A break below the 2022 origin around $61 would invalidate this entire Cycle I/II interpretation.
The $114.50 level is a structural invalidation, not automatically a suitable stop for a new trade near current prices. A trade stop should come from the actual entry structure, with position size reflecting that distance and the risk of gaps. No order or position is implied by this analysis.
For now, the most informative development is how ORCL behaves around $171–172. A sustained reclaim would advance the recovery thesis; rejection would keep the correction scenario open. The dashed paths show possible sequences, not dates.
Educational technical analysis. Wave counts and target zones are conditional and should be reassessed as price develops. Long
 Long
Long
MU – Breakout Above 1000 C1, 1050 Call Wall NextMU has broken above 1000 , which serves as both the start of the call cluster and the dominant call wall in the cumulative October 16 profile. With spot near 1017.56 , price has entered positive gamma extension after consolidating above its rising 50-day moving average.
The role of 1000 has now changed from resistance to the first breakout-support test. Holding above it keeps gamma-squeeze potential open toward 1050 C2 , followed by 1100 C3 .
🔶 Regime Context 🔶
MU remains well above the 942.5 HVL , keeping the broader structure in positive GEX. GEX History shows the tracked horizons broadly aligned in positive gamma, with several shifting into extension at the right edge. The current daily breakout confirms the initial shift, but continued acceptance above 1000 is still required.
🔶 Options Structure Context 🔶
👉 1000 – C1 breakout support
Confluence at 1000:
C1 — highest call NETGEX
Ab1 — largest absolute gamma
D+ — strongest positive delta exposure
nCOI / COI — strongest net and gross call open interest
nPV / PV — strongest cumulative put volume
This makes 1000 a major two-sided reaction zone rather than only a round-number breakout.
The nearest secondary GEX peak sits at 1020 . The strongest individual call flow inside the selected horizon also appeared there for the September 9 expiration, with 21,882 contracts. Above that immediate test, 1050 C2 is the next primary call wall.
At 1100 , C3 overlaps with the strongest cumulative call and net call volume, making it the larger extension reference if momentum continues beyond 1050.
🔶 Downside Structure 🔶
👉 1000 – C1 / breakout support
👉 942.5 – HVL / regime pivot
👉 920 – P1 / strongest put wall
A move back below 1000 would return MU to the transition zone. The more consequential failure would be below 942.5 HVL , where the current positive regime would weaken. The 920 P1 also sits near the rising 50-day moving average, creating a broader support area. Below 920, the next put references are 900 P3 and 850 P2 .
🔶 Options Sentiment 🔶
CALL$ at 79.5% means calls at an equivalent distance from spot are priced 79.5% higher than corresponding puts. This is elevated call-pricing skew, not a directional guarantee.
The Options Oscillator histogram is turning sharply higher at the right edge, showing that call skew is building.
IVRank 38.5
IVx 74.2 (38 DTE) | IVx 5dCh +10.2%
CALL$ 79.5% (38 DTE) — call-pricing skew
Implied move ±2.67% (±27.2)
🔶 Key Structure to Watch 🔶
1000 — C1 breakout support and primary confluence
1020 — immediate secondary GEX and front-expiry call-flow test
1050 — C2, next primary call wall
942.5–920 — HVL-to-P1 downside structure
For now, MU remains in positive extension above 1000, but elevated call skew and rising IV increase the importance of genuine acceptance.
The key question is whether MU can hold 1000 , absorb the activity around 1020 , and continue toward 1050 , or whether the breakout returns to the transition zone.  Long
Long
 Long
Long
GPK: Beginning of the C-D Leg?GPK just experienced the most bearish alignment in Ichimoku: Sanyaku Gyakuten. In addition, it looks like (as of the time of this writing) that it will close decisively below a major trend line--that is, the bottom of the channel.
The average Western trader calls it a bear flag. The Ichimoku trader looks at it as the corrective or B-C leg of a forming N wave. The A-B leg of this whopper, multi-month N wave started in August of last year. Also, GPK seems to be coming off a head and shoulders. This could be the start of a C-D leg that takes it down to a penny stock again.
Structure: Sanyaku Gyakuten, trend-line break, head and shoulders.
Confirmation: Sanyaku confirmed, close below trend line. I have missed a lot of trades looking for a retracement to the trend line and/or cloud. My solution is to nibble. If it breaks hard in my direction, I'll scale in. If not, I'll get a little taken off the sides.
Invalidation: For me, a return into the channel and into the cloud is an absolute deal breaker.
Context: GPK is facing major headwinds in terms of persistent input cost inflation, overcapacity and pricing pressure, weakening consumer demand, high financial leverage and credit downgrades, and expensive operational restructuring.
Yeah, I'll give this one a nibble.
If you'd like to learn more about Ichimoku as a complete system based on Wave Theory, Price Theory and Time Theory, check out my new book on Amazon entitled--appropriately enough--Ichimoku: The Holistic System.  Short
Short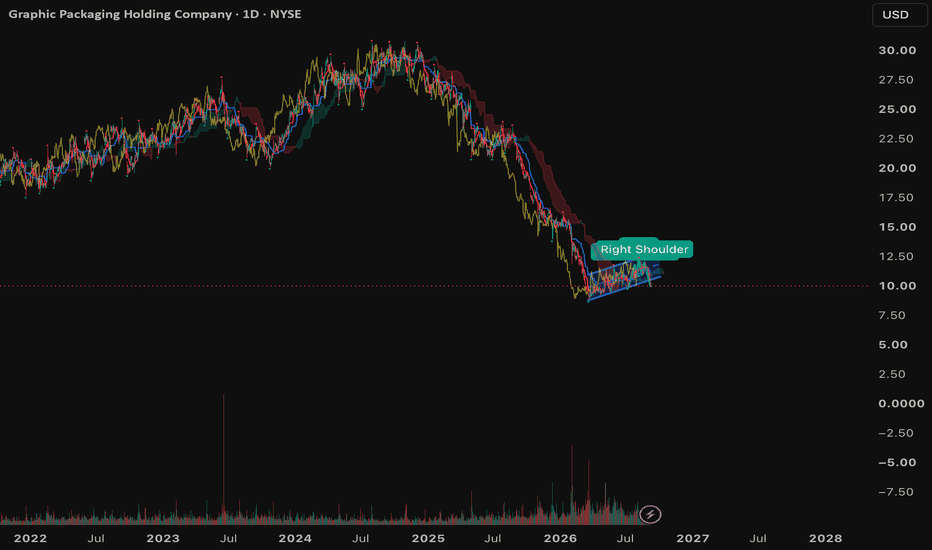
 Long
Long