Long
Long
CPNG | Bearish Until the Protected High BreaksBy analyzing the #CPNG (Coupang, Inc.) chart on the Daily timeframe, we can see a year-long bearish structure that has just broken down again, with three untouched pools of sell-side liquidity beneath and one level that decides whether any of it reverses.
━━━━━━━━━━━━━━━━━━━━
DAILY TIMEFRAME
━━━━━━━━━━━━━━━━━━━━
The turn came in November with the MSS — the August swing low broke and the bullish structure ended. Three separate BMS events have printed since: through $22.25 in December, near $17.00 in February, and through $15.00 in September. Each one came after a consolidation that looked like a base and was not one.
Price now sits at $14.40 , directly beneath the latest break and at the low of the visible range.
━━━━━━━━━━━━━━━━━━━━
THE LIQUIDITY BELOW
━━━━━━━━━━━━━━━━━━━━
SSL 1 — $12.61
SSL 2 — $10.46
SSL 3 — $8.97
Nothing has traded into them. A low that has never been defended isn't support, it's a target.
━━━━━━━━━━━━━━━━━━━━
THE LEVEL THAT DECIDES
━━━━━━━━━━━━━━━━━━━━
Protected High — $19.58
The high the sellers defended in July. Below it the bearish structure is intact. Above it on a daily close, it breaks for the first time since November.
━━━━━━━━━━━━━━━━━━━━
SCENARIO A — THE BASE CASE
━━━━━━━━━━━━━━━━━━━━
Price works through the sell-side pools in sequence — $12.61 , then $10.46 , then $8.97 . This stays the higher-probability path for as long as price trades under $19.58 .
━━━━━━━━━━━━━━━━━━━━
SCENARIO B — THE STRUCTURE BREAKS
━━━━━━━━━━━━━━━━━━━━
A daily close above the Protected High at $19.58 is the first bullish break in ten months, and above it the buy-side liquidity is stacked with nothing in between:
BSL 1 — $22.25
BSL 2 — $25.34
BSL 3 — $28.47
BSL 4 — $32.35
Four highs, none revisited since they formed. That is the size of the move a confirmed break opens — which is why it requires the close, not the approach.
━━━━━━━━━━━━━━━━━━━━
INVALIDATION
━━━━━━━━━━━━━━━━━━━━
A daily close above $19.58 . The bearish case ends there, not before.
And the rule that governs all of it: a break is a candle close, not a wick. The Protected High has been untouched for two months, which means it holds every stop from every short taken since July — and that is precisely the fuel a false break runs on.
━━━━━━━━━━━━━━━━━━━━
FUNDAMENTAL BACKDROP
━━━━━━━━━━━━━━━━━━━━
Q2 2026 swung from a $32 million profit to a $570 million loss , driven by $410 million in Korean regulatory fines . Adjusted EBITDA fell to $163 million from $428 million , and the Developing Offerings segment is guided to lose $950 million to $1 billion this year. The stock is at its 52-week low with market cap down 56.2% .
The other side: the business is still growing. Constant-currency revenue rose 10% , active customers reached 24.7 million , and retained customers are spending roughly 16% more year over year.
The fines are one-time; the customer loss and the FX drag are not, and the market is pricing the recovery as a 2027 story. Which is why the structure hasn't turned. The fundamentals give a reason for $19.58 to eventually break — not a reason to buy before it does.
This analysis will be updated as the market evolves.
Best Regards, BigBeluga 🐳 9/16/26 - $sbet - status check 1 2 1 2 9/16/26 :: VROCKSTAR :: NASDAQ:SBET
status check 1 2 1 2
- Kubuki day in the land of Oz
- the reality is that the bottom of the K is reKt the top is Klowin'
- where does that put markets? probably chop or modest risk off as rates slightly higher, but step back
- the USD remains v strong, US markets v strong, oil is the blood of their gawd etc. etc. and ultimately AI DGAF about rates when the banker DCF says mid teens return is easy money and it provides >100% of growth in a dead economy
- but honestly not great for consumer disc. still rekt. NKE is going to continue the drowning man syndrome and it means being v selective on shoe or consumer generally
- high rates r not good for bottom of K. great for top of K. oil higher helps... nobody. beware.
- lots more to say on this topic, but b/c you know i'm an ETH bull and like SBET i figured i'd rant here on that first, we can get into SBET and my portfolio update, long overdue.
SBET
- 85% below spot. *smacks lips*
- so is $2k eth a bargain in rising rate environment if/does BTC re-test low $60k's and most people don't understand they are dramatically different assets? .... well in the ST... beware, but LT $2k is great
- so while i'd been trimming highs... i started adding back today
- I went from >60% position to about 25% into this week
- and now... i'm back at high 30s.
- comment below if you wanna chat ETH.
- SBET now my largest position.
Others
- 35% SBET
- 20% NU
- 15% VST (w/ ATM covered calls)
- 12.5% NXT (w/ 5% OTM covered calls)
- 7% UBER (w/ 2-3% ITM covered calls)
- 5% DECK (w/ 5% OTM covered calls)
- 2.5% GRAB
- 2.5% WIFI (w/ ATM covered calls)
- 2% XPEL (which i've not written up ;) ... more to come)
- closed a lot of my ST NASDAQ:CRWD short today into announcement, remain w/ some $250P, $240P through next few weeks about 5% gross.
- a few of the positions are leveraged (two in fact, SBET is 1.5x, NU is about 1.8x), so that leaves me w/ about 15% cash buffer.
I swapped some NU (which coming into the day was my largest position) into SBET calls. Reality is, it's just a kelly exercise. I think both have 30-40% drawdown potential in the 3-6mo timeframe, but I don't see NU doing a 3-5x in the coming 1.5-2Y (where as my realistic target for ETH this cycle is $8k with $5k at the low-end). So just framing the opportunity according to up/downside to keep it simple.
we'll talk more on tax loss harvesting season (which this year will be particularly gnarly). building watchlist on that now. i prefer to have fewer positions, hedged positions (for income i.e. the covered call strategy on names I know well which > cash) and a little cash buffer.
happy to respond to comments. remember keep that head screwed on, emotions play no part in our process. neither do made up price targets that come to you in dreams. play the long game. we got this :)
V
 Long
Long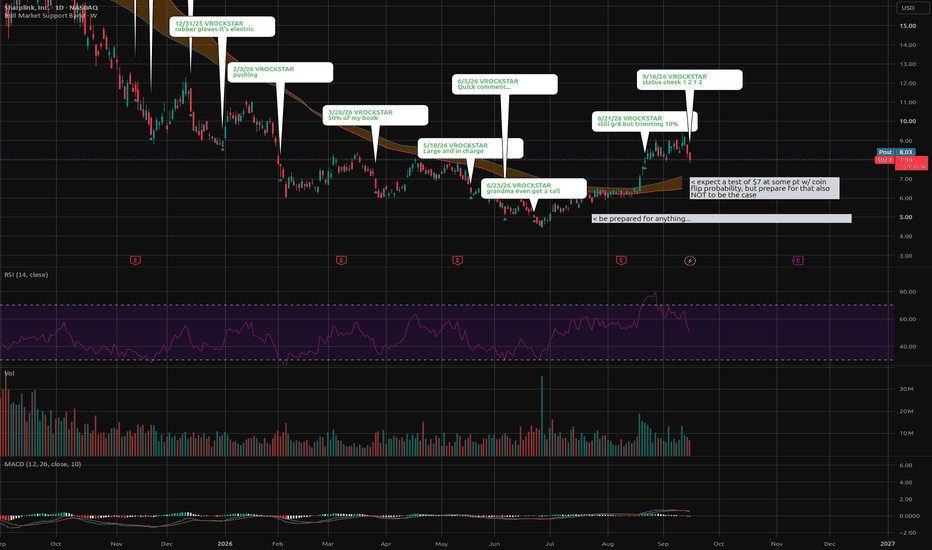
 Short
Short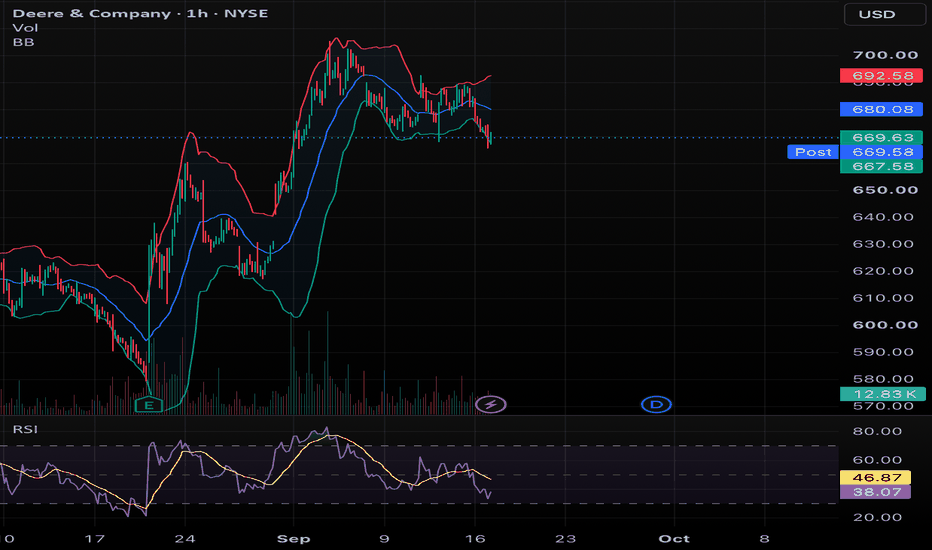
 Long
Long
 Long
Long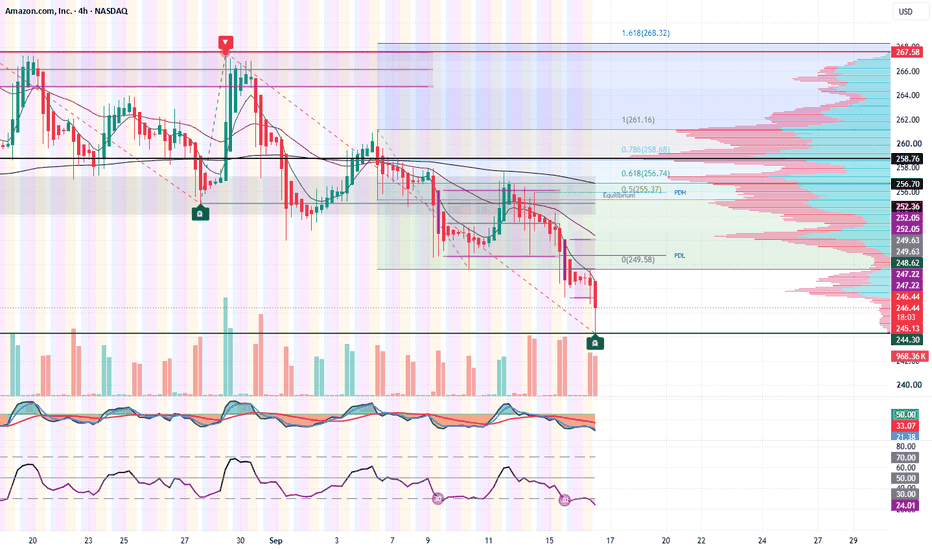
 Long
Long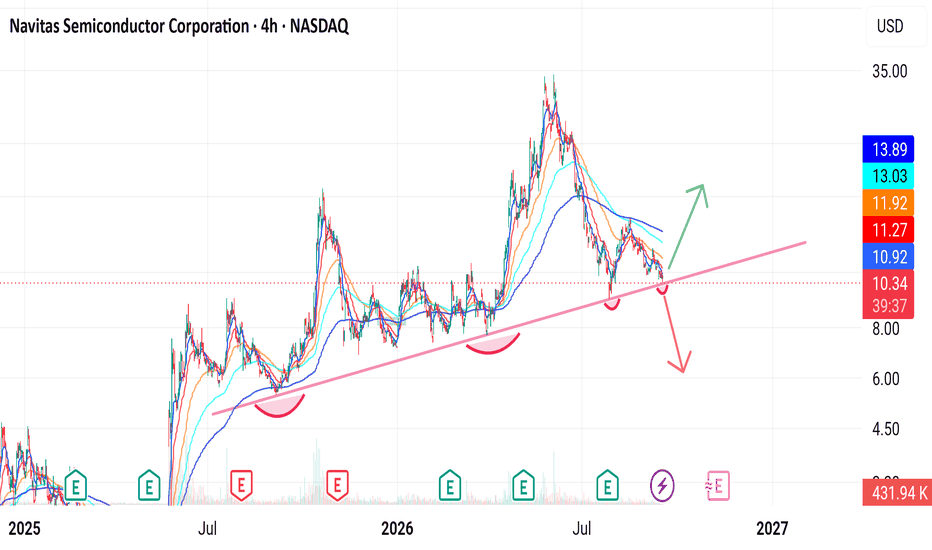
MercadoLibre (MELI 1H): Bullish Divergences & Channel FloorTitle: MercadoLibre (MELI 1H): Bullish Divergences & Channel Floor — Preparing for 18% Breakout 🟡⚡
🧠 Fundamental Overview (September 2026 Context):
MercadoLibre (NASDAQ: MELI) has recently seen a 12–13% pullback, trading down near the $1,830–$1,845 USD level as the market continues to price in near-term margin trade-offs:
Ecosystem & Merchant Scale: In mid-September, the company held its massive Mercado Libre Experience 2026 at La Rural, gathering over 8,000 sellers and enterprises. Over 2.7 million SMEs now operate within the MELI ecosystem, with nearly half generating their primary source of income through the platform.
Growth vs. Margins Dynamics: Following record Q2 revenue surpassing $10.17 Billion (+50% YoY), operating income faced temporary compression (6.7% EBIT margin) due to deliberate, aggressive investments in free shipping across Brazil and a 75% expansion of its credit portfolio (exceeding $16 Billion).
Valuation Pullback: The recent retreat from the $2,050 zone brings MELI’s trailing P/E down below 50x (well below its historical 5-year median of ~75x), offering a historically attractive discount for long-term compounders ahead of its expected Q3 earnings on November 4, 2026 .
📊 Technical Breakdown (1H Timeframe):
Zooming into the hourly chart, the market structure presents a high-probability mean-reversion setup inside a broader ascending channel:
1️⃣ Macro Ascending Channel (Trendline A & D):
Price has been developing inside a dominant multi-month ascending channel formed by upper Trendline A and lower floor Trendline D . After testing the upper boundary in the $2,050–$2,060 region, the asset underwent a clean 12–13% corrective slide down to the $1,804 USD low.
2️⃣ Trendline B Support Reaction:
The recent bounce emerged cleanly off Trendline B —a historical inflection level that has repeatedly alternated as both support and resistance. Had this level failed, the ultimate floor sat immediately below at Trendline D .
3️⃣ The Immediate Ceiling: Trendline C & Moving Averages:
Price action is now confronting descending Trendline C , a short-term diagonal resistance formed since early September. Directly above it sits a dual resistance cluster:
50-hour EMA ($1,886.07 USD)
200-hour EMA ($1,897.19 USD)
These moving averages recently printed a bearish cross, meaning reclaiming this entire $1,886–$1,900 pocket is the primary objective for bulls.
4️⃣ Confluent Bullish Divergences (MACD & RSI):
The rebound off Trendline B is heavily backed by leading indicators:
RSI (14): Rebounding out of deeply oversold territory (sub-30) and printing clear higher lows (bullish divergence).
MACD (12, 26, 9): Exhibiting an identical pattern—while price carved out lower lows toward $1,804, the MACD histogram and signal lines printed pronounced higher lows, signaling aggressive exhaustion among sellers.
🎯 Conclusion & Trading Playbook:
A confirmed breakout above the immediate diagonal and moving-average ceiling paves the way for a powerful continuation toward the upper boundary of the channel, offering a potential +17% to +18% upside expansion.
The Setup: Wait for a decisive 1H close above descending Trendline C and a reclaim of both the 50 and 200 EMAs ($1,890–$1,900 USD) .
Stop Loss (SL): Placed strictly below the recent swing low at $1,802 USD .
Target (TP): $2,150 – $2,200 USD (Retest and expansion into the upper boundary of Trendline A).
Risk-to-Reward (R:R): With roughly $90 of defined risk against a potential $260–$300 gain, this setup commands an exceptional 5:1 to 6:1 R:R.
Are you waiting for the 200 EMA reclaim, or already bidding the Trendline B bounce? Share your thoughts below! 👇
⚠️ Disclaimer: This analysis is strictly for educational purposes and intended solely to intellectually enrich our trading community. It does NOT constitute financial or investment advice. Always perform your own research and manage your risk strictly.  Long
Long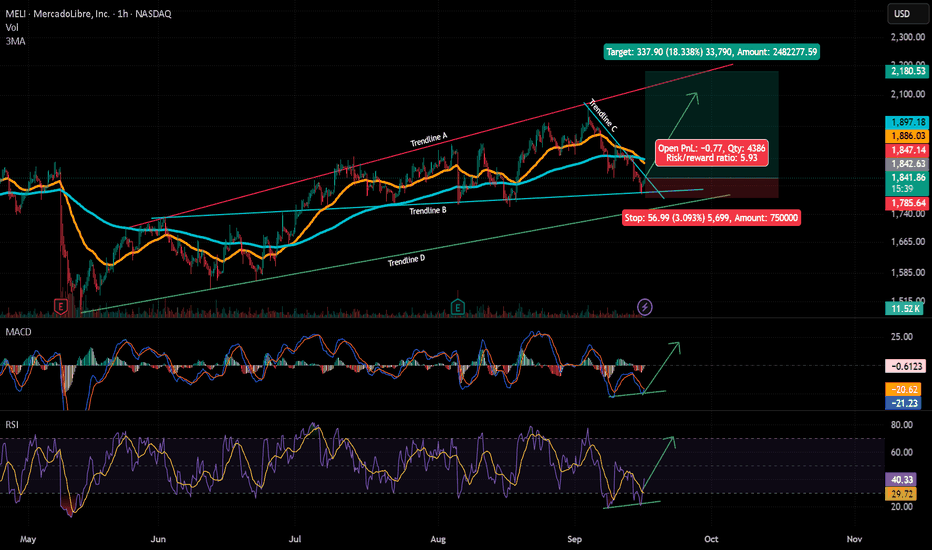
CoStar Group (CSGP): TA Review - Sellers Continue to push. Good Afternoon,
Hope all is well. Here is my TA on CSGP.
What I’m Seeing
Looking at CoStar Group on the weekly chart, the primary trend is still clearly bearish. Price has fallen from roughly $95–$100 to around $31, remains below a declining weekly trend/average, and has not yet established a confirmed higher-high/higher-low sequence.
But I think the character of the decline is beginning to change.
The first major breakdown came with a cluster of high-volume selling around $60–$70. That selling produced a substantial move lower.
The next leg down toward roughly $40–$45 occurred on noticeably less volume.
Then, as price reached the $27–$32 area, volume increased again—but instead of accelerating dramatically lower, price began consolidating.
That's the relationship I'm interested in:
heavy selling → large downside result → declining participation → final high-volume event → much less downside progress.
To me, this could be transitioning from markdown toward seller exhaustion and potential accumulation.
The Original High-Volume Cluster Looks Like Distribution
The cluster you've marked around approximately $58–$68 looks important.
Price was already below the declining weekly trend, several high-volume events appeared, and then support failed.
In hindsight, I would interpret that area more as distribution / aggressive liquidation than accumulation.
The key evidence is what happened afterward: price accepted materially lower levels.
That's very different from what I'm beginning to see near $30.
The Volume Progression Is Changing
The next stage is particularly interesting.
After the initial high-volume breakdown, CSGP continued declining—but volume decreased while price continued lower.
That tells me the downtrend remained intact, but participation wasn't necessarily increasing with every new low.
Then another high-volume event appeared around the low-$30s.
This time, instead of immediately collapsing toward $20, price began moving sideways.
That's potentially an effort-versus-result divergence:
more selling effort + less bearish price progress.
It doesn't prove institutional accumulation. But it tells me supply may be getting absorbed more effectively than it was earlier in the decline.
$27–$32 Is My Decision Zone
This is now the most important area on the chart for me.
Price has spent several months around approximately $27–$32, and the lows have so far stopped extending materially downward.
I'd describe this as a potential accumulation zone, rather than confirmed accumulation.
What I want to see now is time.
If CSGP continues trading around this region while volatility contracts, downside volume fades and momentum improves, the base becomes increasingly credible.
The ideal next sequence would be:
$27–$30 holds → higher low → $33–$35 reclaimed → expansion.
Momentum Turning Positive Matters
Your annotation that the daily momentum measure has turned positive for the first time since August 2025 is one of the more constructive signals on the chart.
For most of this decline, price and momentum were confirming each other.
Now price remains near the lows while momentum is improving.
Combined with your observation that the negative directional component has moved beneath the broader directional/trend measure, I'd interpret your indicators as showing that bearish pressure is weakening.
But there's an important distinction:
sellers losing control ≠ buyers controlling the trend.
I think we're potentially seeing the first part.
I still need price to prove the second.
$33–$35 Is My First Confirmation
At approximately $31, CSGP is still inside the bottoming structure.
My first meaningful confirmation would be a sustained move through approximately $33–$35.
That would push price out of the immediate consolidation and remove a recent swing-high area.
Then I want to see what happens on the pullback.
My ideal structure would be:
$27–$32 base → $35 breakout → controlled pullback → ~$30–$32 holds → higher low → continuation.
That would look substantially different from every previous bounce during this decline.
$40–$45 Is the Bigger Test
Above the initial breakout, $40–$45 becomes much more important.
That's where the previous breakdown accelerated and where trapped supply is likely to exist.
It's also where the declining weekly trend/average is heading.
So I'd roughly map the recovery as:
$27–$32 → $33–$35 → $40–$45 → $50+
A reclaim of $40–$45 followed by a higher low would be much stronger evidence that I'm dealing with a genuine weekly reversal rather than simply an oversold bounce.
Fundamentals — This Is Where CoStar Gets Interesting
Fundamentally, CoStar doesn't look like a company whose core business is collapsing.
In Q2 2026, revenue reached $925 million, up 18% year over year. Net income increased to $55 million from $6 million, while adjusted EBITDA rose 116% to $184 million. Adjusted EPS increased 88% to $0.32.
Management also described Q2 as its 61st consecutive quarter of double-digit revenue growth.
That's an important contrast with the chart:
share price ↓ dramatically
while
revenue and adjusted profitability ↑.
That doesn't automatically make the stock undervalued—valuation compression can happen even when a business grows—but it makes this potential technical bottom more interesting to me.
Residential Is Starting to Improve
One of the biggest questions around CoStar has been how much money it would need to invest in its residential strategy, particularly Homes.com.
There are signs that economics are beginning to improve.
In Q2, CoStar's residential revenue increased 33% year over year to $444 million, and the residential segment produced positive adjusted EBITDA for the quarter.
Earlier this year, management also said it intended to reduce the net investment in Homes.com by more than $300 million in 2026, after roughly $850 million in 2025.
That's important to my thesis.
If CoStar can continue growing Homes.com while reducing the amount of capital required to support it, the market may begin looking differently at the residential business.
But Growth Expectations Have Moderated
There is still a legitimate reason for caution.
After Q2, management revised full-year 2026 revenue guidance to approximately $3.715–$3.755 billion, or about 15% year-over-year growth at the midpoint. Earlier in 2026, the company had been targeting $3.78–$3.82 billion and roughly 18% growth.
So I wouldn't describe everything as improving.
The market may be repricing CoStar for a combination of slower-than-previously-expected growth and questions about returns on its large residential investments.
The bullish counterargument is profitability: management maintained full-year adjusted EBITDA guidance of $780–$820 million, while Q2 adjusted EBITDA more than doubled year over year.
That creates an interesting fundamental tension:
growth expectations moderating + profitability improving.
The Zonda Acquisition Adds Another Growth Avenue
CoStar also recently completed its acquisition of Zonda, expanding further into new-home data, analytics and marketplaces.
Management sees potential to combine Zonda's housing and visualization capabilities with Matterport's spatial technology.
That's potentially attractive strategically, but acquisitions also create execution risk.
So I don't want to assume every new asset automatically creates value.
What I want to see over the next several quarters is straightforward:
continued revenue growth → residential profitability → stronger consolidated margins → disciplined integration.
If those occur while the stock establishes a technical bottom, the fundamental and technical stories begin reinforcing each other.
Why This Setup Interests Me
This is the disconnect I'm watching.
Technically:
distribution → high-volume breakdown → lower-volume continuation → high-volume selling near the lows → diminishing downside progress → improving momentum.
Fundamentally:
18% Q2 revenue growth → rapidly improving adjusted EBITDA → residential segment reaching positive adjusted EBITDA → continued investment in long-term growth.
So I'm not looking at a company where the stock fell because the underlying operation completely collapsed.
The question I'm asking is:
Has the stock's decline now discounted more deterioration than the operating results are actually showing?
Price has to answer that.
My Bullish Scenario
My preferred sequence would be:
$27–$32 base holds → momentum remains positive → $33–$35 reclaimed → controlled retest → higher low → $40–$45.
If CSGP subsequently reclaims the declining weekly trend and establishes support above it, I'd become considerably more constructive.
From there, $50–$55 would be the next meaningful recovery area, followed eventually by the prior distribution region around $60–$70.
I wouldn't jump directly to those targets. I want price to build the structure first.
My Bearish Scenario
The bearish scenario is straightforward.
If CSGP decisively loses approximately $27–$28, especially with renewed volume expansion and deteriorating momentum, I'd assume the base hasn't finished forming.
That would weaken the absorption thesis considerably.
I'd rather wait for another stabilization area than try to predict where the next low will occur.
My Bias
I'm cautiously constructive at these levels, but I don't think the reversal is confirmed yet.
The combination I like is:
high-volume distribution → declining selling participation → another high-volume event near the lows → limited downside follow-through → consolidation → momentum turning positive.
And unlike some turnaround charts, the underlying business is still generating double-digit revenue growth while adjusted profitability has improved sharply.
So for me:
$27–$32 = potential accumulation zone.
$33–$35 = first breakout confirmation.
$40–$45 = major trend test.
$50+ = stronger evidence of a larger recovery.
The biggest thing I'm watching now is whether high-volume selling around the lows continues producing less and less downside.
If it does—and price begins building higher lows before breaking $35—I think we'll have much stronger evidence that the long markdown is finally transitioning into a bottoming process rather than simply another pause in the decline.
Trade Safely
Enjoy!  Long
Long
Boston Scientific: Accumulation Developing?Good Afternoon,
Hope all is well. Here is my TA on Boston Scientific.
What I’m Seeing
Looking at Boston Scientific on the weekly chart, the dominant trend is still bearish. Price has fallen from roughly $105–$110 to $44, remains below a declining weekly trend/average, and has yet to establish a convincing sequence of higher highs and higher lows.
But the behavior of the decline is changing.
I've marked three significant selling events. Earlier in the decline, heavy volume produced substantial downside movement. More recently, additional selling has produced progressively less downside, while volume itself has begun to contract.
At the same time, my daily momentum has turned positive for the first time since November 2025, and the weekly negative directional component has weakened relative to the broader trend-strength measure.
To me, this potentially represents:
aggressive markdown → diminishing selling pressure → stabilization → potential accumulation.
The bottom isn't confirmed, but I think the $40–$45 region deserves attention.
The Volume Progression Is the Most Interesting Part
The first high-volume event occurred around $73–$75.
That didn't stop the decline. Sellers remained in control and price continued significantly lower.
The next major event occurred around $55–$58, again with increasing participation.
Then another occurred around $45–$48.
But look at the difference in price response.
The earlier selling generated large declines.
The later selling generated less additional downside.
That's exactly the relationship I'm interested in near the end of a prolonged markdown.
I'm essentially seeing:
large selling effort → progressively smaller bearish result.
That can indicate seller exhaustion or absorption.
It doesn't prove institutional accumulation—high volume can represent aggressive two-way trading—but if subsequent price action begins producing higher lows, the absorption thesis becomes much stronger.
The $40–$45 Area Is My Decision Zone
This is the most important area on the chart.
Price has spent several months around the low-to-mid $40s and, despite repeated selling pressure, has so far struggled to establish itself materially below this region.
That's a meaningful change from earlier in the decline.
Previously, support levels were temporary.
Price would stabilize, bounce slightly and then continue lower.
Now I'm starting to see time being spent at the lows.
That's potentially how a bottom begins.
So I wouldn't automatically call $40–$45 a buy zone.
I'd call it my observation / potential accumulation zone.
Daily Momentum Turning Positive Matters
Your annotation that daily momentum has turned positive for the first time since November 2025 is particularly interesting.
During most of this decline, momentum and price were aligned:
price ↓ + momentum ↓ = bearish confirmation.
Now that relationship is beginning to separate.
Price remains near its lows, but momentum is starting to improve.
That means I may be seeing a form of momentum divergence developing underneath the price action.
Again, divergence doesn't guarantee reversal.
But when I combine:
declining selling volume + reduced downside progress + improving momentum
I start becoming much more interested in the possibility that the downtrend is maturing.
The Weekly Signal Is Improving Too
Your weekly directional indicator observation strengthens that argument.
The negative directional component crossing underneath the weekly average directional index suggests, according to the way you're using the indicator, that bearish directional pressure is no longer behaving as strongly as it was earlier in the decline.
That's an important distinction.
It doesn't necessarily mean buyers have taken control.
It means sellers may be losing control.
Those are two different stages.
The transition I'm looking for is:
seller exhaustion → equilibrium → buyer control.
I think BSX may be somewhere between the first two.
The August Rally Was Useful Information
The rally from approximately $43 to $51–$52 was important even though it failed.
It showed that buyers can move price when selling pressure temporarily disappears.
But price couldn't sustain itself above $50 and subsequently returned toward the base.
That tells me the reversal isn't mature yet.
What happens on this retest matters much more than the original rally.
If price now holds approximately $42–$44 and subsequently creates another push toward $50, I may have the beginnings of:
low → rally → higher low → breakout.
That's the structural sequence I'm waiting for.
$50–$52 Is My First Major Confirmation
The immediate resistance area is approximately $49–$52.
That's where the August recovery failed.
So I don't become significantly more bullish simply because BSX moves from $44 to $47.
I want the market to prove it can remove the previous swing high.
Ideally:
$40–$45 base → $50–$52 breakout → controlled pullback → $46–$48 holds → continuation.
That would be the first meaningful change from the persistent lower-high structure.
$55–$60 Would Change the Character of the Chart
Above $52, I think $55–$60 becomes the next important area.
That's where one of your previous high-volume selling events occurred and where price accelerated downward.
If BSX can reclaim that region, I'd start viewing the chart very differently.
Instead of simply having a potential bottom, we'd potentially have:
base → higher low → higher high → trend recovery.
After that, the declining weekly average around the low/mid-$60s becomes the major longer-term test.
So my technical roadmap is approximately:
$40–$45 → $50–$52 → $55–$60 → $63–$67 weekly trend.
I want each level reclaimed before assuming the next.
Fundamentals — This Is Not a Broken Business
This is where BSX becomes particularly interesting.
Boston Scientific's Q2 2026 revenue was $5.44 billion, up 7.5% reported and 7.0% organically. GAAP EPS increased to $0.61 from $0.53, while adjusted EPS increased to $0.86 from $0.75. Cardiovascular organic sales grew 7.8%, while MedSurg grew 5.4%.
So unlike some of the distressed charts we've looked at, I'm not dealing with collapsing revenue.
The company is still growing.
That creates an interesting disconnect:
business growing → earnings growing → stock down roughly 60% from its highs.
That doesn't automatically make the stock cheap—the previous valuation may simply have been too high—but it does make me much more interested in what price is doing around these lows.
There Are Real Reasons for the Selloff
I wouldn't dismiss the bearish case, though.
Management lowered its full-year outlook after Q2. Adjusted EPS guidance fell from $3.34–$3.41 to $3.28–$3.32, while organic sales-growth guidance was reduced to 5–6%.
A major reason has been weaker-than-expected demand for the Watchman heart implant, along with increased competition in the U.S. electrophysiology market. Management indicated some of the Watchman pressure could continue into 2027.
So the market isn't repricing BSX for no reason.
Growth expectations have come down.
The question is whether the stock decline has now gone far beyond the deterioration in the underlying business.
And There's a New Short-Term Risk: The Cyberattack
This is important because it happened after the Q2 report.
On September 8, Boston Scientific said a cybersecurity incident discovered August 25 had disrupted global operations, including manufacturing and order processing.
The company said it is now unlikely to meet its previously issued Q3 and full-year 2026 sales and adjusted-profit guidance because of the disruption. Major manufacturing and distribution operations were recovering, but management couldn't yet quantify the full financial impact.
That's a significant near-term uncertainty.
And it may help explain why price has returned toward the lows even after the August rally.
The next major fundamental catalyst is therefore the October 28 Q3 report, when management expects to provide an updated outlook.
Why the Cyber Event Matters to My Technical Thesis
This is actually where price behavior becomes particularly useful.
BSX has just received another piece of legitimately negative news.
Yet price is still sitting around $44 rather than immediately collapsing through the previous lows.
I'm watching that closely.
If a stock receives increasingly negative headlines but stops making meaningful new lows, that's potentially evidence that the market has already discounted substantial bad news.
I wouldn't call that proof yet.
But if the cyberattack's financial consequences become clearer and BSX still holds the $40–$45 area, the support becomes much more meaningful to me.
The Product Pipeline Still Matters
The longer-term business hasn't stopped innovating either.
Boston Scientific's FARAPULSE pulsed-field ablation franchise remains an important cardiovascular growth platform. In Q2, its AVANT GUARD study met its safety and effectiveness endpoints and showed superiority over anti-arrhythmic drugs for the studied persistent atrial-fibrillation population. The company has also begun the pivotal FARADIGM trial for its FARAFLEX mapping and ablation catheter.
That matters because the long-term bull case isn't simply:
"the stock fell a lot."
It's:
the stock experienced severe multiple compression while the company continues growing and investing in important medical-device franchises.
If growth stabilizes after the current operational disruptions, that could eventually provide fundamental support for the technical bottom.
Why This Setup Interests Me
The technical and fundamental pictures are beginning to line up in an interesting way.
Technically:
heavy selling → lower lows → additional selling → less downside progress → declining volume → improving momentum → potential base.
Fundamentally:
continued revenue growth + EPS growth + strong product franchises
but also:
lower guidance + Watchman weakness + EP competition + cyber disruption.
That tells me this isn't a simple story.
The business remains healthy enough that I don't need to bet on corporate survival.
I mainly need to determine whether expectations have finally been reset low enough for price to stabilize.
My Bullish Scenario
My preferred sequence would be:
$40–$45 holds → selling volume continues declining → daily momentum remains constructive → $50–$52 reclaimed → higher low → $55–$60 breakout.
If that happens, the declining weekly trend around roughly $63–$67 becomes the major test.
A successful reclaim of that weekly trend would be the point where I'd start taking a larger reversal much more seriously.
Beyond there, I'd eventually watch the prior breakdown areas around $70–$75 and then $78–$80.
I don't need to predict a return to $100 today.
I want the market to build the staircase first.
My Bearish Scenario
The bearish scenario is straightforward.
If BSX loses approximately $40–$42, particularly with expanding volume and renewed negative momentum, my accumulation thesis weakens considerably.
I'd be especially cautious if that happened alongside a materially worse-than-expected cyberattack impact or another deterioration in underlying growth expectations.
That combination would tell me:
this isn't absorption yet—the market is still repricing the business.
I'd rather wait for another base than guess where the next low will occur.
My Bias
I'm cautiously constructive around $40–$45, but I don't think the weekly reversal has been confirmed yet.
What gets my attention is the combination of:
Repeated selling events producing progressively less downside
Volume beginning to contract near the lows
Daily momentum turning positive
Weekly bearish directional pressure weakening
Price spending more time around $40–$45 rather than immediately breaking lower
An underlying business that still generated 7% organic growth in Q2
Adjusted EPS that increased from $0.75 to $0.86 year over year
But I also have to respect the cyberattack, weaker Watchman trends and reduced growth expectations.
So for me:
$40–$45 = potential accumulation / decision zone.
$50–$52 = first structural confirmation.
$55–$60 = meaningful trend improvement.
$63–$67 = major weekly reversal test.
The key thing I'm watching now is effort versus result.
If sellers continue attacking the $40–$45 area but price refuses to move materially lower, while momentum continues improving, I'll become increasingly interested.
If buyers then push BSX through $50–$52 with stronger participation, I'll have much better evidence that what currently looks like seller exhaustion is actually beginning to transition into accumulation and a new recovery cycle.
Trade Safely
Enjoy!  Long
Long
 Long
Long
ADBE bullish viewHi everyone,
Following my discussion with ExpertTrader21, I wanted to share my bullish trend continuation thesis as an alternative perspective to his bearish outlook. As I mentioned under his trade idea, I see ADBE (Adobe) as both a short-term and a long-term bullish play.
1. Short-Term Trade Setup:Risk-to-Reward (RR): I've set up a short-term 3:1 RR ratio from the current price, targeting the previous swing high.Fib Extension Target: An even higher RR can be achieved by using the Fibonacci extension to project a potential Higher High at 324.7
2. High Timeframe (HTF) Framework:Pitchfork Analysis: Some of the lines on my chart belong to a high timeframe Pitchfork. You can clearly see how the price bounced perfectly off the lower boundary of the Pitchfork and has started its mean reversion process toward the median line.HTF AVWAP: I have anchored a second AVWAP on the higher timeframe (the red line). This serves as my macro target for a long-term position in Adobe at around $400, which nicely aligns with the Pitchfork's median line.
3. Daily Chart Confluences:Market Structure: The daily chart shows a clear Market Structure Shift, now forming Higher Highs and Higher Lows.Divergences & Support: My analysis is backed by multiple volume and RSI divergences at the bottom, alongside dynamic support from the anchored VWAP where the potential new bullish vector started.Volume Profile (VPVR): The Anchored Volume Profile on the right indicates we are testing a High Volume Node, acting as strong support. If this area holds, an intermediate target before the macro move would be around $350.
From a fundamental perspective, Adobe is a highly healthy company. The combination of strong business fundamentals, historically high free cash flow (FCF), and a record-low P/E ratio adds significant weight to my mean reversion thesis, signaling that the asset is deeply undervalued at current levels.
Any feedback is highly appreciated! Good luck, traders!  Long
Long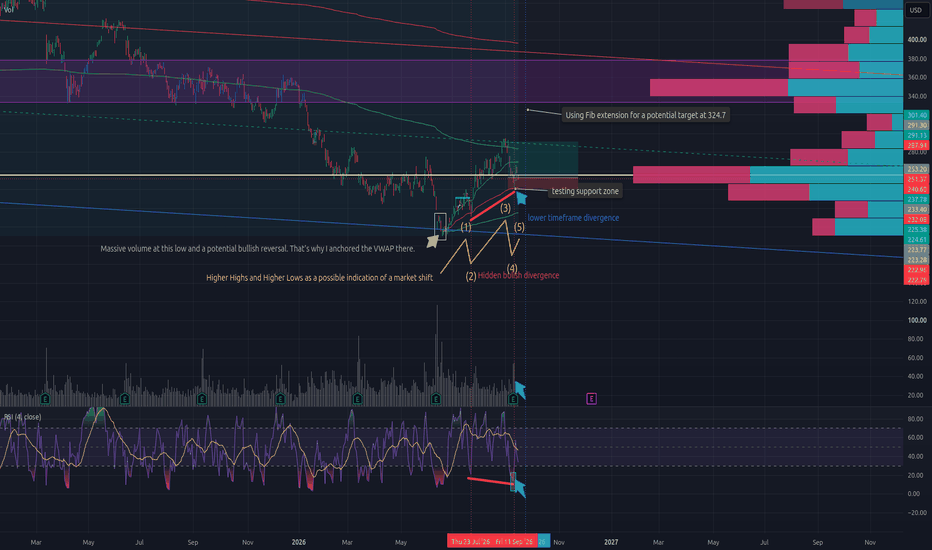
The Sport Trading Resembles MostThe US Open just finished and I spent a fair amount of time in front of it over the two weeks. Somewhere in the middle of that, an old question came back to me: if trading is like a sport, which one?
Boxing gets a lot of votes. You take damage, you keep standing, nobody can help you. Chess for the pattern recognition. Golf for the internal monologue. Motorsport for the risk management.
I'm going with tennis. Partly because I started playing at five and it's the sport I understand from the inside. But mostly because of something tennis does with its scoring, which I think is the more useful comparison.
Tennis
Tennis is an individual, performance-based sport. No defender to blame, no teammate to carry you, no substitution at half time. You and the scoreboard, for hours. Trading has the same structure and the same loneliness.
Same with the toolset. A player needs a serve, a backhand, a volley, movement, something to fall back on when the main weapon isn't working — and a trader assembles a comparable set of tools for trend, levels, ranges and volatility.
Both of those are real. Both are also shared with boxing and golf, so neither is what makes tennis the closest fit. That comes from the scoring.
Fifty-four percent
Roger Federer once told a graduating class that "In tennis, perfection is impossible," and then gave them the number behind it: across his career he won almost 80% of his matches, and only 54% of the points he played.
That speech got used heavily, usually for the mindset lesson — don't dwell on the last shot, move to the next one. Fair enough. What tends to get skipped is that the number isn't personal to Federer.
Nadal and Djokovic sit in the same place. More than 60 majors between the three of them, career win rates around four matches in five, and point-win rates all hovering a shade above half. Nobody in the recorded era has meaningfully exceeded it.
Three of the greatest careers the sport has produced, built on losing nearly every second point.
And it goes further than that. Roughly one ATP match in twenty is won by the player who won fewer total points. Not a rounding error — it happens throughout every season, including the 2019 Wimbledon final, where Djokovic beat Federer having won fewer points, 204 to 218, and fewer games, 32 to 36.
Tennis makes points unequal
That gap between 54% of points and 80% of matches isn't luck. It's architecture.
Tennis doesn't add points up. It bundles them. Four points make a game, six games make a set, two or three sets make a match — win by two at each level — and every bundle resets to zero when it closes. Win a set 7-6 and you carry nothing forward. Win it 6-0 and you carry exactly the same nothing forward.
Which means the same physical point is worth wildly different amounts depending on where it sits. A point at 40-0 on your own serve is nearly free. A point at 30-40 on your opponent's serve, second set, 4-5 down, is the match. Identical shot, identical effort, completely different consequence.
The scoring could have been built on total points won — simpler, and the better player would win more often. Whatever the origins of the system tennis actually uses, the effect is that when you perform matters more than how much.
One difference is worth naming before going further. A tennis player can see break point on the scoreboard — 30-40, second set, the stakes printed right there in front of them.
Traders get no such display. Every setup looks roughly like the others going in, and which one mattered only becomes clear afterwards. Same structure, with the useful information removed.
Which is exactly why it becomes a mental game
Djokovic put it plainly after a French Open semi-final years ago: at that level everyone is developed, committed and disciplined, and in the end it's mental determination that decides who wins.
At the top of the sport the physical gap between players is small. Everyone has the shots. What separates them is the handful of points where the scoring system has quietly raised the stakes.
There's an old line in tennis that you're always playing two opponents — the one across the net, and yourself. The scoring structure is what gives the second one its openings. Nothing much is at stake in a routine service game. It's 30-40 in the second set where the second opponent shows up.
Watch a professional at 40-0 and then watch the same player facing break point. The intensity isn't the same, and it isn't supposed to be. The serve goes to the pattern they trust most rather than the one that might win the point outright — the charting data shows players reaching for their most reliable delivery roughly twice as often on break points. The low-percentage winner attempt disappears. Some players visibly grow in those moments and some visibly shrink, and that difference has produced more careers and ended more of them than technique ever has.
Conceding a set
There's a tactic in tennis I don't think has an obvious equivalent anywhere else.
Watch a player at 0-5 down in a set. They stop chasing it. Risk goes up on the returns because there's nothing left to protect, the shots get looser, and the mind has already moved to the next set. A shirt change, a slow walk, a bathroom break. The set is treated as spent.
From the outside it looks like giving up. It isn't. It's a calculation about energy — the set is gone, and whatever gets spent fighting for it won't be available twenty minutes later when the score is level again.
The trading version is closing before the stop is hit, because the reason for the trade stopped existing. Not every exit has to be forced by the market.
And here's why conceding is available as a tactic at all: losing a set 0-6 costs exactly one set. Losing 6-7 after two hours of tennis also costs exactly one set. You cannot lose more of a set than one set, no matter how badly it goes.
The scoring system is a stop loss written into the rules of the game. That's why a player can be dismantled in the first set and still win in four — and why a 54% point-win rate produces three of the greatest careers ever instead of a wipeout.
A tennis player only needs to protect the sets. A trader, unable to tell which position was the important one, has to protect all of them.
What does carry over
I'd be overstating it if I said the damage stays inside the set. It doesn't.
Get taken apart 6-1 and something travels into the next one. The doubt. The sense that your opponent has your number. A small hesitation on a shot you'd normally hit without thinking. The scoreboard resets automatically. The head doesn't.
That's the second opponent doing its work. The one across the net gets a rest between sets. The one in your head doesn't.
Traders know this from the far side of a losing streak. The account is down by a defined, survivable amount, exactly as planned. The person sitting in front of the screen is in worse shape than that number suggests, and starts reading the next setup through it.
And here trading is arguably harder than tennis, because the second opponent is the only one you have. The market isn't trying to beat you. It doesn't know you're there.
Where the comparison breaks
Two places, and both are worth stating.
Tennis caps the upside. Winning a set 6-0 earns exactly what winning 7-6 earns — all that extra dominance converts to nothing. Trading doesn't work that way. A trade allowed to run can return several times what a stopped-out trade cost, and that asymmetry simply isn't available to a tennis player.
The second one is bigger. Tennis has no mechanism for ruin. Lose a match and you lose a match. There is no version of the sport where one bad afternoon empties the bank account.
For that, you need a different sport. Years ago I put some hours (maybe too many) into a WRC rally game, and one run has stayed with me. Mexico. Fifteen stages driven cleanly, in contention for the win, everything managed. Then stage sixteen felt like the moment to press the pedal to the floor and go for the win — and the car went off a cliff. Fifteen stages of discipline erased in about four seconds.
So, which sport?
Tennis, for the structure. Unequal points, contained losses, a second opponent the scoring keeps inviting in, and a system honest enough to admit that winning more points and winning the match are two different things.
Rally for the warning about what the tennis analogy leaves out.
Thanks for reading 😊
Which sport would you pick — and what does it get right that tennis doesn't?  Education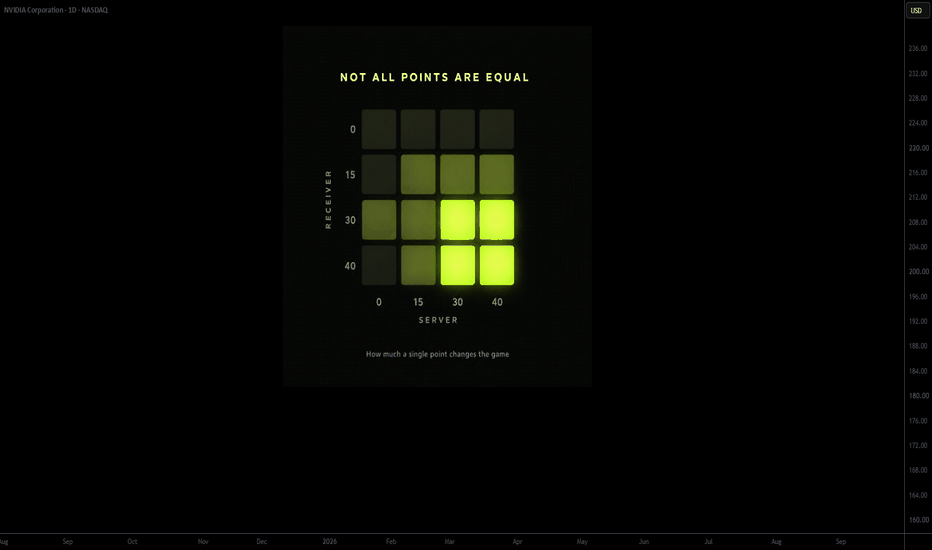
Oracle’s $664B Backlog: The AI Re-Rating Toward $250+Oracle has quietly become one of the most leveraged public-market bets on the AI infrastructure boom. Fiscal 2026 revenue reached a record $67.4 billion, with cloud infrastructure (IaaS) growing 77% to $18.1 billion; the first quarter of fiscal 2027 then accelerated further, with total revenue up 30% to $19.3 billion and IaaS more than doubling at +121% to $7.4 billion. Remaining performance obligations now sit at $664 billion—nearly ten times trailing annual revenue—after another $30-plus billion of AI contracts were booked in the latest quarter. Management guided fiscal 2027 revenue to at least $90 billion (roughly 34% growth) and non-GAAP EPS to $8.10, giving unusual visibility for a company of this size.
The core of the upside case is conversion of that backlog into recognized, high-utilization revenue as new megawatts come online. Oracle delivered 850 MW of capacity in Q1 alone and is targeting $90–95 billion of capex this year, yet a growing share of the hardware is prepaid or customer-supplied, which reduces the cash drain relative to earlier fears. GPU utilization is running near 98% with renewals occurring at premium pricing, and the OpenAI/Stargate-related commitment (on the order of $300 billion over roughly five years) is only the largest of several large-scale AI training and inference deals. If even a conservative portion of the contracted capacity ramps as planned, cloud infrastructure can become the majority of the company and support a multi-year revenue CAGR in the high-20s to low-30s, with operating leverage appearing once the current build-out cycle matures.
Risks remain real: heavy debt and equity issuance to fund data centers, customer concentration, and the possibility that AI spending growth slows or that power/grid constraints delay sites. Those concerns have already compressed the multiple and produced a large drawdown from the prior highs. Still, the combination of contracted revenue visibility, accelerating IaaS growth, and improving (if still negative) free-cash-flow optics versus earlier expectations is why longer-term models from some analysts point toward $200 billion-plus in revenue by the early 2030s and meaningful EPS compounding if margins on OCI settle in the 30–40% range once utilization and scale are achieved.
Technically, the 8-hour chart shows price sitting near the five-month point of control around current levels after a multi-month range, with a well-defined prior swing high near $250 and a higher target zone in the mid-to-high $200s if the stock can reclaim the $176 area and resume the prior uptrend. The financial trajectory—backlog conversion plus continued triple-digit IaaS growth—is what would most plausibly fuel that kind of re-rating; the chart simply maps the path price would need to travel if the fundamental story continues to deliver.  Long
Long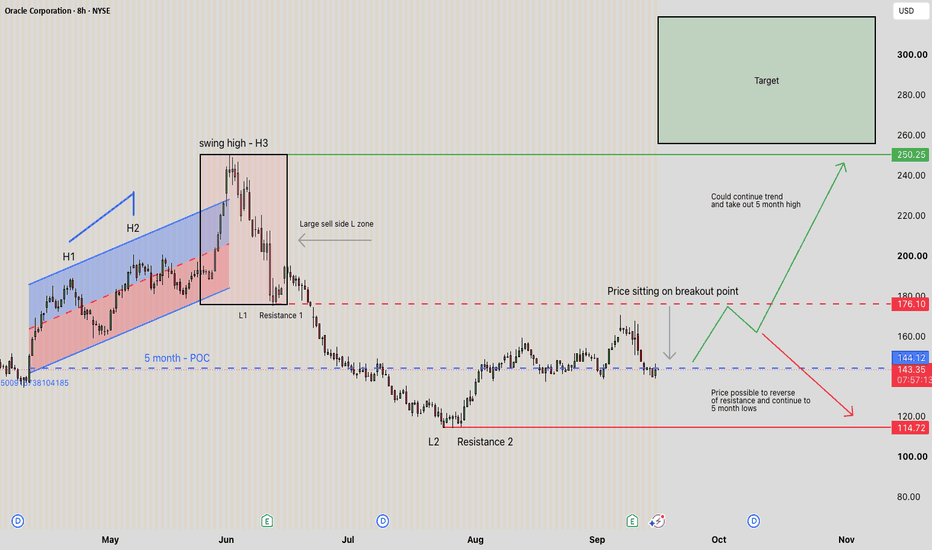
 Long
Long
 Long
Long
 Long
Long
 Long
Long
 Long
Long
Waste Management: Headed for our Target ZoneAs recently as Friday, Waste Management dipped to $213, but has since edged slightly higher. Overall, the stock remains on track and continues to target our green Target Zone on the downside ($205.67–$194.11). Primarily, we expect further near-term declines, which should ultimately bottom out within our green Target Zone. After that, we anticipate a resumption of the larger corrective advance, which should push WM up toward resistance at $262.75. Following this move, we expect another major sell-off phase. On the other hand, if resistance at $262.75 is broken in the near term, our alternative scenario could come into play. In this case, the larger wave count would already be further along, and the stock would be entering the final stage of the broader upward cycle (probability: 36%). Is Eli Lilly Pulling Back Into a Possible Area of Value?Weekly Support Back in Play
After reaching a fresh all-time high at $1,292.65, Eli Lilly has pulled back into the important weekly support zone around $1,100. This is an area we highlighted back in July as one to watch on any meaningful pullback.
Primary Trend Remains Strong
Price remains comfortably above the bullishly crossed 100/50-week EMAs. Both averages have supported the broader rise since 2018, keeping the primary trend firmly to the upside.
Selling Volume Is Decreasing
Volume has been falling as price pulls back towards support. For now, that suggests sellers are not becoming increasingly aggressive as LLY moves lower.
Bearish Divergence Still a Warning
There is bearish RSI divergence on both the weekly and daily timeframes. RSI does remain above 50, but the divergence means bulls should not completely dismiss the possibility of further weakness.
Momentum Is Oversold
StochRSI has now dropped into oversold territory. With price simultaneously testing weekly support, this is an interesting area to see whether buyers begin stepping back in.
What Bulls Need Next
A break above the end-of-August high at $1,188.33 would strengthen the case that the current pullback is ending. That would bring the recent highs and potentially the $1,292.65 all-time high back into focus.
In Summary
Eli Lilly has pulled back into the $1,100 weekly support zone after reaching a fresh all-time high, potentially offering an interesting area of value within the broader uptrend. The bullishly crossed 100/50-week EMAs remain supportive and selling volume is decreasing, although bearish RSI divergence still warrants some caution. If buyers step back in, a break above $1,188.33 would strengthen the case for the pullback ending and put the highs back in focus.