First Solar (FSLR)First Solar (FSLR): Pullback Creates an Attractive Entry Point
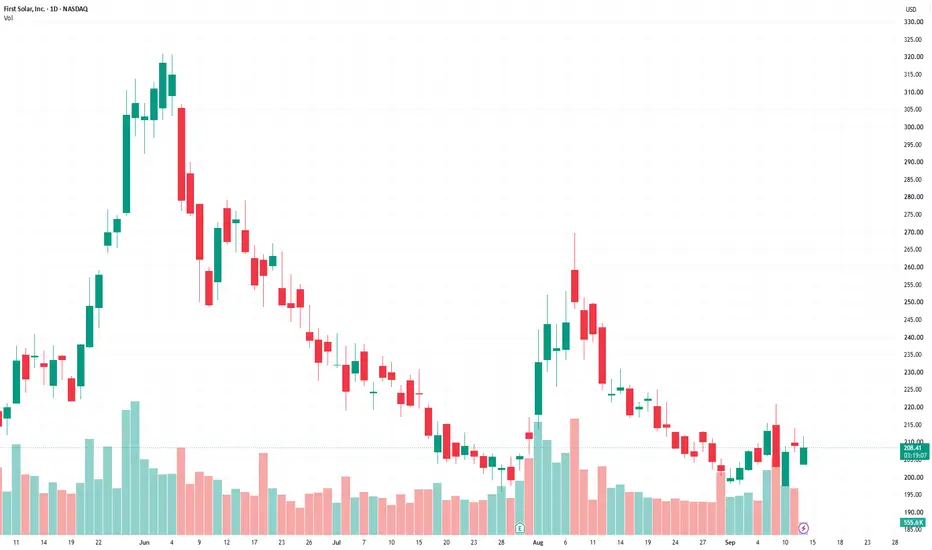
FSLR has fallen from its June high of $320.95 to around $210, while the company has maintained its 2026 guidance.
First Solar (FSLR)
Entry price in report: $210
Current price (September 11, 2026): $206.62
Target: $255
Stop-loss: $185
Horizon: November 9, 2026
Investment thesis
First Solar maintained its 2026 guidance after Q2 and continues expanding manufacturing capacity in the United States. The company also has a substantial contracted backlog extending through 2030, providing relatively strong visibility into future shipments and revenue.
Its competitive position remains differentiated by its cadmium telluride thin-film technology. Unlike most global solar manufacturers, First Solar is not dependent on the crystalline-silicon supply chain, a large part of which is concentrated in Asia. This technological difference has become increasingly important amid the expansion of U.S. manufacturing and stronger trade protection.
Q2 results remained strong. Revenue was approximately $1.06 billion, while net income rose to $423 million from $342 million a year earlier. EPS increased to $3.92 from $3.18, and adjusted EBITDA reached $644 million. First Solar maintained its full-year 2026 outlook for revenue of $4.9–5.2 billion and adjusted EBITDA of $2.6–2.8 billion.
The main issue remains the pace of new bookings. Backlog declined to 45.1 GW as of June 30, but after Q2 the company reported around 1.9 GW of new U.S. bookings, with more than 2 GW subject to conditions and roughly another 2 GW under active negotiations.
At around $210, FSLR trades at approximately 7.7x 2026 EV/EBITDA. The $255 target corresponds to roughly 9.5x 2026 EV/EBITDA and 7.8x 2027 EV/EBITDA.
Key catalyst: Q3 earnings expected in late October. The market will be watching new bookings and confirmation of full-year guidance.
Main risks: weaker new-order growth, changes in government support, international capacity utilization, and competition from lower-cost silicon modules.
Report recommendation: BUY  Long
Long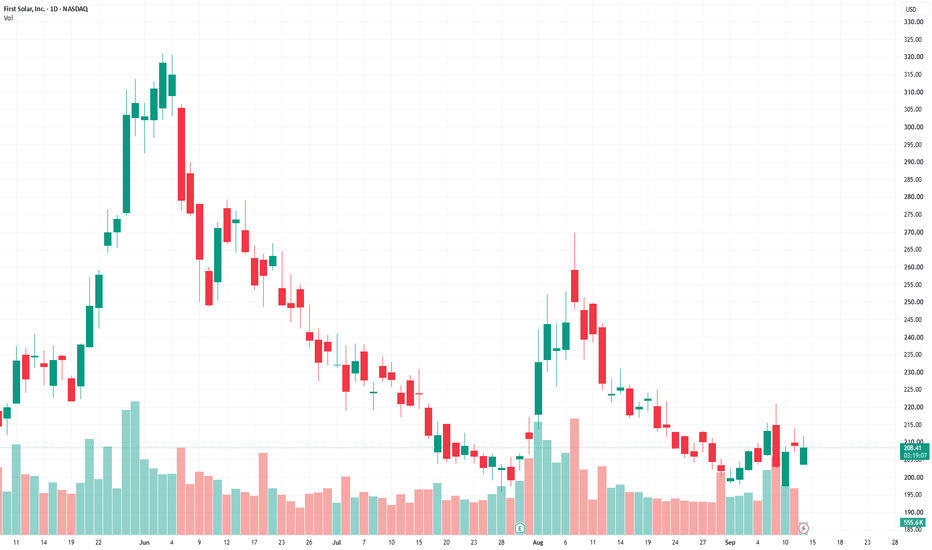
Energy Fuels (UUUU): Uranium LeaderEnergy Fuels (UUUU): Uranium Leader With a Rare Earths Growth Engine
Energy Fuels Inc. (UUUU)
Sector: Energy
Ticker: UUUU
Rating: Buy
Entry Price (at the time of analysis): $14.29
Target Price: $18.00
Stop-Loss: $11.80
Investment Horizon: Through November 3, 2026
From Uranium Producer to Rare Earths Leader
Energy Fuels combines its position as the largest U.S. uranium producer with a rapidly expanding role as a vertically integrated player in the rare earths market - a second growth engine that we believe remains underappreciated by the market.
After falling nearly 49% from its 52-week high of $27.90 to approximately $14.29, the stock is trading at a significant discount.
Uranium remains structurally undersupplied. The investment thesis for Energy Fuels is supported by the same macro drivers underpinning the broader uranium sector. Global electricity demand is expected to increase by 157% by 2050, while artificial intelligence and data centers are emerging as significant and rapidly growing sources of demand for nuclear power.
The World Nuclear Association has raised its base-case forecast for reactor uranium requirements from 175 million pounds of U3O8 in 2024 to 391 million pounds by 2040. Meanwhile, Sprott estimates that the cumulative uranium supply deficit could reach 1.25 billion pounds by 2045 under its base-case scenario.
U.S. policy provides an additional tailwind for domestic producers. A series of executive actions aimed at revitalizing the U.S. nuclear industry could result in additional domestic uranium demand equivalent to nearly twice current global production. As the largest uranium miner in the United States, Energy Fuels is positioned to be one of the direct beneficiaries of this policy shift.
Energy Fuels operates the White Mesa Mill in Utah, the only operating conventional uranium mill in the United States. This gives the company control over the entire value chain, from mining to finished uranium products.
In Q2 2026, the company mined 315,000 pounds of U3O8, bringing first-half production to 740,000 pounds. It also produced 865,000 pounds of finished U3O8 during the quarter, keeping it on track with its full-year processing guidance of 1.5–2.5 million pounds.
Production costs were approximately $23 per pound, a level analysts consider among the lowest for mined uranium producers globally.
The company’s financial position remains strong despite reporting a quarterly loss. Uranium sales revenue totaled $25.1 million in Q2, while the net loss widened to $33.6 million from $21.8 million a year earlier.
Management attributed the larger loss primarily to expenses related to the planned transactions involving Vacuumschmelze (VAC) and Australian Strategic Materials (ASM), rather than to any deterioration in the underlying business.
At the end of June, Energy Fuels had approximately $996 million in working capital, including $58.4 million in cash and $878.3 million in marketable securities. This provides substantial financial flexibility to fund growth without an immediate need to raise additional equity.
The Rare Earths Growth Opportunity
The second pillar of the investment thesis is Energy Fuels’ strategic expansion into rare earth elements, which are critical to permanent magnets used in electric vehicles, wind turbines, and defense applications.
Shareholders have approved the approximately $1.9 billion acquisition of VAC, which would add downstream magnet manufacturing capabilities. The acquisition of ASM was expected to close by the end of August 2026.
At the White Mesa Mill, construction has already begun on facilities designed to produce heavy rare earth oxides, with completion targeted for late 2027 or 2028.
The Donald Project joint venture provides access to monazite-based feedstock, strengthening the company’s upstream supply chain.
Another important milestone was Energy Fuels’ qualification as a supplier of terbium oxide to a major Japanese magnet manufacturer. This opens a pathway for the company to sell rare earth products directly to end users rather than remaining solely a supplier of raw materials.
Key Risks
The primary risk is execution.
Integrating the nearly $2 billion VAC acquisition while simultaneously completing the ASM transaction will require significant management attention and financial resources. Any delays or integration challenges could disappoint the market.
The company also continues to generate net losses. While current liquidity appears sufficient, further expansion could eventually require additional equity financing, creating dilution risk for existing shareholders.
Uranium prices remain a key driver of the core business. Rare earth pricing adds another source of revenue volatility, particularly given strong competition from China.
Finally, as with the broader uranium sector, any serious nuclear power plant accident could temporarily weigh on investor sentiment, regardless of Energy Fuels’ company-specific fundamentals.  Long
Long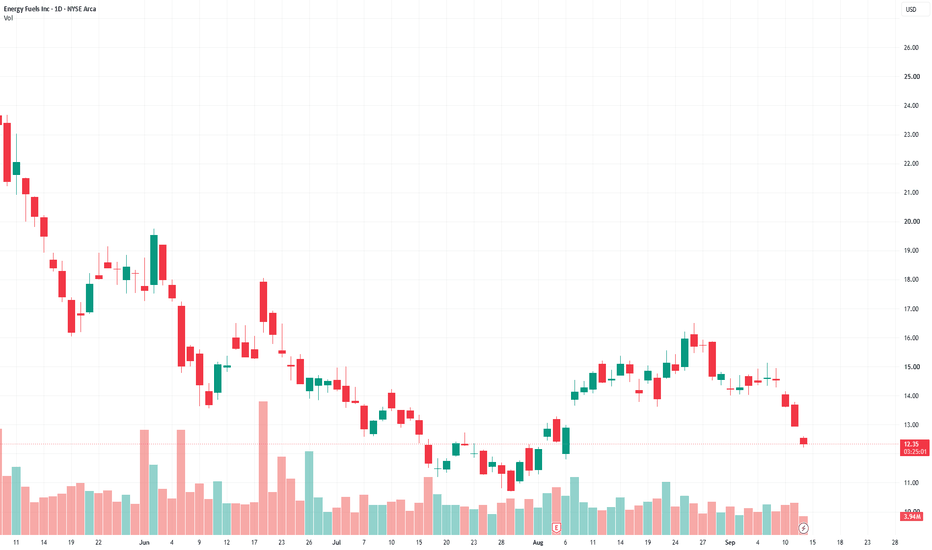
Is ORACLE About to Surprise on Earnings? The market has been quite choppy recently, largely due to fluctuations in Treasury yields and shifting expectations around the path of interest rates. Despite the broader uncertainty, the software sector has staged a meaningful recovery over the past few months. Oracle (ORCL), however, has continued to lag behind many of its peers and is currently trading near the lower end of its broader fair value range.
From a technical perspective, there are a few recent developments that make the current setup particularly interesting. ORCL swept the previous range low while simultaneously testing the range Value Area Low (VAL) — an area that has historically represented a discounted valuation zone for the stock over the past two years.
Since then, price has managed to reclaim the most traded zone highlighted in yellow, otherwise known as the Point of Control (POC). This is an important development, as acceptance back above the POC increases the probability of price rotating through the range toward the opposite side of the value range. In this case, that creates a potential path toward the Value Area High, which currently sits around the $195–$200 region.
Fundamentally, Oracle has also performed well over the last three quarters. If the company can maintain that momentum, the upcoming earnings report could serve as a catalyst for the stock to begin closing some of the performance gap between ORCL and the broader software sector.
At current levels, I like the risk-to-reward profile for a potential swing trade, with my primary target sitting around $195–$200. That area represents the first major upside objective and would be an important zone to reassess price action.
If ORCL can break through and establish acceptance above the $200 region, the setup becomes considerably more interesting. From there, I would be watching for a potential continuation toward the next major pivot around $250, followed ultimately by a possible retest of the all-time highs.
For now, the thesis is relatively straightforward: ORCL has swept the lower end of its range, tested an area of historical value, and reclaimed the Point of Control while the broader software sector continues to recover. The next step is seeing whether buyers can maintain that reclaim and begin pushing price toward the upper end of the range.
Let’s see how the setup develops over the next week!
 Long
Long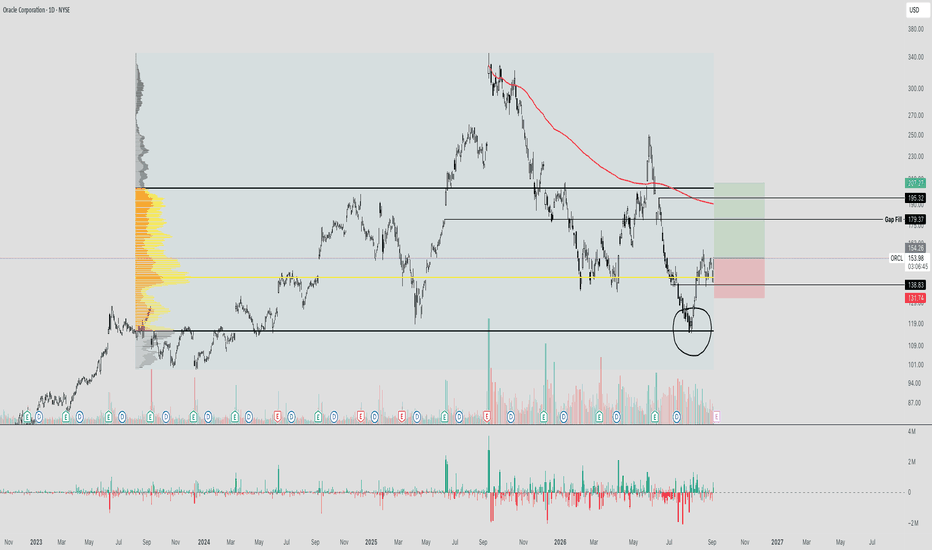
 Short
Short
$MSTR: Weekly Crossback + Daily BNB1 + 65m 3 Bar Play⚛️HTF Context 🔭
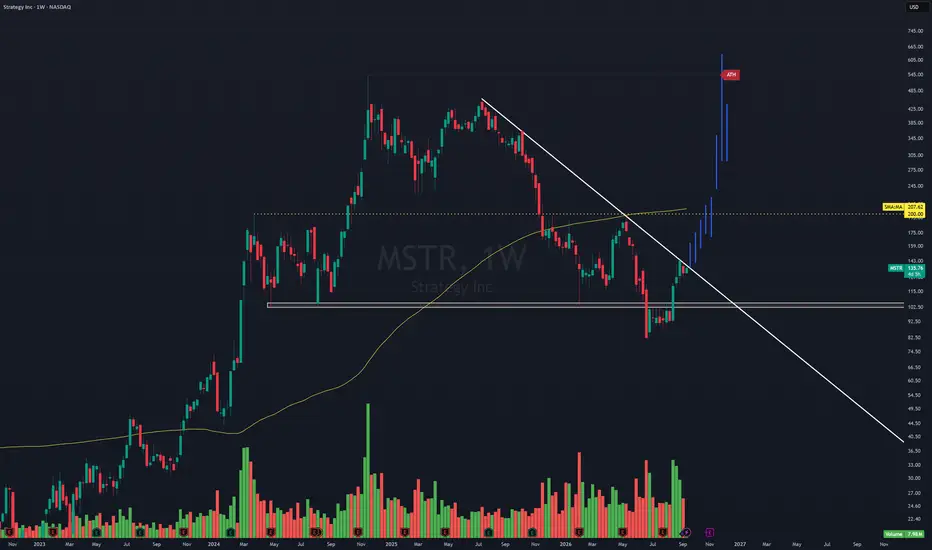
NASDAQ:MSTR is building constructive multi-timeframe continuation structure. On the Weekly chart, price has put in a Wedge Pop and is now working through a Crossback. That is the first meaningful pullback and retest phase after the impulsive move, and it can create a strong continuation location if support holds.
The Daily is beginning to form a BNB1, showing that price is consolidating rather than immediately giving back the prior expansion.
LTF Structure 🧱
On the 65m, price is tightening into a 4 Bar Play. This is the execution pattern I am focused on. A 4BP gives a defined compression range and a clear decision point for whether buyers are ready to resume control.
The cleaner scenario is a break above the 4BP high followed by acceptance, participation, and continued respect of the rising 65m structure.
Cycle Position ♻️
Weekly Wedge Pop → Crossback
Daily BNB1
65m 3 Bar Play compression
This is not about predicting. It is about waiting for lower-timeframe compression to confirm in alignment with the higher-timeframe structure.
Continuation Scenario 🟢
A clean break and hold above the 65m 4BP high would signal that the consolidation is resolving higher. Ideally, price expands from the range without immediately losing the breakout level.
Failure Scenario 🔴
The idea fails if price breaks the 4BP high, rejects, and accepts back into the pattern or loses the 65m higher-low structure. No acceptance above the trigger, no trade.
Execution Mindset 🎯
I am not chasing a candle. I am watching for Location → Compression → Confirmation.
Not financial advice. This is an educational market structure breakdown.  Long
Long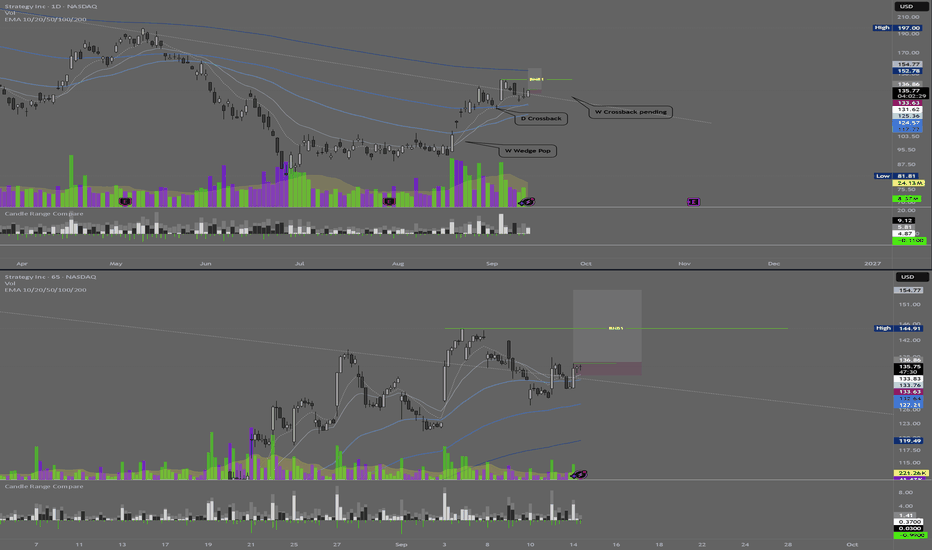
MRNA - Moderna, Inc.Moderna, Inc. engages in the development of transformative medicines based on messenger ribonucleic acid (mRNA). Its product pipeline includes the following modalities: prophylactic vaccines, cancer vaccines, intratumoral immuno-oncology, localized regenerative therapeutics, systemic secreted therapeutics, and systemic intracellular therapeutics. The company was founded by Noubar B. Afeyan, Robert S. Langer, Jr., Derrick J. Rose and Kenneth R. Chien in 2010 and is headquartered in Cambridge, MA. Long 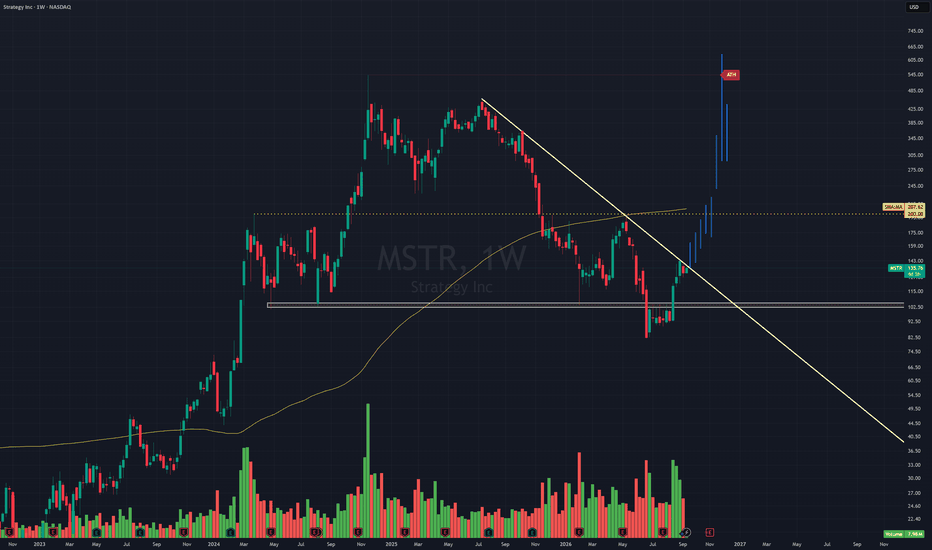
HIMS (Hims & Hers): Navigating Regulatory Friction
If you want a textbook example of explosive revenue growth colliding with heavy regulatory overhang, NYSE:HIMS is the chart to watch.
Looking at the 4-hour timeframe, the stock has suffered a brutal markdown from the $60 zone down to a capitulation bottom near $15. This was driven by a combination of a July 2026 FTC lawsuit regarding data privacy practices and an earlier FDA crackdown on compounded GLP-1 weight-loss drugs. However, the price is currently staging a fierce reversal, up 4.73% to $28.81, and successfully reclaiming the dynamic moving average.
The Fundamental Drivers & Moat
Despite the legal headlines, the underlying business is generating massive cash.
Surging Demand: Q2 2026 revenue hit $753 million, representing roughly 40% year-over-year growth. The platform boasts well over 2.5 million subscribers, validating their highly sticky, recurring revenue model.
The GLP-1 Pivot: After the FDA cracked down on compounded semaglutide, Hims pivoted strategically. They ceased promoting compounded GLP-1s and signed a direct distribution partnership with Novo Nordisk to sell branded Ozempic and Wegovy.
The Moat: Their competitive advantage is no longer just being a telehealth disruptor; it is their massive, locked-in distribution network. By transitioning to a certified distribution partner for Big Pharma, they act as the primary digital storefront for highly sought-after treatments, backed by a personalized care ecosystem.
The Technical Structure & Execution Plan
The chart shows a classic accumulation pattern following a capitulation event.
The Setup: The stock has established a solid floor in the low $20s and is currently pressing against local resistance in the $28.00 to $31.50 block. The moving average is curling upward, signaling a shift in near-term momentum.
The Trigger: I am looking for a confirmed 4-hour close above the $31.60 resistance level to signal a definitive structural breakout.
Price Targets: Once the $31.60 resistance is cleared, the immediate liquidity draw is the $36.70 zone. If the broader market absorbs the regulatory noise, the mid-term target is a gap-fill back to the $50.00 structural level shown on the chart.
Risk Management: Because this stock is highly sensitive to FTC and FDA news, keep a hard stop loss below the $25.40 support level.
Are you trading the technical reversal, or staying on the sidelines until the legal dust settles?
Follow us for more insights!  Long
Long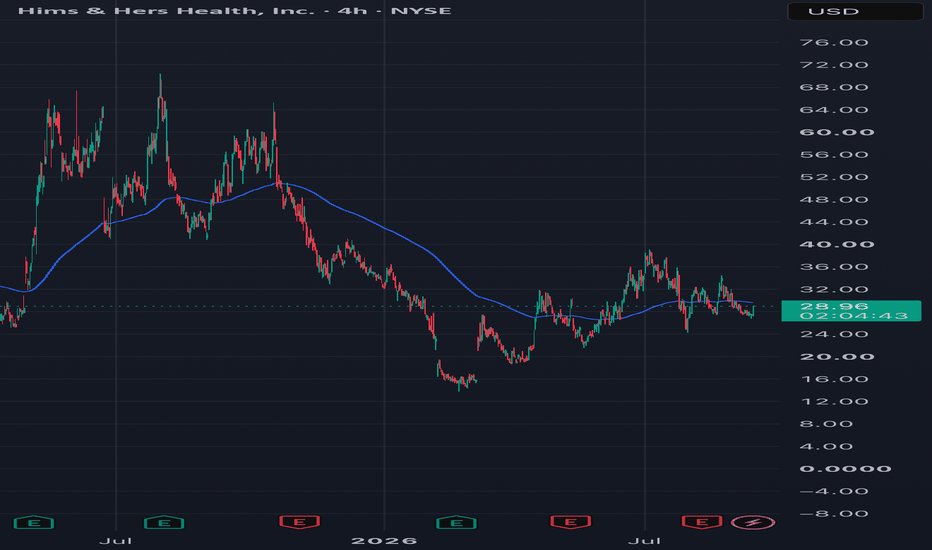
 Long
Long
 Long
Long
Long 
 Long
Long
 Short
Short
 Short
Short
 Long
Long
 Long
Long
 Short
Short
 Long
Long