Could Alphabet Start Moving Again?Alphabet has drifted for months, but some traders may think it’s ready to start moving again.
The first pattern on today’s chart is the long pullback since mid-May, which has seen the Internet giant bounce twice at its rising 200-day simple moving average (SMA). That may confirm a longer-term uptrend is in place.
Second, GOOGL is pushing above its 50-day SMA. That could suggest the intermediate-term trend is getting bullish again.
Third, MACD is rising and the 8-day exponential moving average (EMA) crossed above the 21-day EMA. That may indicate its short-term trend is also turning positive.
Next, Bollinger Band Width has narrowed as prices converge. Could that narrowing price action give way to expansion?
Finally, GOOGL is an active underlier in the options market. (Its average daily volume of 367,500 contracts ranks 11th in the S&P 500, according to TradeStation data.) That could help traders take positions with calls and puts.
TradeStation has, for decades, advanced the trading industry, providing access to stocks, options and futures. If you're born to trade, we could be for you. Learn more here about TradingView’s Broker of the Year!
Past performance, whether actual or indicated by historical tests of strategies, is no guarantee of future performance or success. There is a possibility that you may sustain a loss equal to or greater than your entire investment regardless of which asset class you trade (equities, options or futures); therefore, you should not invest or risk money that you cannot afford to lose. Online trading is not suitable for all investors. View the document titled Characteristics and Risks of Standardized Options at www.TradeStation.com . Before trading any asset class, customers must read the relevant risk disclosure statements on www.TradeStation.com . System access and trade placement and execution may be delayed or fail due to market volatility and volume, quote delays, system and software errors, Internet traffic, outages and other factors.
Securities and futures trading is offered to self-directed customers by TradeStation Securities, Inc., a broker-dealer registered with the Securities and Exchange Commission and a futures commission merchant licensed with the Commodity Futures Trading Commission). TradeStation Securities is a member of the Financial Industry Regulatory Authority, the National Futures Association, and a number of exchanges.
Options trading is not suitable for all investors. Your TradeStation Securities’ account application to trade options will be considered and approved or disapproved based on all relevant factors, including your trading experience. See www.TradeStation.com . Visit www.TradeStation.com for full details on the costs and fees associated with options.
Margin trading involves risks, and it is important that you fully understand those risks before trading on margin. The Margin Disclosure Statement outlines many of those risks, including that you can lose more funds than you deposit in your margin account; your brokerage firm can force the sale of securities in your account; your brokerage firm can sell your securities without contacting you; and you are not entitled to an extension of time on a margin call. Review the Margin Disclosure Statement at www.TradeStation.com .
TradeStation Securities, Inc. and TradeStation Technologies, Inc. are each wholly owned subsidiaries of TradeStation Group, Inc., both operating, and providing products and services, under the TradeStation brand and trademark. When applying for, or purchasing, accounts, subscriptions, products and services, it is important that you know which company you will be dealing with. Visit www.TradeStation.com for further important information explaining what this means.  Long
Long
 Long
Long
UWMC: Is the Downtrend Running Out of Sellers?Good Morning,
Hope all is well. Here is my TA on UWMC.
What I’m Seeing
Looking at UWM Holdings on the weekly chart, the primary trend is still decisively bearish. Price has fallen from roughly $8 in 2024 to around $1.29, remains well below a declining weekly trend/average, and continues to print lower highs and lower lows.
But there is one development that catches my attention: the relationship between bearish volume and price is starting to change.
Earlier high-volume selling around $4–$5 produced significant downside continuation. The next heavy-volume event around the low-$3s again pushed price materially lower.
More recently, however, I've marked what appears to be the strongest bearish-volume event of the decline near roughly $1.30–$1.60, yet price did not immediately follow through proportionally lower.
That's potentially significant.
I'm seeing:
increasing bearish effort → decreasing bearish result.
That can be an early sign of seller exhaustion or absorption—but I need more evidence before calling it accumulation.
The Volume Progression Is the Key
The first high-volume event around $4.00–$4.50 didn't stop the downtrend.
Another large selling event around $3.00–$3.30 also failed to create a durable bottom.
But the latest event is different.
Despite very heavy selling near the current lows, price has so far remained around the $1.20–$1.50 region instead of immediately accelerating toward $1 or below.
That's the first thing that makes me interested.
The question now becomes:
How much additional downside can sellers actually produce?
If volume remains elevated but price refuses to make meaningful new lows, the absorption thesis strengthens.
$1.20–$1.50 Is My Observation Zone
I wouldn't call this a confirmed accumulation zone yet.
I'd call approximately $1.20–$1.50 my observation zone.
The stock needs time to prove that buyers are actually willing to defend these levels.
Ideally, I want to see price stop trending vertically downward and begin moving sideways.
Something like:
selling climax → failed new low → consolidation → higher low → breakout.
Right now I may have the first two pieces developing.
I don't have the rest.
Bearish Momentum May Be Losing Strength
Your directional-indicator observation is also interesting.
Based on the way you're reading the indicator, the negative directional component moving beneath the broader directional/trend measure suggests bearish directional pressure is beginning to weaken.
At the same time, your longer-term volume trajectory appears to be rolling over.
That combination matters because bottoms generally don't begin when everything suddenly becomes bullish.
They often begin when the existing bearish trend simply stops becoming more bearish.
That's potentially what I'm seeing here.
$1.50–$1.60 Is My First Test
Before thinking about a major recovery, I want UWMC to prove it can reclaim nearby resistance.
Approximately $1.50–$1.60 would be my first area.
Then I'd watch $1.80–$2.00.
A move through $2 would be more meaningful because it would start taking out part of the recent lower-high structure.
My ideal sequence would be:
$1.20–$1.50 base → $1.60 breakout → higher low → $2 reclaim → continuation.
Until something like that develops, this remains a falling stock showing possible exhaustion—not a confirmed reversal.
$2.50–$3.00 Would Be the Bigger Structural Change
If the stock eventually gets above $2, I think $2.50–$3.00 becomes the first genuinely important recovery zone.
That's where previous support broke and where I would expect substantial overhead supply.
Above there, the declining weekly trend/average around the low-$3 area becomes the bigger test.
So my rough roadmap is:
$1.20–$1.50 → $1.60 → $2.00 → $2.50–$3.00 → weekly trend.
I wouldn't start projecting $5 or $6 from here.
UWMC has a lot of structural damage to repair first.
Fundamentals — There Are Real Reasons for This Decline
This is where I have to be much more careful with UWMC than some of the other bottoming charts.
Q2 2026 originations were $39.7 billion, essentially flat year over year but down from $44.9 billion in Q1. Revenue was $888 million, up from $758.7 million a year earlier. Gain margin also improved to 133 basis points, versus 113 bps in Q2 2025.
So the core mortgage operation is still producing substantial volume.
But earnings were extremely volatile. UWM reported a $451.9 million Q2 net loss, versus $314.5 million of net income a year earlier. Adjusted EBITDA was $185.9 million versus $195.7 million a year earlier. The reported loss was heavily affected by fair-value movements in mortgage-servicing rights and interest-rate derivatives, which makes the headline earnings number particularly noisy.
So this isn't simply:
business collapsing → stock collapsing.
The financial picture is more complicated.
The Dividend Suspension Is a Major Change
One fundamental development I would take seriously is UWM's decision to suspend its quarterly dividend after Q2.
Management said it wants a more disciplined capital-allocation approach and will continue evaluating future capital returns.
That's important because the dividend had historically been a meaningful part of the UWMC investment case.
Its removal can change the shareholder base and valuation framework.
It also tells me management currently sees greater value in preserving or redeploying capital than continuing the previous distribution.
That isn't automatically bearish or bullish—but it's a material change.
The Balance Sheet Deserves Attention
This is probably my biggest fundamental caution.
UWM reported approximately $6.04 billion of non-funding debt at June 30, up from $3.32 billion a year earlier, while total equity declined to approximately $985 million from $1.75 billion.
Its reported non-funding debt-to-equity ratio therefore increased from 1.90x to 6.13x.
At the same time, the company reported approximately $1.3 billion of available liquidity, including $498 million of cash.
So I don't interpret this as an immediate liquidity crisis from those figures alone.
But the leverage trajectory is something I would monitor closely.
For this technical bottom to become attractive fundamentally, I'd like to see the capital structure stabilize rather than continue deteriorating.
Mortgage Rates Are the Bigger Macro Problem
UWMC is also extremely sensitive to the U.S. mortgage environment.
And right now that environment remains difficult.
As of September 17, the average U.S. 30-year fixed mortgage rate had climbed to 6.95%, its highest level since January 2025.
A Reuters survey this week also found expectations for mortgage rates to remain elevated, with housing affordability continuing to suppress transaction volumes.
That matters directly to UWM.
Higher rates generally reduce refinancing incentives and can constrain home-purchase activity. So a sustained improvement in the mortgage market would be an important fundamental catalyst, while prolonged high rates remain a major risk.
There Is Still Operating Strength Underneath the Volatility
The positive side is that UWM remains a very large mortgage originator.
Q2 purchase originations were approximately $23.8 billion, up from $18.7 billion sequentially. Refinance volume was $15.9 billion, down sharply from Q1 but above $12.4 billion a year earlier.
The servicing portfolio also continued growing, reaching approximately $247.6 billion of unpaid principal balance, versus $211.2 billion a year earlier.
So the operating franchise hasn't disappeared.
The problem is the combination of mortgage-cycle pressure, earnings volatility, leverage and capital-allocation changes.
Why This Setup Interests Me
Technically I'm seeing:
high-volume selling → lower prices → more high-volume selling → further decline → strongest bearish-volume event → surprisingly limited immediate follow-through.
That's exactly where I start asking whether sellers are becoming exhausted.
But fundamentally, this one carries considerably more risk than a simple oversold quality-company setup.
The housing backdrop remains difficult, the dividend has been suspended, leverage has increased, and earnings are heavily influenced by servicing-right and derivative valuations.
So I need more confirmation from price.
My Bullish Scenario
The structure I'd want to see is:
$1.20–$1.50 holds → bearish volume declines → price stops making new lows → $1.60 reclaimed → higher low → $2 breakout.
If that happens, I'd start looking toward $2.50–$3.00.
A successful reclaim of the declining weekly trend after that would be much stronger evidence that this is transitioning from seller exhaustion into an actual recovery cycle.
My Bearish Scenario
This one has a very obvious risk.
If UWMC loses approximately $1.20 and begins accepting prices below it with expanding volume, then the latest high-volume event wasn't absorption—it was simply another stage of distribution.
A break beneath $1.00 would be particularly significant psychologically and structurally.
Fundamentally, I'd also become more cautious if leverage continues rising, liquidity deteriorates, origination economics weaken materially, or the housing market worsens further.
My Bias
I'm interested, but more cautious here than on some of the other potential bottoms we've looked at.
The technical signal that interests me is straightforward:
the largest bearish-volume event near the lows has so far produced surprisingly little additional downside.
That's worth watching.
But I don't want to confuse seller exhaustion with a completed bottom.
For me:
$1.20–$1.50 = observation / potential absorption zone.
$1.60 = first sign of improvement.
$2.00 = meaningful structural confirmation.
$2.50–$3.00 = major recovery test.
If sellers keep hitting this area with heavy volume and UWMC simply refuses to move materially lower, I'll become increasingly interested.
The signal I'd really want is for that selling pressure to dry up, price to establish a higher low, and then buyers to push through $1.60–$2.00.
That's when I'd have stronger evidence that seller exhaustion is actually turning into accumulation rather than just another temporary pause in a powerful downtrend.
Trade Safely
Enjoy!  Long
Long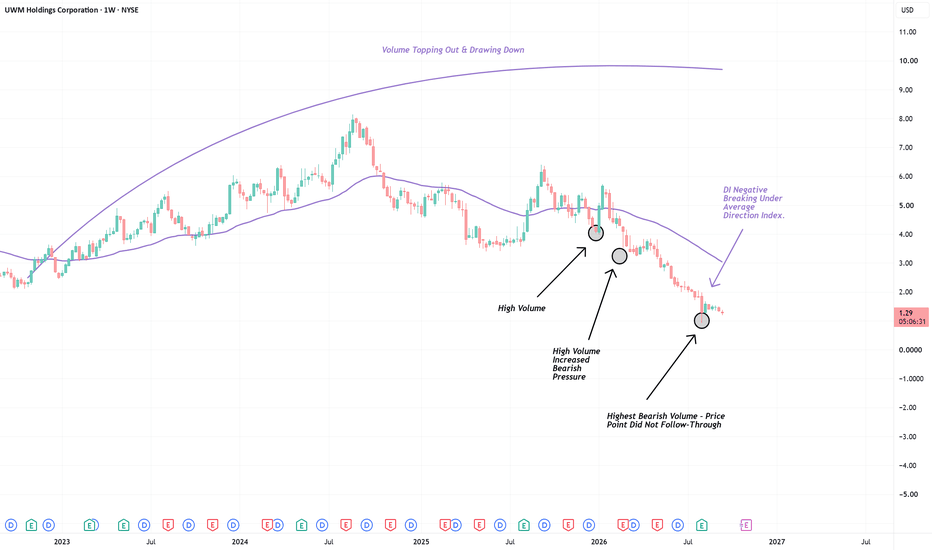
 Long
Long
 Long
Long
Week 39 of 52 | MSTR $120 Reclaimed — $175–190 Is Back in PlayNASDAQ:MSTR has come a long way from where we were watching it a few weeks ago. Back then the idea was pretty simple: first I wanted to see the $82–95 area hold, then MSTR needed to recover $100–105, and after that $120 was the next level that really mattered. Now we’re trading around $154, so a big part of that move has already happened.
That changes the setup. At $90–100, I was interested in whether support could hold. Around $120, I was watching for the reclaim. At $154, I’m thinking a lot more about patience. This is usually the point where people start getting interested because the stock is moving fast, and it’s also where it becomes easy to chase.
I don’t really want to do that here. A big green candle makes the chart look obvious after the fact, but it doesn’t automatically mean the risk/reward is still attractive at the current price. I’d rather wait and see what MSTR does when it finally pulls back.
The first area I’m watching is around $140–145. After a move like this, I think that’s a reasonable place to look for buyers. If MSTR pulls back, holds that area and starts moving higher again, the structure would still look healthy to me. If we lose it, then $120–125 becomes much more important.
That $120–125 area matters because it was resistance before. Now I want to see if it can become support. That’s one of the things people sometimes overcomplicate in technical analysis. A breakout by itself is not enough. What happens after the breakout matters just as much.
If price breaks resistance and later comes back to the same area, that’s where you get more information. Do buyers defend it? Does price immediately fall back below it? Does volume come in? Does the stock start building higher lows? That reaction tells you a lot more than just drawing a line on the chart.
That’s why I’m paying attention to $120–125. If MSTR eventually comes back there and buyers defend it, I’d see that as a much stronger confirmation that the structure has really changed.
Above current price, I’m still watching the $175–190 area. That zone was already on the chart before this move. I’m not saying MSTR has to go there next, but if momentum continues, that’s the next area where I’d expect things to get more interesting.
There will probably be more sellers there, maybe some profit taking, maybe a rejection, maybe a breakout. I don’t know yet, and I don’t need to know yet. I’d rather wait and see how price reacts when it gets there.
That’s really the part I care about most. The level itself isn’t the trade. The reaction at the level is.
Bitcoin also remains a big part of the picture. MSTR doesn’t trade like a normal software company anymore. BTC sets a lot of the direction, and MSTR tends to amplify the move. When Bitcoin is strong, MSTR can move very fast. But that works the other way too, and if BTC starts losing momentum, MSTR can give back gains quickly.
So even though this chart looks much better than it did a few weeks ago, I’m not interested in assuming the next move is straight to $190.
For now, these are the levels I care about:
$140–145 — first area to watch on a pullback
$120–125 — key breakout support
$175–190 — major supply area
$82–95 — major support
And for me, the main lesson here is still patience. You don’t have to catch every candle, and you don’t have to buy just because something is moving. Sometimes the best thing you can do is already know your levels and wait.
If MSTR keeps running without giving a good setup, that’s fine. There will always be another trade. I’d rather miss part of the move than force an entry just because I’m afraid of missing it.
Patience is part of the trade.
Not financial advice. Tesla-Can Buyers Build Enough Momentum for Another Break Higher?Market Structure
Tesla remains in a medium-term bullish structure on the 4-hour chart. After recovering strongly from the late-July low, price has entered a consolidation phase below resistance. Higher lows continue to hold, suggesting buyers are still defending the trend despite the recent sideways movement.
Market Sentiment - Moderately Bullish
Momentum has cooled after the recent rally, but buyers continue to absorb selling pressure around support. As long as higher lows remain intact, the overall sentiment stays cautiously bullish.
Bullish Scenario
If Tesla breaks above the 368 resistance zone with strong buying volume, bullish momentum could accelerate toward 375, with 382 becoming the next upside target.
Bearish Scenario
If price falls below the 356 support area, short-term selling pressure could increase and drive the price toward 348. A decisive break below 348 would weaken the current bullish structure and shift momentum back to the downside.
────────────────────
Market View
Tesla is trading within a consolidation range after a solid recovery from recent lows. While buyers continue defending support, the market is waiting for a clear breakout before establishing the next directional move.
────────────────────
Key Levels
First Resistance: 368
Second Resistance: 375
First Support: 356
Second Support: 348
────────────────────
Outlook
A sustained breakout above 368 would confirm renewed buying strength and could open the door toward 375–382.
On the other hand, losing 356 would increase the probability of another corrective move toward 348 before buyers attempt to regain control.
────────────────────
Event Risk
Tesla may remain sensitive to broader Nasdaq performance, U.S. economic data, Treasury yield movements, EV industry developments, company-specific announcements, and overall market risk sentiment. These events could lead to increased short-term volatility.
────────────────────
Please share your view below:
Do you think Tesla is ready to break above resistance and continue its recovery, or will the current consolidation lead to another pullback?
I'll continue sharing more Market Structure and Key Level updates. Meta — Healthy Correction or Trend Reversal?Market Structure
Meta remains in a strong bullish structure on the 4-hour chart, with higher highs and higher lows still intact. After an aggressive rally toward new swing highs, price has started to pull back from resistance, suggesting a short-term correction within the broader uptrend.
Market Sentiment - Moderately Bullish
The overall trend continues to favor buyers despite the recent pullback. Profit-taking has increased near resistance, but unless key support levels are broken, the broader bullish structure remains unchanged.
Bullish Scenario
If price finds support around 660 and buyers regain momentum, Meta could retest the 680 resistance. A successful breakout above 680 would expose the 688–690 area as the next upside objective.
Bearish Scenario
If price falls below 660, selling pressure could increase and lead to a deeper correction toward 645. A break below 645 would weaken the current bullish structure and shift momentum toward the sellers.
────────────────────
Market View
Meta has delivered an impressive rally over the past several sessions and is now experiencing its first meaningful pullback near resistance. At this stage, the decline appears more like profit-taking than a confirmed trend reversal. The reaction around support will likely determine whether buyers are ready for another leg higher.
────────────────────
Key Levels
First Resistance: 680
Second Resistance: 688
First Support: 660
Second Support: 645
────────────────────
Outlook
Holding above 660 would keep the bullish outlook intact and could allow buyers to challenge 680 once again.
However, a decisive break below 660 may trigger a deeper retracement toward 645 before the next directional move develops.
────────────────────
Event Risk
Meta may remain sensitive to broader Nasdaq performance, U.S. economic data, Treasury yields, AI-related developments, and company-specific news. These factors could increase short-term volatility.
────────────────────
Please share your view below:
Do you think Meta will resume its rally and break above 680, or is a deeper pullback more likely from here?
I'll continue sharing more Market Structure and Key Level updates.  Long
Long
 Long
Long
 Short
Short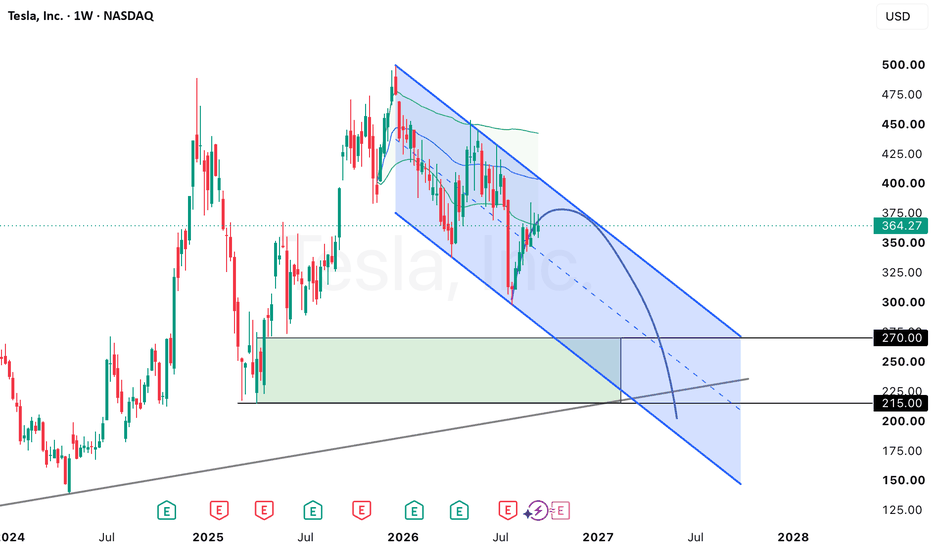
 Long
Long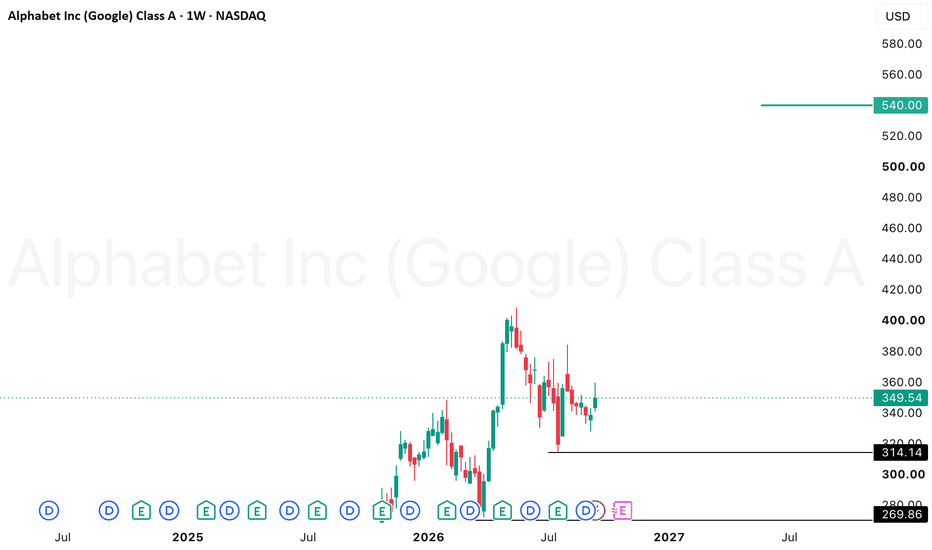
Whirlpool Corporation (WHR) Is AwakeningKEY TAKEAWAYS
• Price Target: US$74 per share
• Potential Upside: approximately 137%
• Thesis: The combination of technical structure, a favorable economic cycle for the sector, recovering fundamentals, and positive analyst outlooks creates a compelling setup for further analysis.
WHIRLPOOL CORPORATION
Whirlpool Corporation is a leading U.S. multinational and the #1 home appliance company in North America and Latin America. The company designs, manufactures, and markets home appliances and related household products. It also ranks among the Top 3 globally , competing at the highest level with major international players such as Haier, Midea, LG Electronics, and Samsung Electronics.
Founded on November 11, 1911, Whirlpool has been listed on the New York Stock Exchange (NYSE) since 1955 and has maintained a position of industrial leadership and resilience for more than a century.
Whirlpool Corporation also maintains strategic relationships with some of the largest home improvement and department store chains across North and Latin America, including Home Depot, Lowe's, Sears, and major regional retailers.
Unlike competitors that rely heavily on importing their products from Asia, Whirlpool manufactures a significant portion of its volume directly in North America. This helps reduce international freight costs and improves response times. Its scale also allows the company to spread production costs over a large volume while continuing to invest in research and development.
TECHNICAL ANALYSIS
The first thing that caught my attention was the presence of elevated institutional volume on the price chart.
In Figure 1, you can see how historically elevated trading volumes have preceded significant price increases in Whirlpool. A leading company with a long history of consistent returns is unlikely to go unnoticed by major institutions and large investors.
Figure 1
When multiple technical tools also reveal an alignment of technical and psychological price zones, the analysis becomes more robust and encourages us to take a deeper look at the company's fundamentals.
Figure 2
EARNINGS REPORT JUST AROUND THE CORNER
The next earnings report is only 27 days away , and the current analyst outlook is positive.
One factor worth considering is that the large home appliance business tends to concentrate a significant portion of its sales and replacement activity during the second half of the year. In addition, the company has announced cost-reduction initiatives aimed at recovering approximately $150 million in operating margins .
After two consecutive quarters in negative territory, partly related to adjustments and accumulated inventories at retailers, analysts are modeling that even a modest stabilization in retail demand could bring earnings back into positive territory.
During the second quarter of 2026 , net earnings available to common shareholders increased to $75 million ($1.15 per share) , compared with $65 million ($1.17 per share) during the same period in 2025.
The company also recognized a $139 million gain related to the sale of its remaining 25% stake in Beko Europe, the termination of the agreement concerning its Russian business, and the release of accumulated indemnification provisions.
Furthermore, Whirlpool raised approximately $1.081 billion net in February 2026 through a combined issuance of common stock ($524 million) and mandatory convertible preferred stock ($557 million).
Another important factor is the IEEPA tariff recovery process. This is the legal mechanism through which U.S. importers seek refunds for tariffs collected under the International Emergency Economic Powers Act. Whirlpool secured approximately $50 million in tariff recoveries through this process.
Other factors worth keeping in mind include the decline in interest expense, from $86 million to $63 million during the quarter, while selling, general and administrative expenses (SG&A) decreased by 6.7% to $371 million .
Whirlpool Corporation also has a share repurchase program authorized by its Board of Directors. As of June 30, 2026, approximately $2.5 billion remained authorized and available under this program.
LITIGATION
For a multinational company of Whirlpool's size, many legal cases are typically resolved through economic settlements, often involving compensation funds for consumers or shareholders, without necessarily compromising the company's overall operational stability.
However, there is a significant tax dispute related to the BEFIEX program in Brazil , which represents one of the more relevant legal and tax contingencies on Whirlpool Corporation's balance sheet.
The BEFIEX program was a Brazilian government tax-incentive program — Benefícios Fiscais a Exportação — designed to support exporting companies by compensating or exempting certain federal taxes.
The dispute arose when Whirlpool used tax credits derived from this program to offset tax liabilities. Brazilian tax authorities subsequently challenged the validity and scope of a significant portion of these offsets.
The accumulated administrative and judicial proceedings amount to approximately $538 million . In its regulatory filings with the SEC, Whirlpool classifies this tax contingency as a possible but not probable loss and continues to actively defend its legal position.
If final judicial decisions in Brazil ultimately go against Whirlpool, the company could be required to make capital outlays or negotiate tax settlements, potentially affecting liquidity.
My view is that this issue is unlikely to materially affect Whirlpool in the medium term. Brazil is known for having one of the world's most complex and prolonged tax and litigation environments, meaning that disputes of this nature can take years — and sometimes decades — to reach a definitive resolution.
CONCLUSION
My analysis of Whirlpool Corporation does not rely on a single indicator or isolated phenomenon.
Instead, it is the combination of multiple factors that makes the company particularly interesting to me: the technical structure, sector dynamics, improving fundamentals, cost-reduction initiatives, potential tariff recoveries, capital structure developments, and the current analyst outlook.
The upcoming earnings report will be especially important because it should provide further evidence as to whether the recovery that the market is beginning to anticipate is actually supported by Whirlpool's operating numbers.
Price Target: US$74
Potential Upside: ~137%
As always, this is my personal analysis and not financial advice. Investors should conduct their own research and consider their individual risk tolerance before making any investment decision.
 Long
Long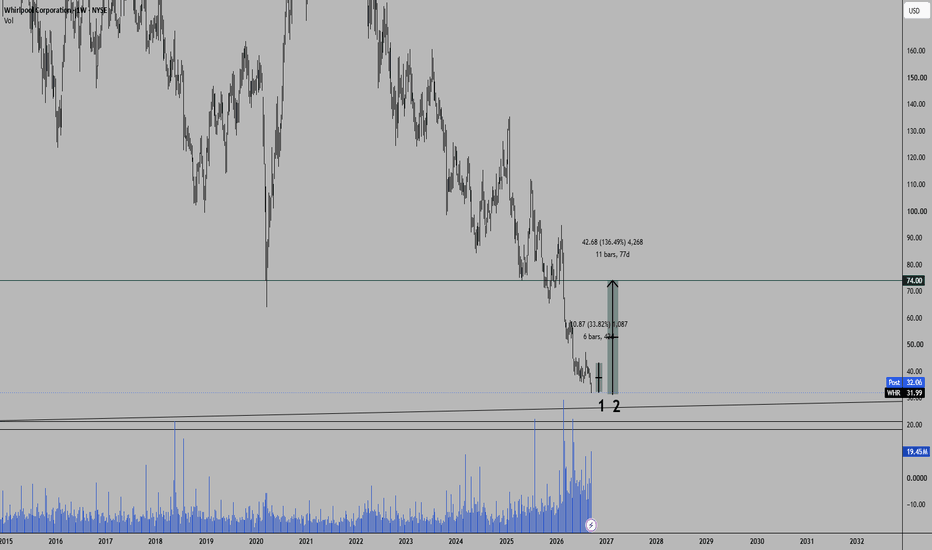
SNDK Is Back Near $1,800 — This Level Could Decide the Next Move
SNDK has moved hard, but I’m more interested in what happens next. Price is back around $1,739, right below the $1,800 area that has repeatedly acted as resistance on the 4H chart.
The bigger structure still looks constructive to me. SNDK has been making higher lows inside a rising channel, and the current move is bringing price back toward the top of the recent range.
The setup I’m watching is simple: I want a clean 4H close above $1,800, followed by a hold or retest of that level. If buyers can turn $1,800 into support, I’ll be watching $2,300–$2,400 as the next major area, close to the upper side of the broader channel.
There is also a reason to pay attention to SNDK right now. The stock is scheduled to join the S&P 100 on September 21, while memory and AI data-center demand remain important themes around the company.
Today also comes with extra market noise. The BOJ raised its policy rate to 1.25%, while U.S. markets are dealing with quarterly derivatives expiration. That can make price action less clean, so I’d rather wait for SNDK to confirm its direction than force an entry.
The downside is just as clear. My main support zone is $1,450–$1,500. If price loses that area and breaks down from the rising channel, the breakout thesis is no longer valid for me.
This is also where Bitget becomes useful for this type of setup. SNDKUSDT is available as a stock perp on Bitget with 24/7 trading, so if the setup changes after the U.S. session closes, I can still monitor and manage the position instead of waiting for the next market open.
I also like the flexibility of being able to trade the stock perp long or short with USDT rather than needing a traditional brokerage account. Bitget says its stock perps are designed for 24/7 trading and support both directions, although liquidity can vary outside regular U.S. market hours.
So my map is straightforward:
Above $1,800: breakout confirmation → watch $2,300–$2,400.
Rejection below $1,800: no chase → wait for another setup.
Below $1,450–$1,500: rising structure is weakened → reassess.
I’m not trying to predict the next candle. I’m watching $1,800 to see whether SNDK can finally turn resistance into support.
Not financial advice.  Long
Long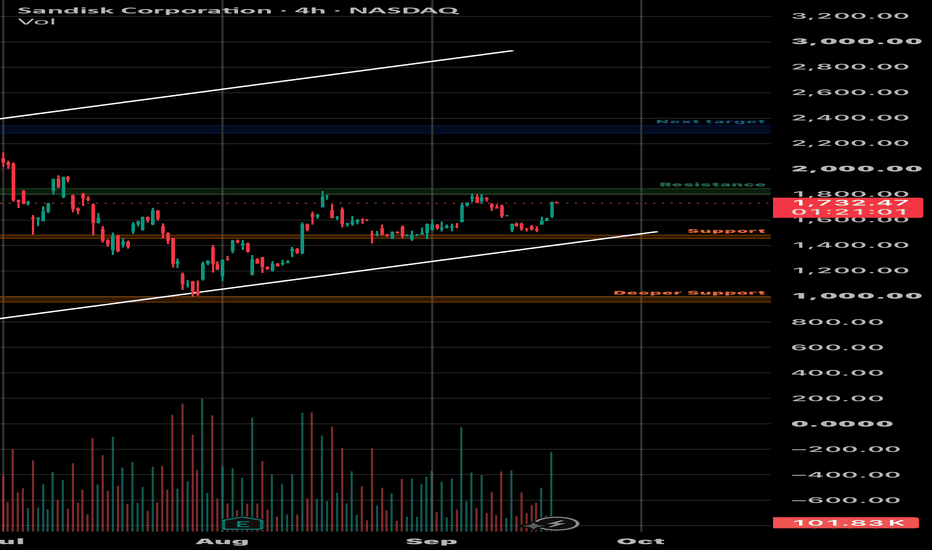
 Short
Short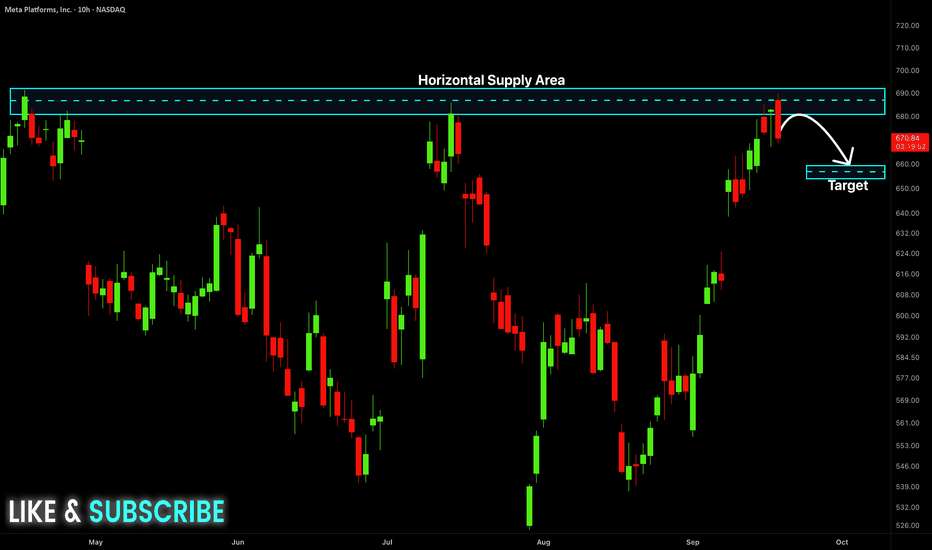
PLTR: Rebound Toward $180 | A Defined Plan for $189 and $202Palantir is attempting to recover after pulling back from the $185–$188 area. On the daily chart, price has rebounded from the mid-$160s and is now trading around the $176.24 reference level.
The next test is the $180 area. A sustained move above it would strengthen the recovery scenario and bring the recent highs back into focus. Until then, this remains a rebound within the recent trading range.
Key levels and trade framework
- Reference entry: $176.24.
- Initial stop: $163.11, approximately 7.45% below the reference entry.
- First target: $189.37, approximately +7.45%.
- Second target: $202.50, approximately +14.90%.
These targets come from the risk-management plan displayed on the chart; they are not both established resistance levels.
Bullish scenario
Holding the recent rebound structure and reclaiming $180 would support a move toward the $185–$189 area. A convincing breakout above that zone would then open the possibility of an extension toward $202.50.
Risk management
The plan splits profit-taking equally between the two targets. This represents approximately 1R at TP1 and 2R at TP2, or a blended 1.5R if both are reached, before execution costs and slippage.
The chart also marks $195.94 as a profit-protection trigger for the remaining position. Reaching that level would be a point to reassess protection rather than assume the final target is guaranteed.
Invalidation
Failure to reclaim $180 would leave the recovery vulnerable to another pullback. A return below the recent lows would weaken the setup, while $163.11 defines the planned stop level.
My bias is cautiously bullish, with confirmation still needed above $180. The priority is to respect the predefined risk and let price confirm the next leg.
Can PLTR reclaim $180 and challenge $189, or will sellers reject this rebound?
For educational purposes only. This is a conditional trading scenario, not a recommendation to buy or sell.
Laurent - Private Investor
✅ DL INVEST | Community Leader
 Long
Long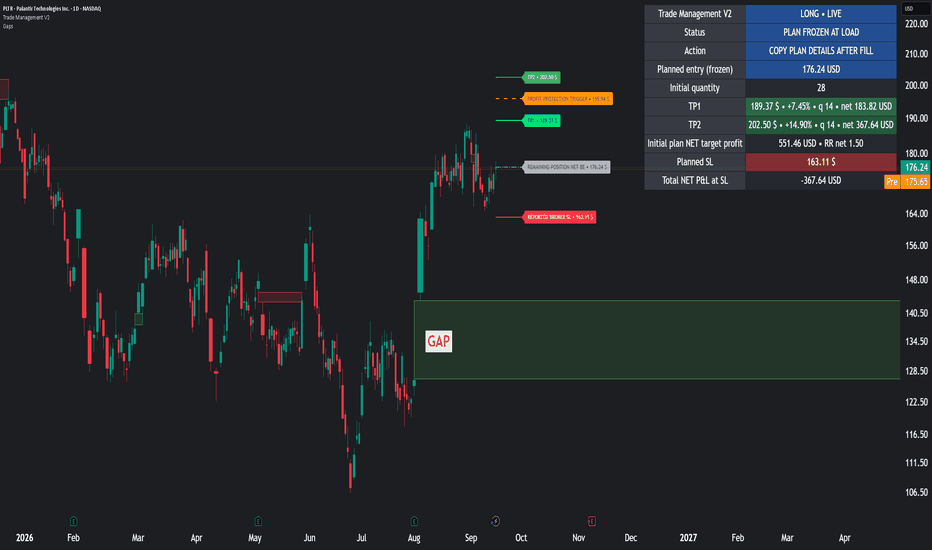
Long 
Long 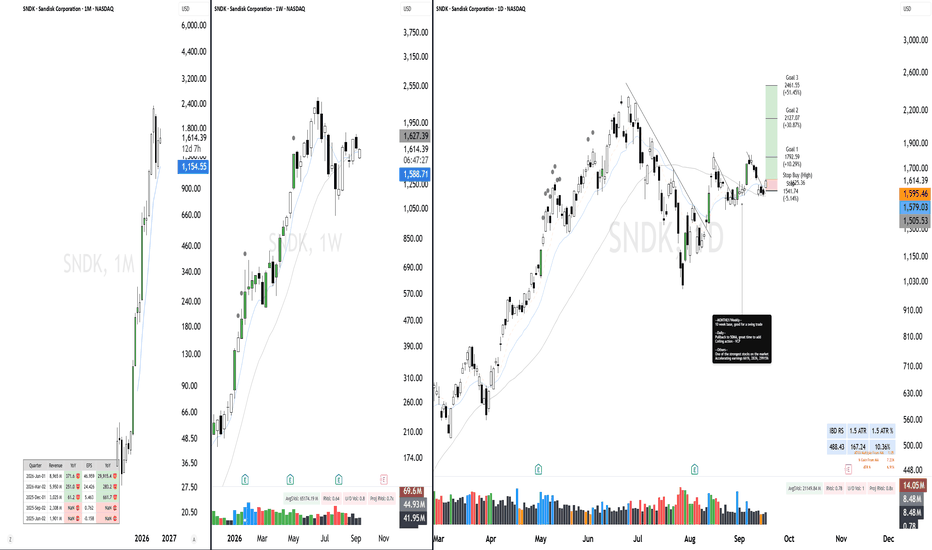
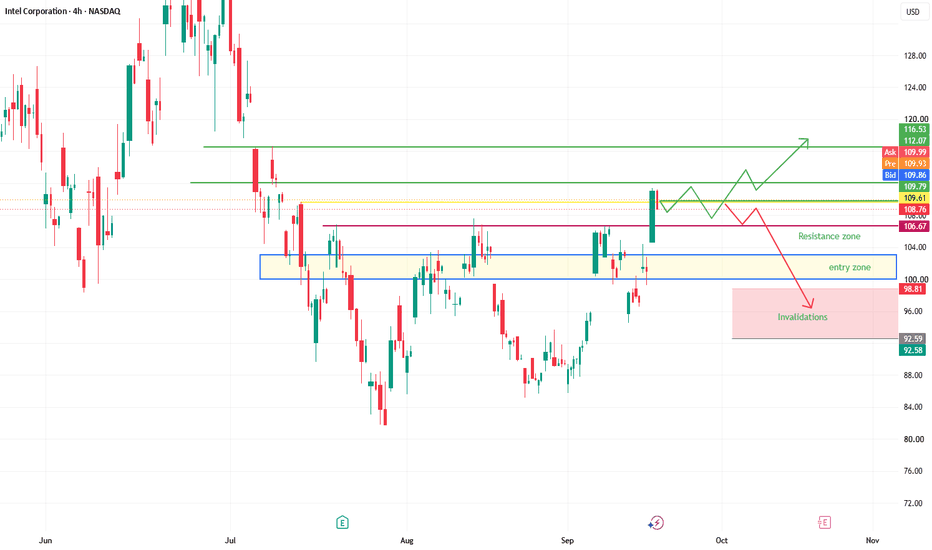
INTC Post-FOMC Rebound: Can Semiconductor Momentum Extend?INTC: Post FOMC Rebound Tests Whether AI Infrastructure Strength Can Continue
📊 POST-FOMC REACTION
The FOMC delivered a 25bp hike to 3.75%–4.00%, initially pressuring equities as yields moved higher. But the next session told a different story: Treasury yields and oil eased, Nasdaq rebounded strongly, and semiconductor stocks led the recovery.
Intel stood out with a roughly 7.7% gain, while AMD, Micron, and other chip names also posted strong rebounds. That makes INTC interesting to me not because the Fed suddenly became bullish, but because price showed strong relative participation when macro pressure eased.
🔍 WHY INTC
I’m focusing on INTC because the reaction combines three things I want to see after a macro shock:
• Strong post-FOMC recovery
• Semiconductor sector participation
• A nearby technical breakout level to define risk
TradingView’s current U.S. stock Community Trends also keeps INTC visible alongside active AI/semiconductor names.
📈 TRADE PLAN
My preferred idea is a pullback/retest long, not chasing the first expansion.
Entry: $100–$103 on a controlled pullback and bullish confirmation
Key resistance: $106–$107
TP1: $112
TP2: $116–$117
Invalidation: sustained loss below ~$97–$98
The key test is whether the previous breakout area can turn into support. A clean reclaim of $106 with volume would strengthen the continuation case.
⚠️ BEARISH SCENARIO
If INTC rejects around $106–$107 and loses the $100 area, I would step aside rather than force the long. A deeper retracement toward the high-$90s would then become more relevant.
🧭 THE BIGGER PICTURE
Stocks, CFDs and crypto all reacted differently to the Fed shock. Gold recovered as yields and oil eased, while BTC held relatively firm around the mid-$76K area. But among my watchlist, INTC offered one of the clearest examples of post-FOMC sector rotation.
For execution, I prefer trading the reaction rather than predicting the headline.
⚡ WHY BITGET
This is also why I’m watching the setup through Bitget. Having Stocks, CFDs and Crypto available on one platform makes it easier to compare cross-market reactions around major U.S. events. Bitget also offers 24/7 TradFi Perps for supported markets, while its campaign data highlights deeper U.S. Stock Perps liquidity versus the exchanges being compared.
📝 KCGI JOURNAL
If I take the INTC setup, the trade will be added to my KCGI TradingView journal with the original thesis, entry, invalidation, execution and final result.
Plan first. Let the retest confirm. Then execute.  Long
Long