NTRS Breakout After Building a Tight Base Above Rising SupportNASDAQ:NTRS is showing a clean structure after a strong move from the April lows.
After the initial advance, price did not immediately fail at resistance. Instead, it continued to build higher support levels, showing that buyers were still defending the trend.
The key structure here:
Higher support formed after each pullback
Price consolidated near the resistance area
A small base developed just above the prior breakout zone
Breakout confirmation followed after the base tightened
This is the type of structure Sniper Alpha wants to see: not just a breakout candle, but a breakout that comes after accumulation, support rising, and volatility tightening near resistance.
NASDAQ:NTRS is already part of the Sniper Alpha portfolio, and the current move confirms why structure matters before the breakout becomes obvious.
For Sniper Alpha, the goal is not to predict every move.
The goal is to identify strong structure, manage risk first, and let the trend prove itself.
No fixed take profit.
Follow the structure.
Raise the trailing stop when the trend gives a reason.
Sniper Alpha Framework:
Structure first.
Breakout second.
Risk management always.
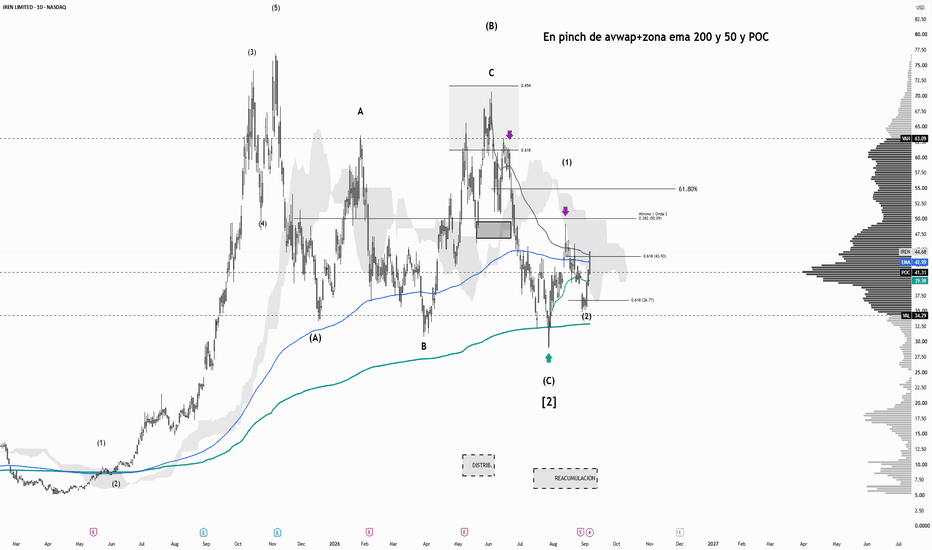
IREN | DailyNASDAQ:IREN — Quan-Entangling Model
Stabilizing the Projected Uptrend | Impulsive Extension 📈
IREN rose +5.9% intraday, closing precisely on the Trend E-line Δ ✨—further defining the projected path of the impulsive Intermediate Wave (3) extension.
Quan-Analysis
The TS Quan-Structure Δ continues to provide firm support through the confluence of its supportive E-lines, anchored at the Trend's origin ➤ $37.66 ✨.
With price now interacting between Support E-line α and Resistance E-line θ within the Transitional Quan-Structure χ, a Quan-Leap above Resistance E-line θ is now anticipated.
🔖 It's worth noting that every major turning point on the daily chart since early November has been identified with high precision through the defined Quan-Structures λᵣ, λ₁, λ₂, φ, and recently Δ ⋆˚࿔༄ ✰.⋆
#FutureVision #SmartInvesting #TrendAnalysis #MarketStructure #MarketInfrastructure #QuanAnalysis #QuantumEntanglement
#GrowthStocks #Trendflow #QuantumLeap
KO KO hit resistance and rejected off.
so, for a higher move we would need to turn that resistance into support
until then I would not consider the trade.
on the flip we can be looking at a potential move lower, even back to support.
a lot more time to see where this goes
also, we are in a macro ascending triangle, and if that breaks, we can see
target would be 25.00 I don't think this would happen just throwing it out there.
NVDA Forecast | Down 17% While Earnings Explode, Bounce to 204NASDAQ:NVDA technical analysis on the 4H: Nvidia is trading around 194 after a 17% correction from the all time high at 236.54, and the selling is starting to look tired exactly where it should.
Here is the disconnect that makes this trade. While price was falling, the business kept accelerating. Last quarter revenue came in at 81.6 billion dollars, up 85% year over year, with guidance near 91 billion for the next one. Confirmed orders for Blackwell and Rubin chips are reported around 500 billion dollars through the end of 2026. The stock went down 17% while demand went up. Corrections like that are positioning resets, not trend changes.
Yes, there is a real headwind: Washington closed the loophole that let chips reach China through offshore subsidiaries, with estimates of a 5 to 16 billion dollar revenue impact. That is exactly what this correction has been pricing in for weeks. When a known negative is fully public, its power over price fades.
Why I am long from 194.65:
📌 Price is stabilizing after the decline, with buyers stepping in repeatedly under 195
📌 The fundamental engine is untouched, AI infrastructure spending keeps trending up, not down
📌 Analyst consensus sits far above price, which means funds buying dips have room to defend
📌 The 4H structure shows momentum shifting while weak hands are still selling the China story
🎯 Target: 204, the supply shelf just above the 202 weekly area. Expect reactions at 199.6 and 200.7 on the way, those are checkpoints, not exits.
Risk is defined below the recent consolidation. I never trade without a hard invalidation, and my full risk parameters are shared with my community.
This week my systems fired on OANDA:XAUUSD twice and OANDA:EURGBP once, all on my profile. Same process, applied to Nvidia stock. Boost and follow to catch the updates as this plays out.
Not financial advice. Trade your own plan.
Direction: Long | Tags: NVDA, Nvidia, nvidiastock, NVDAforecast, technicalanalysis, AIstocks, stockmarket
AVGO Forecast | Broadcom Panic Is Overdone, Recovery to 403NASDAQ:AVGO technical analysis on the 4H: Broadcom has dropped 15% in a month, and the reason tells you more about the market than about the company. Wall Street punished the stock because management did not raise its AI guidance. Read that again. Revenue is on track, AI sales more than doubled to 10.8 billion dollars last quarter and are expected to triple to 16 billion this quarter, and the stock sold off because the forecast stayed the same instead of going up.
That is not deteriorating business. That is an expectations reset, and expectations resets end when the sellers who bought the top finish capitulating. Looking at the last stretch of this decline on the 4H chart, candles are compressing near 360 and downside momentum is drying up.
Why I am long from 360.38:
📌 The growth engine is intact, six custom chip customers including Google, Meta, OpenAI and Anthropic, and AI networking demand still accelerating
📌 The bad news is fully public and fully priced, guidance disappointment has been sold for a month straight
📌 Analyst consensus sits roughly 45% above current price, dip buyers have fundamental cover here
📌 Same setup logic as my NASDAQ:NVDA long from yesterday, the whole semiconductor group got reset together, and group moves reverse together
🎯 Target: 403, the shelf just above the 400 round number where the June breakdown started. Checkpoint on the way is 376, expect a reaction there first.
Risk is defined below the current base. I never trade without a hard invalidation, and my full risk parameters are shared with my community.
This week: OANDA:XAUUSD twice, OANDA:EURGBP , NASDAQ:NVDA , now $AVGO. Every call is on my profile with the levels visible. Boost and follow to track this one live.
Not financial advice. Trade your own plan.
Direction: Long | Tags: AVGO, Broadcom, AVGOforecast, AIstocks, semiconductors, technicalanalysis, stockmarket
KEEL | DailyNASDAQ:KEEL — Quan-Entangling Model
Quan-Analysis | Advancing Phase Underway 📈
As projected, KEEL leaped 9.7%📈 intraday.
The $ 4.30 double bottom validated Trend E-line χ and is now confirmed as the extreme low point of the Expanded Flat Minor Wave 4 correction, identified through the
TS Quan-Structure Δ ⋆✨⋆ ݁˖
With the projected impulsive advance through Minor Wave 5 now underway, the near-term
HPQ Target ➤ $6.16 🎯 remains achievable into next week, while the primary
HPQ Target ➤ $9.99💫 | August remains intact.
🔖 It's worth noting that the major turning points on the daily chart since October have been identified with high precision through the defined Quan-Structures λᵣ, λₛ, and recently Δ ⋆˚࿔༄ ✰.⋆
#FutureVision #SmartInvesting #TrendAnalysis #MarketStructure #MarketInfrastructure #QuanAnalysis #QuantumEntanglement #GrowthStocks #Trendflow
Netflix - The once in a lifetime swingtrade!💰Netflix ( NASDAQ:NFLX ) is testing massive support:
🔎Analysis summary:
Since mid 2025, Netflix has basically been creating a correction of about -50%. And with this harsher correction, Netflix is also testing a major confluence of support. If Netflix soon creates bullish confirmation at support, this becomes a once in a lifetime opportunity.
📝Levels to watch:
$70
Keep your #LONGTERMVISION🙏
— Phil (@TheTraderPhil)
Z Eyes $48.60Zillow has been absolutely dismantled — down roughly 64% from its 52-week high of $93.88 — and is now trading at $33.44, just off a sweep of its 52-week low at $29.23. This is exactly where a stock proves itself or folds.
But the business behind the ticker is not broken. Zillow is still the front door of American real estate — the place where buyers, sellers, and renters start their search — and it's actively expanding its reach, with Zillow Rentals now connected into Google's AI platforms, putting its listings in front of users inside entirely new surfaces. The housing market has been frozen by high rates, and Zillow's stock paid the price. But frozen is not broken: every month of pent-up demand is coiled energy for whenever rate relief finally lets the housing market breathe. The stock got priced for a housing winter that will not last forever.
The Bounce Thesis
Z swept its 52-week low and is now basing and turning — today's +3.63% move is the kind of early reversal that shows buyers stepping in where sellers are exhausted. The RSI has been hammered into oversold territory with plenty of room to recover. And look at the runway overhead: the 150-day MA sits at $48.82 and the 200-day MA at $55.07 — both far above current price, which tells you how stretched to the downside this name became and how much room there is to climb back. How a stock reacts after sweeping its long-term lows tells you everything about whether buyers are stepping in or stepping away.
There may be one more test of the lows before the real move begins — but that's exactly where the stop is defined, at structural support.
The Push Through Resistance
A decisive close above the $38.05–$38.45 band (the first daily and weekly resistance cluster) confirms renewed bullish momentum and opens the staircase higher. From there, the path runs to the daily resistance at $48.44 — sitting right beneath the 150-day MA at $48.82, which makes the $48.60 area the natural magnet and target for this move. Beyond that, $55 (200MA) and the $57.51 weekly level are the longer-term stretch if the housing thaw takes hold.
One planning note: the next earnings report is roughly four weeks out — factor that into position sizing and timing, as it will be a binary event along the path.
Key Levels
Support / Entry Zone: $29.21 – $33.44
Breakout Trigger: $38.45 (1D/1W cluster)
Waypoints: $48.44 (1D) → $48.82 (150MA)
Price Target: $48.60 (target zone at the 150MA)
Stop Loss: $29.21
Risk/Reward: 3.58:1
Stop clearly defined at $29.21 — risk/reward of 3.58:1. One of the best setups on the board right now.
SNDK: Up 635% YTD, but why did we sell off, and what's next?Up 635% year-to-date and still standing after a 23% three-day gut check — that's not a stock breaking down, that's a stock finding out how much conviction its holders actually have.
THE CATALYST
This wasn't a SanDisk problem. Samsung reported blowout Q2 earnings on July 7 — 89.4 trillion won operating profit, +1,800% YoY on AI chip demand — and the market sold the news anyway. Micron and Western Digital fell the same 7% the same day. When three unrelated memory names drop in lockstep on good news from a fourth, that's not a company story, that's the whole sector repricing one fear at once: if results are this good, is production ramping too fast — are we near the top of the AI-memory cycle?
THE DEBATE
Two things argue this is digestion, not the top. Sell-side didn't blink — BofA, Bernstein, and Citi all reaffirmed or raised price targets ($2,500–$3,000) in the week before the drop, meaning nobody who actually models this business saw a broken thesis. And the snapback has been violent, not gradual — SNDK, MU, and WDC all ripped 6-9% back within two days, which looks like dip buyers stepping in, not distribution.
KEY LEVELS
Reclaim: 2,050 — the pre-selloff euphoria high. Closing back above this completes the round trip and says the cycle-top fear was wrong, at least for now.
First test: 1,900 — where price is fighting right now. This is the actual tell: if buyers can't hold this, the bounce was just a dead-cat relief rally.
Make-or-break: 1,600 — the literal panic low from the July 7 sell-the-news event. Losing this again means the fear wins and the AI-memory top thesis gets real weight.
TRADE PLAN
Long: reclaim confirmed above 2,040 → entry ~2,040, stop 1,973, target 2,340 (R:R ~4.5)
Short: breakdown confirmed below 1,652 → entry ~1,652, stop 1,729, target 1,301 (R:R ~4.5)
Between 1,652–2,040: no trade, watch 1,900 for which way it breaks
INVALIDATION
If SNDK closes back below 1,600, this bounce was a bull trap and the healthy-digestion read is wrong. No shame in that — a name up 635% YTD owes the market a real correction eventually, and this catalyst (rising fear of a cycle top) is exactly the kind of thing that starts one.
THE LESSON
The scariest headlines aren't always the real signal — sometimes the story isn't bad news, it's good news that makes people nervous about what comes next. Watch what price does at the test level, not what the headline says.
Patience beats prediction after a 635% year. I will update this idea as 1,900 and 1,600 get tested.
Micron: A 280% Year Meets Its First Real TestMicron has been one of the best performers in the entire S&P 500 this year. Blowout earnings, long-term supply deals with GM and Ford, and the AI memory shortage did the heavy lifting.
But the stock now sits roughly 25% below its all-time high at 1,255 - and this morning it is down another ~7% in pre-market - the first test of the 934 shelf is happening right now.
Parabolic runs rarely end with one red day. They end when support stops holding. So instead of guessing the top, here is the map I am watching:
KEY LEVELS
- First test: 934 - pre-market is probing this zone right now. Bulls need to defend it quickly.
- Make-or-break: 850 - the June swing low. This is the level that decides whether the uptrend structure survives.
- Reclaim level: 1,019 - Friday's high. A daily close back above it and this dip was just another shakeout in a strong trend.
If 850 breaks, the next meaningful shelf sits near 800, where the late-May breakout leg began.
TRADE PLAN (conditional - no position until a trigger fires)
- Bearish trigger: a daily close below 934 = short, stop above 1,019, targets 850 then 800. Risk/reward roughly 1:1.6 to the first target.
- Bullish trigger: a daily close back above 1,019 = long, stop below 934, targets 1,100 then a retest of 1,255. Risk/reward roughly 1:1.9.
- Between 934 and 1,019: no trade. Chop kills accounts.
INVALIDATION
The bearish scenario is off the table on a daily close above 1,019. No shame in that - after a 280% year, the trend deserves the benefit of the doubt until proven otherwise.
THE LESSON
After a parabolic advance, the first serious support test tells you more than any indicator. Do not predict - watch HOW 934 and 850 get defended. Volume will tell the story.
Patience beats prediction after a 280% year.
Not financial advice. I will update this idea as the levels get tested - follow along.
Rivian: A $1.5 Billion Share Sale Just Drew the Line at $15.50Respect what happened here: Rivian raised $1.5 billion in one move to fund its Georgia plant - and paid for it with an 18% drop in two days.
The mechanics matter. 75 million new shares were priced at $15.50. That is not just dilution - it is the price where institutions agreed to buy size. Offering prices become reference levels.
KEY LEVELS
- RECLAIM 20.00 - Monday's close before the announcement. Above it, the dilution is digested and forgotten.
- FIRST TEST 18.00 - the shelf price broke down from. First resistance on any bounce.
- MAKE-OR-BREAK 15.50 - the offering price. The buyers of 75 million shares defend this line. Wednesday's low: 15.43. It has already been probed.
TRADE PLAN
- Bullish: daily close above 18.00 -> long, stop below 15.50, targets 20.00 / 22.69 (52-week high).
- Bounce: a touch of 15.50 that closes back above it -> long, stop below 15.00, target 18.00.
- Bearish: daily close below 15.50 -> short, stop above 18.00, targets 13.50 / 11.57 (52-week low).
- Between 15.50 and 18.00: no trade. Let the two sides finish arguing.
INVALIDATION
The bullish structure dies on a daily close below 15.50. If the buyers who just paid that price will not defend it, nobody will. No shame in stepping aside.
THE LESSON
When a company sells shares, the offering price is information. It tells you where informed money valued the stock with full knowledge of the books. Mark it. The market almost always tests it.
Dilution is a price, not a verdict.
I will update this idea as the levels get tested.