• Products
  • Community
  • Markets
  • Brokers
  • More
Get started
  • Markets
  • /USA
  • /Stocks
  • /Ideas
$APPL Buy Put Exp 2612.27P330AAPL Buy Put 7/20/26 AAPL PA much higher than the 30wk SMA, top of the Bollinger band. Previous chart showed such deviation from SMA tends t come back down. often to the lower Bolliner band. Believe the 30wk sma has will eventually curl down. Conflicting indicator MACD: SL top, MACD line didn't point down Momentum still remains positive.
NASDAQ:AAPL
by joonkim
EBAY Long — EBAY's pullback holds above its reclaimed trigger wiEBAY has a clean pullback-long structure with a reclaimed intraday trigger and little ATR extension, so the setup is not asking you to chase. The takeover/stake headlines and fresh bullish analyst actions give the move a real catalyst behind a push back toward resistance. 📍 Entry: 112.53 🛑 Stop: 110.25 🎯 Target: 118.13 ⚖️ R:R: 2.46
NASDAQ:EBAYLong
by mnktrd
Alpha Tau Medical Ltd. (DRTS) Develops Targeted Cancer TherapyAlpha Tau Medical Ltd. (DRTS) develops targeted alpha radiation therapies designed to treat solid tumors with precision while minimizing damage to surrounding healthy tissue. Its lead technology delivers radiation directly into tumors, offering a novel approach to cancer treatment. Growth is driven by clinical progress, expanding indications, and rising demand for advanced oncology therapies. On the chart, DRTS printed a confirmation bar with increasing volume as price moved above the .236 Fibonacci level and into the momentum zone. A trailing stop can be established using Fibonacci levels on the Fibonacci snap tool, helping manage risk while allowing momentum to continue.
NASDAQ:DRTSLong
by traderspro_charts
NVDA Reclaimed 204.82 - The Shakeout Confirmed.NVDA Reclaimed 204.82 - The Shakeout Confirmed. Friday the base at 202.20 held on a close, and the open question was whether NVDA could reclaim 204.82 to confirm the shakeout. It did. Nvidia bounced from the 197.97 low back to 205.83, taking the level back and turning the base test into a defended low. The next test is 207.59, the breakout level lost last week - reclaim that and the whole drop reads as a shakeout inside the trend. Conviction is still only mid-range on the hour, so this is a recovery that has proved one level, not the whole structure. Neutral. Resistance: 207.59 - the lost breakout level, the next test Key resistance: 213.43-213.81 - the prior high Current price: 205.83 Support: 204.82 - just reclaimed, first line to hold Key support: 202.20 - the base Structural floor: 197.97 - the swept low Two paths from here: The reclaim extends through 207.59. If NVDA holds 204.82 and takes 207.59, the base test is fully resolved and the trend re-engages toward 213. The low is defended and the first level is already back. The bounce stalls under 207.59. Mid-range conviction running into a level it just lost is where recoveries fail. A rejection at 207.59 and a loss of 204.82 puts 202.20 back on the table for a second test, and second tests are weaker than first ones. The base held and the reclaim came, which is what confirmation looks like. 207.59 is the level that decides whether this is a full recovery or a bounce inside a broken structure. Built with SYNTHESIS v3.3 | SOM / ACE / IMP / SYNTHESIS Study, not financial advice.
NASDAQ:NVDA
by virDeStatera
TMUS | Continued stock growth- Timeframe: Weekly - Trade type: Buy stop order - Price: 198.86 - Take Profit: Open - Stop Loss: 186.21 (-6.40 %) Idea: Long on a breakout above last week's high - bullish momentum continuation. Entry: Buy stop above last week’s high. Stop-loss: Below the low of the same candle. If the weekly candle closes below this level, the trade is invalidated. Take Profit: Trailing stop following the lows of new weekly candles.
NASDAQ:TMUSLong
by Tired-Wolf
SEDG | The time to go long has come- Timeframe: Weekly - Trade type: Buy stop order - Price: 58.05 - Take Profit: Open - Stop Loss: 50.06 (-13.80 %) Idea: Long on a breakout above last week's high - bullish momentum continuation. Entry: Buy stop above last week’s high. Stop-loss: Below the low of the same candle. If the weekly candle closes below this level, the trade is invalidated. Take Profit: Trailing stop following the lows of new weekly candles.
NASDAQ:SEDGLong
by Tired-Wolf
NOC | Continued stock growth- Timeframe: Weekly - Trade type: Buy stop order - Price: 545.54 - Take Profit: Open - Stop Loss: 517.16 (-5.20 %) Idea: Long on a breakout above last week's high - bullish momentum continuation. Entry: Buy stop above last week’s high. Stop-loss: Below the low of the same candle. If the weekly candle closes below this level, the trade is invalidated. Take Profit: Trailing stop following the lows of new weekly candles.
NYSE:NOCLong
by Tired-Wolf
SLB | Continued stock growth- Timeframe: Weekly - Trade type: Buy stop order - Price: 48.73 - Take Profit: Open - Stop Loss: 46.43 (-4.70 %) Idea: Long on a breakout above last week's high - bullish momentum continuation. Entry: Buy stop above last week’s high. Stop-loss: Below the low of the same candle. If the weekly candle closes below this level, the trade is invalidated. Take Profit: Trailing stop following the lows of new weekly candles.
NYSE:SLBLong
by Tired-Wolf
CARR | Continued stock growth- Timeframe: Weekly - Trade type: Buy stop order - Price: 70.90 - Take Profit: Open - Stop Loss: 67.48 (-4.80 %) Idea: Long on a breakout above last week's high - bullish momentum continuation. Entry: Buy stop above last week’s high. Stop-loss: Below the low of the same candle. If the weekly candle closes below this level, the trade is invalidated. Take Profit: Trailing stop following the lows of new weekly candles.
NYSE:CARRLong
by Tired-Wolf
Soluna Holdings, Inc (SLNH)History Stock's correction has been completed in A B C , where Wave C came as a b c , Wave c in Ending Diagonal . Explosion in price expecting any moment 💥💥💥💣🚀 Very high Target prices noticed, could reach initially upto $870 - $990 and much more 💣💥💥💥 Highly recommended for Buying now.
NASDAQ:SLNH
by GNRI_Maker
JPMorgan Chase & Co. (JPM) Tradespoon – Long Setup $341.10Tradespoon model shows a long bias for NYSE:JPM . Predicted range: $334.13–$347.69. Trend: +0.33% (bullish outlook supported by strong earnings and financial-sector momentum). NYSE:JPM
NYSE:JPMLong
by yellowtunnel
Astera Labs | Pullback Within a Bullish Trend?After a powerful rally, Astera Labs has entered a healthy correction and is now testing the key 300-305 support area, where the Fibonacci level and the EMA 100 are located. Despite recent profit taking, price remains well above the EMA 200, keeping the long-term bullish structure intact. CCI has reached oversold territory and is beginning to recover, which may become an early signal that selling pressure is fading. As long as price holds above 300, the primary scenario remains a recovery toward 406, followed by 469 and potentially 565. A break below 300 would increase the probability of a decline toward the next major demand zone near 255. Astera Labs remains one of the fastest-growing AI infrastructure companies, providing high-speed connectivity solutions for GPUs, processors and modern data centers. The company continues to benefit from massive investment in artificial intelligence and cloud infrastructure by the world's largest technology companies. Continued revenue growth, expanding partnerships with leading server manufacturers and rising AI infrastructure spending could support the stock's long-term bullish outlook.
NASDAQ:ALABLong
by InvestWorld_777
Spotify, what compressions are made ofNYSE:SPOT has been in a monthly downtrend for over a year now and is now compressing very nicely, will be an explosive move when it breaks out. My money is to the upside
NYSE:SPOTLong
by cookie_moon_star
$ABT When the Reason for the Markdown ReversesWhat I'm seeing ABT peaked ~$137 in mid-2025 and bled 40% to $81.97 a textbook Weinstein Stage 4 markdown while the broader market ran. The week of July 13 changed the tape: a massive bullish engulfing candle on the highest weekly volume in months, reclaiming $100 off the Fib 0% floor. - Fib 0% ($81.97) tested and rejected hard - Weekly close $100.68, back above the 200-week EMA zone - 4H structure flipped: price above Value Area High ($100.67), above anchored VWAP/PoC at $95.10 — recent buyers are in profit, and the high-volume node at $95 is now the floor, not the ceiling - Weekly RSI recovering from deep oversold - Insider buying into the lows, zero selling Why it matters The markdown was never an earnings problem. Revenue grew every quarter through the decline. The stock was repriced on one thing: the April guidance cut from Exact Sciences dilution, plus litigation and competition fears stacked on top. On July 16, that exact driver reversed. Q2 beat. Full-year guidance *raised* back to $5.45–$5.60. The market marked the stock down on lowered guidance and just got handed raised guidance at a 23-handle lower price. When the cause of a Stage 4 gets invalidated, the markdown loses its fuel. That's the setup. Not the confirmation the setup. The levels - $94–95 — line in the sand. VWAP + PoC + volume shelf. Bulls must defend this or the reversal thesis dies. - $103.18 — first real test (Fib 0.382). Acceptance above opens the next leg. - $112–116 — the decision zone (Fib 0.618 + prior structure). This is where a bounce becomes a trend change or gets sold. - $137.49 — prior high. Not a target yet. A destination only if the base builds. What I expect Default assumption after 40% of markdown: overhead supply exists at every level above. One candle even a monster proves a floor, not a trend. Two conditions, no predictions: Weekly acceptance above $103 = first evidence the repricing is done and Stage 1 accumulation is underway. Until then, this is a violent bounce with a good story. Loss of $94 on a weekly close = the engulfing candle was distribution's gift, not accumulation's start. Back to watchlist. Strong business + reversed catalyst + reclaimed structure earns real attention. It does not earn full size. Patience is a position. Not financial advice educational breakdown of my process.
NYSE:ABTLong
by ImmaculateTony
Chart Whisperer | Intuitive Market AnalysisI don’t look at the markets the way everyone else does. I consider myself a bit of a chart whisperer—not because I have a secret algorithm, but because years of staring at the screens have given me a deeply personal, intuitive feel for price action. My trading style is anchored in reading the natural rhythm of the candles, and more often than not, the market moves exactly the way my intuition says it will. If you are looking for high-probability predictions and want to watch these setups play out in real-time, hit that follow button. Just to be completely transparent: I am absolutely not a professional financial advisor, and nothing I post is official trading advice. I’m simply a retail trader sharing my personal journey, ideas, and charts. Trade at your own risk, but feel free to follow along if you want to see how an intuitive approach tackles the market.
NYSE:UBER
by terencej
Chart Whisperer | Intuitive Market AnalysisI don’t look at the markets the way everyone else does. I consider myself a bit of a chart whisperer—not because I have a secret algorithm, but because years of staring at the screens have given me a deeply personal, intuitive feel for price action. My trading style is anchored in reading the natural rhythm of the candles, and more often than not, the market moves exactly the way my intuition says it will. If you are looking for high-probability predictions and want to watch these setups play out in real-time, hit that follow button. Just to be completely transparent: I am absolutely not a professional financial advisor, and nothing I post is official trading advice. I’m simply a retail trader sharing my personal journey, ideas, and charts. Trade at your own risk, but feel free to follow along if you want to see how an intuitive approach tackles the market.
NASDAQ:ARMShort
by terencej
Chart Whisperer | Intuitive Market AnalysisI don’t look at the markets the way everyone else does. I consider myself a bit of a chart whisperer—not because I have a secret algorithm, but because years of staring at the screens have given me a deeply personal, intuitive feel for price action. My trading style is anchored in reading the natural rhythm of the candles, and more often than not, the market moves exactly the way my intuition says it will. If you are looking for high-probability predictions and want to watch these setups play out in real-time, hit that follow button. Just to be completely transparent: I am absolutely not a professional financial advisor, and nothing I post is official trading advice. I’m simply a retail trader sharing my personal journey, ideas, and charts. Trade at your own risk, but feel free to follow along if you want to see how an intuitive approach tackles the market.
NASDAQ:ADBELong
by terencej
$SPY Short-Term (less than two week) AnalysisCurrent Technical Picture The latest session traded: High: ~$747.25 Current: ~$743.30 Low: ~$740.83 This tells me buyers were unable to hold above $747, but they also defended the low-$740s. Probability Assessment (1 Week) Assuming no major macro shock outside earnings: Retest of $747.27: ≈70–75% This is only about 0.5% above the current price and is well within a normal weekly range. Retest of $750: ≈50–60% This would likely require at least one strong earnings reaction from a major tech company. Break and hold above $750: ≈35–40% Markets often need multiple positive catalysts to sustain a breakout beyond an established high. Pullback to the 38.2% Fib (~$738.50): ≈45% A common retracement if earnings are mixed. What I'd Watch The strongest bullish signal would be: Price holds above the 23.6% Fib (~$743). The 9 EMA remains above the 21 EMA. Volume expands on moves through $747.25. If those conditions occur, a move toward $750–752 becomes much more likely.
NASDAQ:PLTRLong
09:30
by Halcyon02
Netflix: Weak Guidance, Strong Technical SupportNetflix delivered a solid quarter with revenue essentially in line and a slight EPS beat, but weaker-than-expected Q3 guidance overshadowed the results and kept downside pressure elevated. Longer term, structural support sits near $69, while the preferred green zone beginning around $65 offers the better area to slowly scale into a position. Near-term volatility could remain high as weakness in high-flying chip stocks, Chinese AI model duplication concerns, and a pullback in Korean memory names weigh on the broader market. NFLX remains a hit-driven asset that has spent aggressively on sports and live entertainment, pressuring both the top and bottom lines. Still, forward growth projections and nearby technical support make it a reasonable long-term investment for investors willing to accept the volatility and scale in gradually on pullbacks.
NASDAQ:NFLX
by TheCarny
TSLA Earning Week Option Trades TSLA has been grinding inside a broad consolidation after failing to sustain the early-July push, with price repeatedly reacting around the 391.00 and 381.00 zones. The chart is also respecting a descending trendline from the early-month highs, while 406.00 and 412.00 remain the first major upside hurdles if buyers can regain momentum. Earnings next week are the main catalyst, and the implied move shown on the chart should be treated as fluid until closer to the report. I’m using two main earnings paths here: a continuation move in green and an overreaction move in red. I've mapped out three scenarios for the coming sessions: 🟢 Bullish Scenario If TSLA reclaims 391.00 and then pushes through 406.00, the path opens toward 412.00 and eventually the 429.55 daily level. This is the continuation setup, but it needs strength above the overhead trendline and clean acceptance back into the upper range. 🔴 Bearish Scenario (My Lean) This is the scenario I'm leaning toward. If 380.05 fails and TSLA loses 381.00, the next clean downside targets are 370.00 and 364.00, with a deeper flush toward the red implied move zone near 354.00 possible on an earnings overreaction. A deceptively bullish drift into earnings could still roll over hard, so I’d be watching for rejection near 391.00 and failed intraday rebounds. 🟡 Sideways Scenario If TSLA stays boxed between 381.00 and 391.00, expect chop and compression ahead of earnings. In that zone, theta decay and IV expansion risk can make premium bleed quickly unless momentum breaks one of those boundaries. While possible I just don't see this chopping sideways through earnings Earnings & Implied Move The chart shows a wide implied move window into earnings, with a green upside range near 406.00 and a red downside range near 354.00. IV should stay elevated into the report, but IV crush after earnings can punish anyone chasing premium too early, which is why I prefer defined-risk setups and quick reaction trades over holding through the event. My Outlook If I had to rank the probabilities today: 🔴 Bearish (my current lean) 🟢 Bullish breakout 🟡 Sideways consolidation That ranking can change quickly if TSLA reclaims 391.00 and especially 406.00 with momentum, but until then I’m respecting the downside risk and the possibility of a post-earnings overreaction. Side these scenarios can go both ways with a continuation and sell of lower and you can see overreactions on bullish runs this was just the way I chose to illustrate it As always, the Heavy Diligence Options Signals Indicator will be my primary tool for entries and exits. While these scenarios provide the broader roadmap, the indicator is designed primarily for day trading on shorter timeframes, helping identify higher-probability Call and Put opportunities. Combining those signals with key technical levels helps improve risk management instead of simply guessing the next move. Disclaimer: This is only my interpretation of the current chart and is not financial advice. Always do your own research, wait for confirmation, and manage your risk before entering any trade.
NASDAQ:TSLAShort
by heavydiligence
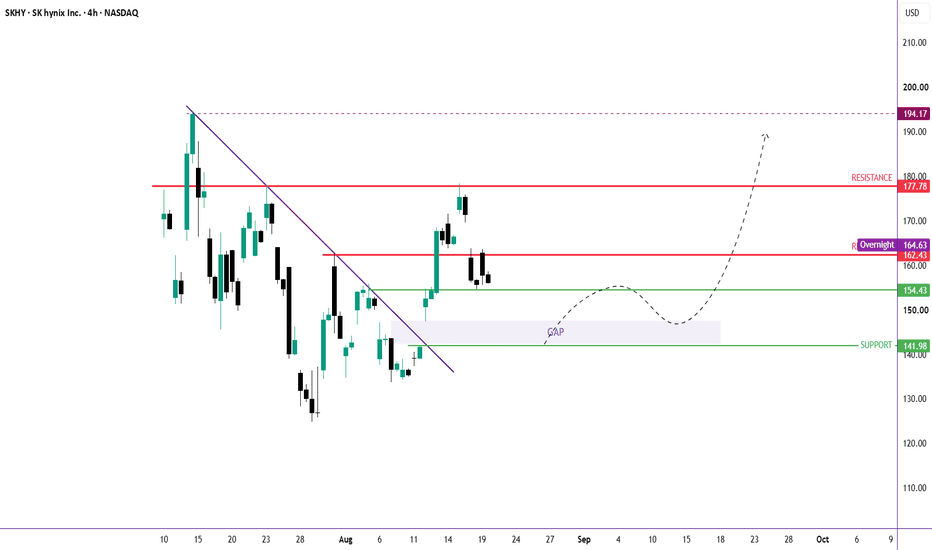
$SKHY (ADR): Experiencing the Same Selloff Pattern as $SPCX ?Looking at the chart, I noticed that NASDAQ:SKHY (ADR) is showing a remarkably similar selloff pattern to NASDAQ:SPCX . During the U.S. market open on July 17, NASDAQ:SKHY briefly broke below its IPO price of $149 , then staged a strong recovery and rallied back to test the 0.382 Fib retracement . The price action closely mirrors what we previously saw in $SPCX. In one of my Ideas last week, I wrote: "If NASDAQ:SPCX breaks below the $150 low, the next downside target is around $130. If selling pressure continues, the decline could even extend toward $84." Applying the same technical framework, if NASDAQ:SKHY fails to reclaim the $168 key level next week, the stock could be setting up for another leg lower, with the $135 area becoming the next major downside target. Another factor worth watching is the current valuation gap. NASDAQ:SKHY (ADR) is trading at roughly a 25% premium to its Korea-listed shares. On July 29 , the ADRs and the Korea-listed shares will become mutually convertible. This event is likely to compress that premium—either through a decline in the U.S.-listed ADR, an appreciation in the Korean shares, or a combination of both. That said, while the ADR may remain under pressure in the short term, the long-term fundamentals remain intact. The structural DRAM supply shortage and continued HBM demand have not changed, and I remain bullish on the memory semiconductor sector over the long run. If you also like planning your U.S. stock trades over the weekend—without constantly switching between Gold, Crypto, and stock trading apps—you should check out rToken. Unlike synthetic assets that rely on price oracles or on-chain liquidity pools, Bitget's rToken routes orders through broker channels directly to the real NASDAQ and NYSE order books, enabling 24/7 trading while preserving real U.S. equity liquidity with the efficiency of the crypto market. It brings together the best of both worlds: authentic stock market execution and around-the-clock crypto trading.
SShort
by GDJ_Jinn
Chart Whisperer | Intuitive Market AnalysisI don’t look at the markets the way everyone else does. I consider myself a bit of a chart whisperer—not because I have a secret algorithm, but because years of staring at the screens have given me a deeply personal, intuitive feel for price action. My trading style is anchored in reading the natural rhythm of the candles, and more often than not, the market moves exactly the way my intuition says it will. If you are looking for high-probability predictions and want to watch these setups play out in real-time, hit that follow button. Just to be completely transparent: I am absolutely not a professional financial advisor, and nothing I post is official trading advice. I’m simply a retail trader sharing my personal journey, ideas, and charts. Trade at your own risk, but feel free to follow along if you want to see how an intuitive approach tackles the market.
NYSE:NULong
by terencej
Home Depot, Inc. (HD) – Bearish Setup | Target: 332.60 #34Based on my Fibonacci ARC analysis, Home Depot, Inc. (HD) has generated a bearish setup. Price is expected to decline toward 332.60 if the current scenario remains valid. This analysis is based on the interaction between price and time using Fibonacci ARCs and represents a technical market scenario rather than investment advice.
NYSE:HDShort
by Mohamad_Gharib
112233445566778899101011111212131314141515161617171818191920202121222223232424252526262727282829293030313132323333343435353636373738383939404041414242
…999999

Made by humans

Select market data provided by ICE Data Services. Select reference data provided by FactSet. Copyright © 2026 FactSet Research Systems Inc.Copyright © 2026, American Bankers Association. CUSIP Database provided by FactSet Research Systems Inc. All rights reserved. SEC filings and other documents provided by Quartr.© 2026 TradingView, Inc.

More than a product
  • Supercharts
Screeners
  • Stocks
  • ETFs
  • Bonds
  • Crypto coins
  • CEX pairs
  • DEX pairs
  • Pine
Heatmaps
  • Stocks
  • ETFs
  • Crypto coins
Calendars
  • Economic
  • Earnings
  • Dividends
  • IPOs
More products
  • News Flow
  • Portfolios
  • Fundamental Graphs
  • Yield Curves
  • Options
  • Macro Maps
  • Pine Script®
Apps
  • Mobile
  • Desktop
Community
  • Social network
  • Wall of Love
  • Refer a friend
  • House Rules
  • Moderators
Ideas
  • Trading
  • Education
  • Editors' picks
Pine Script
  • Indicators & strategies
  • Wizards
  • Freelancers
  • Paid Spaces
Tools & subscriptions
  • Features
  • Pricing
  • Market data
  • Gift plans
Trading
  • Overview
  • Brokers
  • Brokers comparison
  • The Leap
Special offers
  • CME Group futures
  • Eurex futures
  • US stocks bundle
About company
  • Who we are
  • Space mission
  • Blog
  • Help Center
  • Careers
  • Media kit
Merch
  • TradingView store
  • Tarot cards for traders
  • The C63 TradeTime
Policies & security
  • Terms of Use
  • Disclaimer
  • Privacy Policy
  • Cookies Policy
  • Accessibility Statement
  • Security tips
  • Bug Bounty program
  • Status page
Business solutions
  • Widgets
  • Charting libraries
  • Lightweight Charts™
  • Advanced Charts
  • Trading Platform
Growth opportunities
  • Advertising
  • Brokerage integration
  • Partner program
  • Education program
Community
  • Social network
  • Wall of Love
  • Refer a friend
  • House Rules
  • Moderators
Ideas
  • Trading
  • Education
  • Editors' picks
Pine Script
  • Indicators & strategies
  • Wizards
  • Freelancers
  • Paid Spaces
Business solutions
  • Widgets
  • Charting libraries
  • Lightweight Charts™
  • Advanced Charts
  • Trading Platform
Growth opportunities
  • Advertising
  • Brokerage integration
  • Partner program
  • Education program
Look FirstLook First