Long
Long
AI Boom Stumbles: Chipmakers Lose Nearly 6%It took just one trading session for the semiconductor sector to lose nearly 6% of its value . On September 14, the PHLX Semiconductor Index fell 5.9%, while #NVIDIA shares dropped around 3.4% and #Micron fell more than 5% . The pressure spread across the broader technology market as well, with the Nasdaq ending the day lower.
The main trigger came from warnings issued by AI company executives. Following concerns about the risks of technology developing too quickly, investors seriously began asking for the first time in a while: what will happen to chipmakers if massive spending on artificial intelligence starts to slow down?
What spooked investors:
1. The market has started reassessing future demand . #NVIDIA and #Micron have been among the biggest beneficiaries of data center construction and growing demand for computing power.
Even a hint of a potential slowdown in AI investment is prompting investors to take a more cautious view of future processor and memory sales.
2. High interest rates are adding pressure . The yield on 10-year US government bonds briefly exceeded 5% , while expectations of another Fed rate hike remain elevated. The more expensive money becomes, the harder it is for technology stocks to justify high valuations.
3. Investors are taking profits after a strong rally . The semiconductor sector remains one of the year's top performers and, even after the sell-off, is still up around 57% since January . Against this backdrop, the emergence of a new risk provided a convenient reason to close some profitable positions.
The problem for the market is that current high valuations of technology companies already largely assume that AI investment will continue growing rapidly . As companies consistently increased spending on equipment and data centers, this scenario worked in favor of chipmakers. Now, the market has to consider the opposite possibility as well.
At the same time, it is still too early to talk about the end of the AI boom. Demand for computing power remains high, and a single day of selling does not change the long-term trend. However, the nearly 6% decline showed just how sensitive the sector has become to any doubts about the future pace of artificial intelligence spending.
According to FreshForex analysts, as long as pressure on chipmakers persists, it will be harder for #NQ100 to reach new highs . If US Treasury yields remain around 5% and concerns about a slowdown in AI investment intensify, pressure on the technology index could continue.  Short
Short
 Long
Long
 Short
Short
 Long
Long
 Short
Short

 Long
Long
Three Failed Recovery Tops Into Major Support — Selloff Slowing?Good Morning,
Hope all is well. Here is my TA on ACM.
What I’m Seeing
Looking at AECOM on the weekly chart, this setup is a little different from the distressed bottoming names we've been looking at.
The company itself is not fundamentally broken. Instead, the stock has gone through a major valuation reset, falling from roughly $135–$140 to around $64–$65.
Technically, the trend remains bearish. But I'm starting to see a change in the quality of that bearish trend.
I've marked three successive recovery tops:
Top #1 ~$137 → Top #2 ~$88 → Top #3 ~$78
Each rally failed at a lower level, so sellers clearly remained in control.
But now price is approaching a major historical support area around $60–$63, while my volume and momentum readings across the 4H, daily and weekly time frames appear to be shifting.
To me, the structure is moving from:
distribution → markdown → lower highs → selling exhaustion → potential accumulation
I'm not calling the bottom yet, but this is exactly where I start watching for one.
The Three Tops Tell the Story
The first top around $135–$140 marked the end of the previous uptrend.
From there, AECOM experienced a major breakdown.
The first recovery couldn't restore the trend and topped around $85–$90.
Then another attempt topped around $76–$80.
So structurally, there's no argument yet:
the weekly chart remains bearish.
But there's another side to that story.
Each successive bearish leg is bringing price closer to a major long-term support zone while the underlying momentum structure appears to be losing some of its strength.
That's what interests me.
$60–$63 Is the Most Important Area on the Chart
The horizontal level you've drawn around $60–$62 is critical.
This isn't simply an arbitrary support line.
It's roughly where AECOM established an important floor before the large 2022–2025 advance.
Now, after losing more than half its value from the 2025 peak, price has returned to essentially the same region.
For me, this becomes the decision zone.
I don't automatically assume $60 is the bottom.
But if sellers push AECOM into this area and cannot produce meaningful continuation beneath it, my interest increases considerably.
Declining Volume Could Be Telling Us Something
Your note about volume is particularly important.
During a healthy bearish continuation, I generally want to see sellers remain aggressive as price approaches new lows.
Instead, you're seeing volume begin to decline across several time frames while momentum starts shifting more positively.
That can mean fewer participants are willing to sell at increasingly depressed prices.
The relationship I'm watching is:
price falling + bearish momentum weakening + participation declining.
That's potentially seller exhaustion.
But declining volume by itself isn't enough. It can also simply mean nobody is interested.
What I eventually need is the second half of the equation:
buyers stepping in with expanding volume as price begins reclaiming resistance.
That's what would convert exhaustion into evidence of accumulation.
The Current Structure Isn't Accumulation Yet
I'd make one small adjustment to the annotation on the chart.
I would label $60–$70 as a "potential accumulation zone" rather than confirmed accumulation.
We don't have enough evidence yet to say larger buyers are definitely accumulating shares.
What we do have is an area where that process could begin.
If AECOM starts spending several weeks around $60–$70, volatility compresses, selling volume continues declining, and downside attempts repeatedly fail, then the accumulation thesis gets much stronger.
Even better would be:
high-volume downside test → no meaningful new low → strong recovery → higher low.
That would get my attention.
The First Level I Want Reclaimed: $70
At approximately $64.70, I don't need to chase the stock.
The first thing I want to see is price establish itself back above approximately $68–$70.
That would tell me the current low is beginning to attract demand.
After that, the $76–$80 region becomes extremely important.
That's approximately where Top #3 formed and where your highlighted distribution/consolidation region begins.
Reclaiming that would break the immediate sequence of lower highs.
So my early reversal sequence is:
$60–$63 holds → $70 reclaimed → higher low → $78–$80 reclaimed.
That would materially change my technical view.
$85–$90 Is the Bigger Trend Test
If the recovery gets through $80, the next area I'd watch is approximately $85–$90.
That's where Top #2 developed.
Breaking through there would be much more significant because we'd no longer just be talking about a bounce from oversold conditions.
We'd potentially have:
major low → higher low → higher high → trend reversal.
Beyond that, I'd watch roughly $100–$110, before thinking seriously about a return toward the old highs.
I wouldn't project $140 from today's chart.
There are several major layers of trapped supply that price would need to repair first.
Fundamentals — This Is Where AECOM Gets Very Interesting
The fundamental picture is much stronger than the price action initially suggests.
AECOM's latest Q3 report looked terrible on the surface: reported revenue fell 14% to $3.59 billion, the company reported a $76 million operating loss, and diluted EPS was -$0.65.
But there's an extremely important reason.
AECOM took a $337 million pre-tax charge related to the delayed completion of a Construction Management project that had originally been awarded in 2019. Management says the contract was entered under terms that would not meet the company's current risk policies.
That distinction matters enormously to my interpretation of this chart.
The market is dealing with a genuine financial hit—but the latest quarter does not appear to show the core design business collapsing.
Underlying Earnings Were Much Better
If I remove that specific project charge, the underlying quarter looks completely different.
AECOM says adjusted EBITDA excluding the charge would have been approximately $329 million, up 5%, while adjusted EPS would have been $1.49, up 11% year over year. The design business's net service revenue increased 4%, or 5% adjusting for one fewer working day.
That's why I find the stock's decline interesting.
We're potentially looking at a situation where:
the share price is behaving like the business has structurally deteriorated, while much of the earnings shock came from a specific legacy project.
That doesn't make the charge irrelevant. A $337 million loss is real.
But I distinguish between:
one problematic legacy contract
and
the core business losing competitiveness.
Right now, the evidence points much more toward the former.
The Backlog Is Probably the Strongest Fundamental Signal
This is what really gets my attention.
Despite the stock collapsing, AECOM's total backlog increased 13% to a record $27.8 billion.
The company generated a 1.6x book-to-burn ratio, including approximately $4.2 billion of wins during Q3. Its design pipeline also reached another all-time high.
That's a major piece of evidence against the idea that the underlying franchise is deteriorating.
Customers are still awarding AECOM work.
In fact, they're awarding it at a record pace.
That's why the fundamental and technical pictures are starting to create an interesting disconnect:
stock price ↓ sharply
while
backlog ↑ to record levels.
That divergence is something I would pay close attention to.
The Balance Sheet Isn't Signaling Distress Either
AECOM finished the quarter with approximately $1.0 billion of cash and $2.75 billion of debt. Management reported net leverage of roughly 1.5x.
That's important because it means I'm not looking at a heavily distressed balance sheet while trying to predict a technical bottom.
The company still has financial flexibility.
The project charge has reduced expected free cash flow, though.
AECOM now expects approximately $300 million of FY2026 free cash flow, compared with higher expectations before the project problem became apparent.
So there's real damage here.
It's just different from the company entering a fundamental collapse.
Guidance Explains Why the Market Is Nervous
Management reduced FY2026 reported guidance because of the Construction Management charge.
Adjusted EPS is now expected at approximately $3.95–$4.15, with adjusted EBITDA around $935–$965 million.
But this is another case where I want to separate the project from the underlying operation.
Excluding that charge, management still expects adjusted EPS of $5.90–$6.10 and adjusted EBITDA of $1.275–$1.305 billion, essentially consistent with its previous guidance.
That's a very important distinction.
The market is correctly pricing additional execution risk into the stock.
But if the problematic project is genuinely isolated and approaches completion as expected, there's potentially a large gap between current market sentiment and normalized earnings power.
There's Still a Risk I Wouldn't Ignore
The legacy project isn't finished yet.
AECOM expects substantial completion during fiscal Q2 2027, and the company is pursuing claims related to the work that could take years to resolve.
So I wouldn't automatically assume $337 million is the final word.
Construction contracts can produce additional surprises.
That becomes one of the biggest fundamental invalidations for my thesis:
another major charge → additional cash-flow deterioration → further guidance reduction.
If that happens while $60 breaks technically, I wouldn't fight the market.
Infrastructure Demand Is Still Strong
The broader business backdrop also remains attractive.
AECOM works across transportation, water, environmental, energy and building infrastructure. Its recent wins include major rail, water and transportation projects across several geographies, and the company continues investing in AI and its higher-value Advisory capabilities.
Management also reaffirmed its longer-term target of a 20%+ margin exit rate by FY2028 and 15%+ adjusted EPS CAGR from FY2026 through FY2029, excluding the Construction Management charge.
Those are targets, not guarantees.
But they tell me the internal outlook for the core business remains very different from what the current share-price trend might imply.
Why This Setup Interests Me
This is probably the core of my thesis.
Technically I'm seeing:
$140 peak → violent markdown → Top #2 → lower low → Top #3 → another lower low → bearish momentum weakening near major historical support.
Fundamentally I'm seeing:
one major legacy-project problem → reduced reported earnings and cash flow
but underneath that:
record backlog → strong bookings → positive core design growth → underlying EPS growth → manageable leverage.
That creates the type of disconnect I like watching.
The chart hasn't confirmed the bottom.
But unlike some distressed turnaround stocks, I don't necessarily need the underlying business to recover—I mainly need the market to stop pricing the company as though the recent project problem represents permanent deterioration.
My Bullish Scenario
My preferred sequence would be:
$60–$63 support holds → downside volume continues contracting → momentum improves → $68–$70 reclaimed → higher low → $78–$80 breakout.
If that happens, I start looking toward $85–$90.
A successful reclaim of that area would be particularly important because it would eliminate Top #3 and begin challenging Top #2.
From there, I think $100–$110 becomes a reasonable larger recovery area.
But I want price to earn each step.
My Bearish Scenario
The bearish scenario is very clear.
If AECOM decisively breaks $60, particularly with expanding volume and renewed downside momentum, I would not interpret that as accumulation.
That would tell me the current support hasn't absorbed supply.
Fundamentally, I'd be especially concerned if that breakdown occurred alongside another Construction Management charge, weaker backlog, lower bookings, or another reduction in underlying guidance.
That combination would tell me the market knows something more serious is changing.
My Bias
I'm neutral-to-cautiously bullish around $60–$65, but I'm not calling the bottom yet.
What makes this one particularly interesting to me is that the technical deterioration looks substantially worse than the underlying operating picture.
I'm seeing:
Price approaching major multi-year support around $60–$63
Three progressively lower recovery tops
Bearish trend strength beginning to moderate
Volume declining across multiple time frames
Momentum beginning to improve
A core business that is still growing
Record $27.8B backlog
1.6x book-to-burn
Underlying adjusted EPS growth despite the project problem
A relatively manageable 1.5x net leverage position
So for me:
$60–$63 = potential accumulation / decision zone.
$68–$70 = first evidence buyers are gaining control.
$78–$80 = meaningful structural confirmation.
$85–$90 = major reversal test.
I wouldn't buy simply because AECOM has fallen 50% from its highs. I want to see sellers attack $60–$63 and fail to achieve meaningful downside progress.
If that happens while volume dries up, momentum continues improving, and price subsequently starts reclaiming $70 and $80, then I'll have much stronger evidence that what currently looks like a falling knife is actually transitioning into a long-term accumulation process.
Trade Safely!
Enjoy!  Long
Long
Here's Micron's Chart as the Firm Prepares to Release EarningsMicron NASDAQ:MU soared nearly 900% over 12 months to a $1,255 all-time high in June, then pulled back more than 25% to $924.03 at Monday's close. Let's see what its chart and fundamentals can tell us as the memory-chip designer prepares to release earnings at month's end.
Micron's Fundamental Analysis
MU plans to unveil fiscal Q4 results after the bell on Sept. 30, with the Street looking for $31.28 in adjusted earnings per share on $50.78 billion of revenue.
Results like that would represent a 932.3% gain from the $3.03 in adjusted EPS that Micron reported in the same period last year while reflecting 349% in annual sales growth. Those are not misprints.
Readers might also recall that in late June, Micron posted $25.11 in fiscal Q3 adjusted EPS on $41.46 billion of revenue. That easily beat Wall Street's expectations, while representing 1,214.7% in y/y adjusted EPS gains and 345.8% in year-over-year sales growth.
This time around, 27 of the 32 sell-side analysts that I know of who cover MU have revised their earnings estimates higher since the quarter started, while five have left their numbers unchanged. There have been exactly zero downward revisions.
What does MU's chart say? Let's take a look.
Micron's Technical Analysis
Here is MU's three-month chart as of Monday morning (Sept. 14):
Readers will first note that Micron first developed a falling-wedge pattern of bullish reversal from June into early August, shaded in tan at the chart's left.
In attempting to break out of that pattern (and failing a few times), the stock then created what looks like a sloppy inverse-head-and-shoulders pattern of bullish reversal.
Shaded in green at the chart's center and right, this pattern has an upside pivot of around $1,035 vs. the $924.03 that MU closed at on Monday.
Readers will also see that Micron retook its 21-day Exponential Moving Average (or "EMA," marked with a squiggly green line) in late August.
This 21-day line then acted as support for almost two weeks, which likely added some swing-trader activity to the bid side.
The stock then took back its 50-day Simple Moving Average (or "SMA," marked with a blue line). That probably got a few of professional money managers to increase exposure.
That said, Micron pulled back as much as 7.5% intraday Monday, falling below both its 21-day and 50-day lines as tech stocks sank as artificial-intelligence leaders called for slowing down the technology's development.
That's not a very positive development, but some buyers showed up during the sell-off and MU trimmed the worst of its losses.
What now? Well, the bulls need Micron to go after that $1,035 pivot. Conversely, the bears will want to see MU stage a definitive failure to hold those moving averages. (Micron popped back above its 50-day line at last check Tuesday morning.)
Turning to the other technical indicators above, Micron's Relative Strength Index (the gray line marked "RSI" at the chart's top) has remained in its range's upper half, but isn't sending out bullish signals.
Meanwhile, the stock's daily Moving Average Convergence Divergence indicator (or "MACD," denoted by blue bars, a black line and a gold line at the chart's bottom) is no longer so bullish.
For instance, the 9-day EMA's histogram went positive on Aug. 6, but gave that move back amid Monday's sell-off. The histogram now teeters indecisively.
Separately, the stock's 12-day EMA (the black line) has suddenly slid below its 26-day EMA (the gold line). That's bearish, but Micron doesn't seem to be accepting that move, either.
It's almost as if traders are waiting for something ... and that something might be Micron's upcoming earnings.
In the meantime, we'll have to wait to see if MU can definitively take back that 50-day line or not. Almost nothing at the moment could be more important technically.
(Moomoo Technologies Inc. Markets Commentator Stephen "Sarge" was long MU at the time of writing this column.)
This article discusses technical analysis, other approaches, including fundamental analysis, may offer very different views. The examples provided are for illustrative purposes only and are not intended to be reflective of the results you can expect to achieve. Specific security charts used are for illustrative purposes only and are not a recommendation, offer to sell, or a solicitation of an offer to buy any security. Past investment performance does not indicate or guarantee future success. Returns will vary, and all investments carry risks, including loss of principal. This content is also not a research report and is not intended to serve as the basis for any investment decision. The information contained in this article does not purport to be a complete description of the securities, markets, or developments referred to in this material. Moomoo and its affiliates make no representation or warranty as to the article's adequacy, completeness, accuracy or timeliness for any particular purpose of the above content. Furthermore, there is no guarantee that any statements, estimates, price targets, opinions or forecasts provided herein will prove to be correct.
Moomoo is a financial information and trading app offered by Moomoo Technologies Inc. In the U.S., investment products and services on Moomoo are offered by Moomoo Financial Inc., Member FINRA/SIPC.
TradingView is an independent third party not affiliated with Moomoo Financial Inc., Moomoo Technologies Inc., or its affiliates. Moomoo Financial Inc. and its affiliates do not endorse, represent or warrant the completeness and accuracy of the data and information available on the TradingView platform and are not responsible for any services provided by the third-party platform.  Long
Long
 Long
Long
 Long
Long
Long 
 Long
Long
Netskope, Inc. (NTSK) Benefits From AI Security DemandNetskope, Inc. (NTSK) provides cloud-based cybersecurity that helps companies protect users, data, applications, and AI activity. Its Netskope One platform combines secure web access, cloud security, data protection, and zero-trust network access. Growth comes from companies replacing older security tools, expanding cloud and AI use, protecting sensitive data, and adopting unified security platforms.
On the chart, NTSK printed a confirmation bar with increasing volume as price moved above the .236 Fibonacci level and into the momentum zone. A trailing stop can be established using Fibonacci levels on the Fibonacci snap tool, helping manage risk while allowing momentum to continue.  Long
Long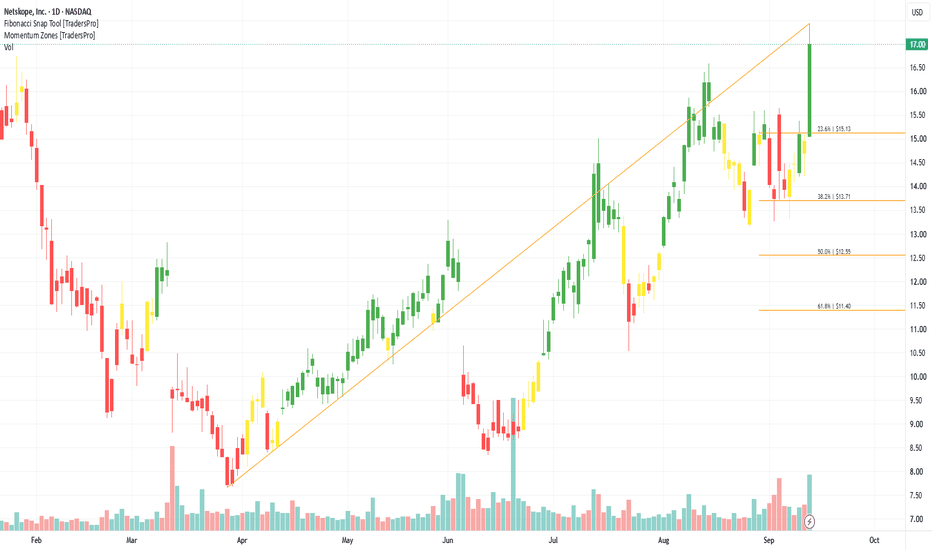
 Short
Short

Did you spot this? And why QCOM should be on your watchlist.Remarkable!
This stock has produced relative strength (RS), and its SMA stack is setting up WHILE the market is producing more weak stocks than strong ones. (See my other posts/ideas about SOX, NDX, sectors and seasonality.)
I do not take large long positions—even when a stock looks good—if the overall market is not moving in the right direction. I do not need to be the penguin left behind and freezing to death. I am happy swimming with the crowd—and then making my picks. But when a stock shows strength during such a phase, it has a good chance of becoming one of the winners during the market’s next up-leg.
Early-to-mid momentum expansion emerging from a repaired long-term base: QCOM has reclaimed its fast/intermediate structure with strong RS, accelerating moving-average momentum and unusually clean upside participation, but the trend remains structurally incomplete until price decisively absorbs SMA100 near $185.60.
60 Seconds Read — QCOM
1️⃣ What do we see?
QCOM has moved from prolonged weakness into Momentum Expansion.
Price is above EMA8, SMA20, SMA50 and SMA150; 5-day and 10-day momentum rank at P88/P90; RS is bullish and rising; and participation is exceptionally clean at 6 high-volume up days versus 0 down.
The unfinished business is SMA100 at $185.60, still about 3% overhead.
2️⃣ Thesis
This looks like a genuine character change, not a routine bounce.
Buyers control the short/intermediate trend and independent RS/volume evidence confirms that control. The long-term structure is simply lagging the momentum transition.
3️⃣ What validates the thesis?
The strongest confirmation would be:
continued holding above $167–169;
RS remaining in uptrend;
price accepting above $185–186;
volatility continuing to produce upward progress rather than rejection.
That would convert an emerging expansion into a much more complete trend.
4️⃣ What invalidates the thesis?
The real failure is not a normal EMA8 pullback.
It is loss of the $167–169 reclaimed structure accompanied by RS deterioration and accelerating downside volatility.
That combination would show the apparent trend transition failed.
Bottom line: QCOM has a real multi-signal momentum edge. Watch the volatility regime, and treat $185–186 as the next structural proof point rather than an automatic barrier.  Long
Long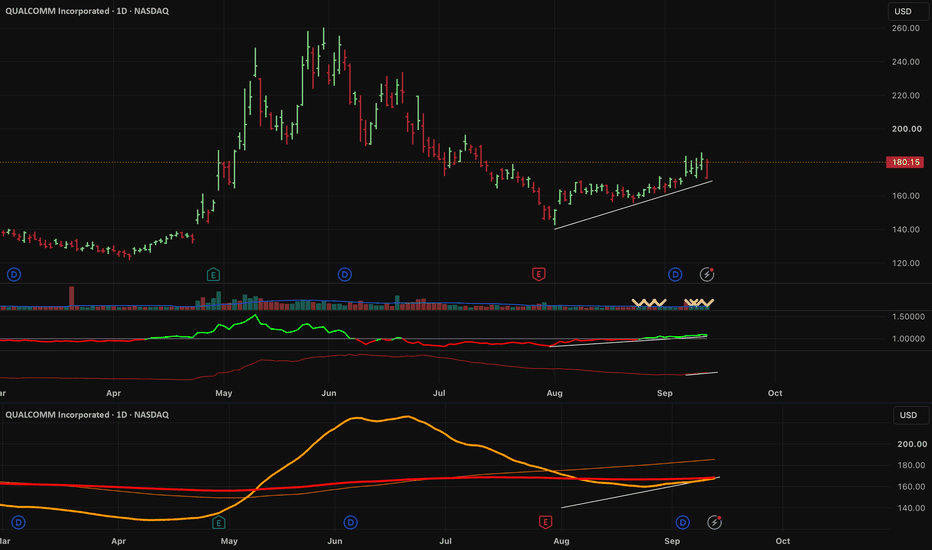
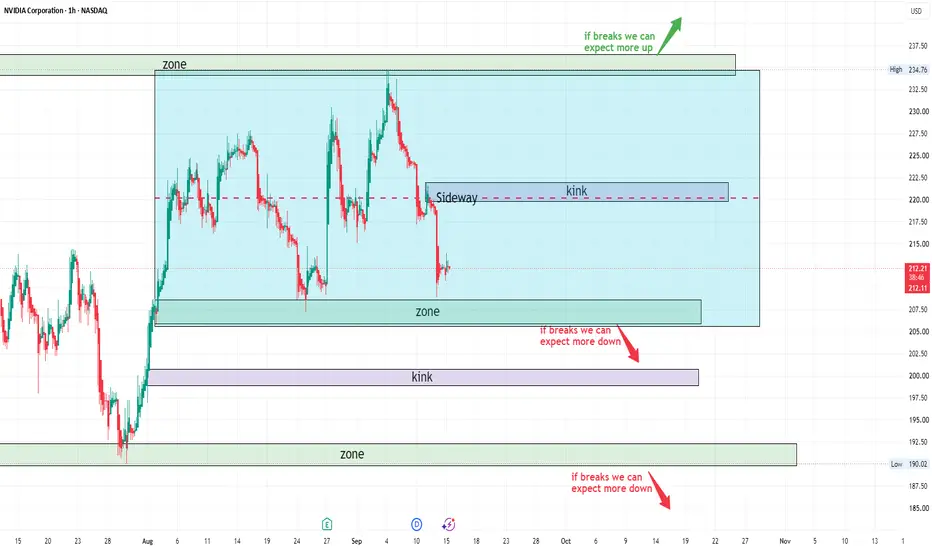
NVDA Lost 211.00 To 208.93 And Closed Back Above It.NVDA Lost 211.00 To 208.93 And Closed Back Above It.
NVDA followed Monday's gap with another 3.36% down day, breaking the 211.00 shelf to 208.93 before recovering to close near 212.35 - back above the level it lost and short of the 207.59 structural target underneath. Price sits at 212.53 this morning, still beneath 213.43 and 214.58, the two levels it gapped through to start the week. Hourly volume is in the 4th percentile of its range with an NR7 compression flag active, while the 4H carries a long-leaning surface on elevated volume - a split, on a chart that has broken four named levels in two sessions. Neutral.
Resistance: 213.43 - first overhead, lost Monday
Key resistance: 214.58 - the gap level that failed
Current price: 212.53
Support: 211.00 - the shelf that held on a closing basis
Key support: 208.93 - Monday's low
Structural floor: 207.59 - the next structural level
Two paths from here:
It loses 208.93 and 207.59 finally gets tested. Taking out Monday's low would complete the move the gap started and put the structural level directly in play, with 204.82 and 202.11 beneath it. Four broken levels in two sessions is momentum, and momentum does not usually stop at a shelf it already lost once.
It holds 211.00 and repairs toward 214.58. Two consecutive sessions of closing back above a broken level is how a base starts, and reclaiming 213.43 then 214.58 would put 217.73 back on the board. Nothing is repaired until 214.58 is back.
Compression at bottom-decile volume right after a violent break usually resolves quickly. 208.93 below and 213.43 above are the two levels that end the argument.
Built with SYNTHESIS v3.3 | SOM / ACE / IMP / SYNTHESIS
Study, not financial advice.