Long
Long
SpaceX Gains Weight in the Nasdaq 100
Ion Jauregui – Analyst at ActivTrades
SpaceX faces a significant increase in its weighting in the Nasdaq 100, which could rise approximately from 1.28% to 2.82% in the September rebalancing.
The adjustment is mainly due to the increase in free float following the release of more than 1 billion shares that remained subject to restrictions after the IPO.
The higher weighting will force funds and ETFs that replicate the Nasdaq 100 to increase their exposure to SpaceX. JPMorgan had previously estimated that a weighting close to 2.25% could generate around $15.5 billion in net purchases.
However, the increase in passive demand will coincide with new share unlocks over the coming months, which will also increase the supply available in the market.
Fundamental Analysis
SpaceX maintains a strong growth rate, supported mainly by Starlink, while continuing to increase investment in Starship and technological infrastructure.
The company reported revenue of approximately $7.8 billion in the second quarter of 2026, with year-on-year growth of close to 92%, while adjusted EBITDA exceeded $3.5 billion.
The main challenge remains the high capital intensity. The company’s valuation, above $2 trillion, incorporates very high growth expectations, meaning that the performance of Starlink, Starship, and the ability to turn investment into profitability will be key over the coming quarters.
Technical Analysis of SpaceX, SPCX
The SPCX price has maintained a sideways structure since August 11 and closed at around $151.21, while in premarket it is trading near $147.26.
The price is approaching the 25% Fibonacci retracement, calculated from the move that began on July 14, with a technical reference around $148.
The MACD maintains a slightly positive trend, although with a low-amplitude histogram, while the RSI is close to 59%, showing a progressive recovery in momentum since mid-August.
The $148 area remains the immediate support, while a recovery above $155 would reinforce the bullish continuation scenario.
Technical Analysis of the Nasdaq 100
The Nasdaq 100 maintains a positive medium-term structure, although with lower momentum in recent sessions.
The 29,100 to 29,200-point area represents the immediate technical support, while the 29,550 to 29,650-point area represents the main short-term resistance.
The increase in SpaceX’s weighting will have a direct effect on vehicles that replicate the index, although its aggregate impact on the Nasdaq 100 will remain limited compared with the performance of the major technology companies.
Outlook
The rebalancing represents a favorable technical catalyst for SpaceX in the short term, by generating additional demand from passive funds. However, the progressive increase in free float and upcoming share unlocks could offset part of this effect.
The $148 area will be the main technical reference in the short term.
*******************************************************************************************
The information provided does not constitute investment research. The material has not been prepared in accordance with the legal requirements designed to promote the independence of investment research and such should be considered a marketing communication.
All information has been prepared by ActivTrades ("AT"). The information does not contain a record of AT's prices, or an offer of or solicitation for a transaction in any financial instrument. No representation or warranty is given as to the accuracy or completeness of this information.
Any material provided does not have regard to the specific investment objective and financial situation of any person who may receive it. Past performance and forecasting are not a synonym of a reliable indicator of future performance. AT provides an execution-only service. Consequently, any person acting on the information provided does so at their own risk. Political risk is unpredictable. Central bank actions can vary. Platform tools do not guarantee success.
Simple Investing: Stop Putting All Your Money Into One Entry
One of the most common mistakes investors make is surprisingly simple:
They invest all of their planned capital at a single price.
They find a stock they like, decide that the current price looks attractive, and enter the entire position at once.
But what happens if the market moves lower?
Suddenly, there is no flexibility left.
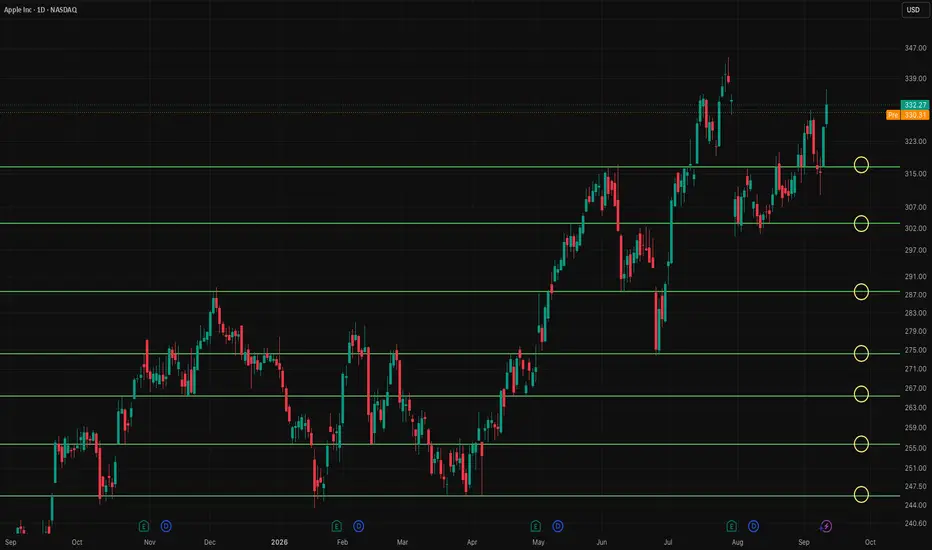
Let’s use Apple (AAPL) as a simple example.
🎯 You Don’t Need to Find the Perfect Entry
Looking at the chart, we can identify several important price zones where Apple has previously reacted.
These areas can act as potential support and resistance levels .
Instead of asking:
“What is the perfect price to buy Apple?”
A more useful question could be:
“At which price levels would I be interested in gradually building a position?”
That small change in thinking can make investing much more structured.
💰 Divide Your Capital Instead of Your Attention
Imagine you have a certain amount of capital that you have already decided to allocate to Apple.
You don’t necessarily have to deploy all of it immediately.
Instead, that capital could be divided into several portions.
On the chart, we can see potential areas around:
$316 → $303 → $288 → $275 → $266 → $256 → $246
These aren’t predictions that Apple will reach those prices.
And they aren’t automatic buy signals.
They are simply predefined areas that can help create a plan before emotions enter the equation.
If the stock continues higher, you already have exposure.
If it moves lower, you still have capital available to evaluate opportunities at lower levels.
📉 A Falling Price Doesn’t Automatically Mean a Better Investment
There is one important distinction.
Dividing capital across different levels does not mean blindly buying every time a stock falls.
Support can break.
Market conditions can change.
And the fundamental reason for owning a company can change as well.
Technical levels should therefore be viewed as part of a broader decision-making process — not as guarantees.
🧠 The Real Advantage Is Having a Plan
Investing doesn’t always need complicated indicators or dozens of signals.
Sometimes a chart, a few meaningful price levels and a predefined capital allocation plan are enough to bring structure into the process.
Instead of trying to predict the exact bottom, you prepare for multiple possibilities.
If price stays strong → you already have exposure.
If price pulls back → you know which areas you want to reassess.
If the market structure changes → you can reconsider the plan.
That’s a very different approach from putting everything into one entry and hoping the timing was perfect.
The takeaway
Don’t obsess over finding the perfect entry.
Identify meaningful areas, decide beforehand how much capital you are willing to allocate, and keep enough flexibility to react if the market gives you another opportunity.
Sometimes, investing can be much simpler than people make it.
This analysis is for educational purposes only and does not constitute financial or investment advice. The levels shown are examples based on the chart and should not be interpreted as recommendations to buy or sell Apple.  Long
Long
What Does ASML See in Xanadu After an 80% Crash?Xanadu Quantum Technologies (XNDU) reached public markets in March 2026 through a merger with Crane Harbor Acquisition Corp, at an initial enterprise value of $3.1 billion. Shares peaked at $42.44 in April before the deep-tech valuation reset arrived. Elevated policy rates drained risk capital from pre-revenue science companies, and investors rotated toward near-term cash generation. By September 2026, the stock traded near $8.62, roughly 80% below the high, with market capitalization around $2.62 billion. Pending insider lockup expirations continue to cap any recovery in share price momentum.
The income statement explains the skepticism. Second-quarter revenue reached $1.5 million, up from $1.1 million a year earlier, sourced mainly from algorithmic research contracts and software grants. Net loss widened to $42.1 million, with research and development alone consuming $19.7 million. Liquidity, however, remains unusually strong for a company at this stage. Xanadu held $312.8 million in cash at the end of June and raised a further $67.2 million through a synthetic equity facility with Yorkville Advisors. Ottawa added CAD $195 million under Project OPTIMISM, funding a sovereign 158,000-square-foot photonic fabrication plant in Ontario.
The industrial side of the story moves in the opposite direction from the share price. ASML agreed to optimize deep-ultraviolet lithography for photonic quantum hardware, targeting smoother waveguide sidewalls and lower Rayleigh scattering. That work attacks the single metric that governs error-correction overhead, which Xanadu aims to cut from 24.1x to 1.0x by 2030. Tower Semiconductor now produces ultra-low-loss silicon nitride wafers on commercial lines, while EV Group refines wafer bonding. AMD and Xanadu launched Backline, linking quantum processors to EPYC CPUs and adaptive FPGAs inside a sub-three-microsecond feedback loop. Fifty patent families across the US and Europe protect the underlying continuous-variable architecture.
Software mindshare completes the case. PennyLane commands over 35,000 active users, 200,000 monthly downloads, and a 30.8% developer market share, which positions Xanadu as the default toolchain regardless of which hardware eventually wins. The roadmap targets 200 logical qubits by 2029 and more than 1,000 by 2031, a timetable that also drives government post-quantum cryptography planning. The equity market prices quarterly losses, while ASML, Tower, and AMD price a decade of infrastructure. Investors with long horizons face a widening gap between the tape and the technical execution.  Long
Long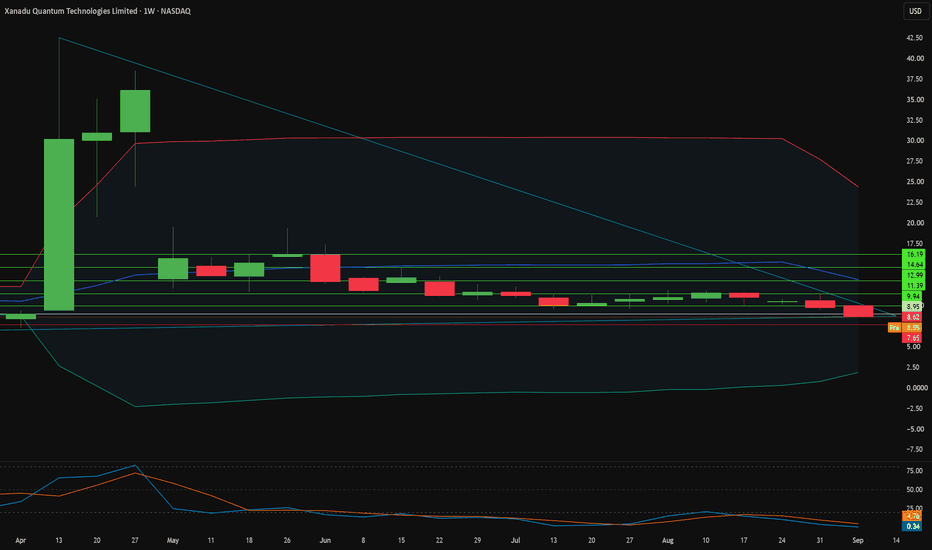
 Long
Long
AI Over-reaction to non-infrastructure changes (SNDK)Week 9/14/26:
- Semi / AI pull back into near area support levels on 4H and daily (breaking news of AI leaders "pulling back on AI models". This does not affect infrastructure, only their public models capabilitie; appears to be an over reaction going into a highly volatile week (FOMC, AI news, Iran escalations, Russia escalations, Oil and 10year rising outside of ranges).
Expectations:
Look for price at support levels around 1475 - 1500, and expecting a bump back to the 1700s around thursday or friday after FOMC rates being unchanged. (estimated return to prior week area based; assumption that Fed rate is unchanged)
- This is a drop and rally; over reaction to a surface level change, not a fundamental infrastructure change in demand. (AI model "pullback" is not a change to the demand for Data centers, chips, memory etc. Nothing from any of these frontier models or hyperscalers said they are reducing demand or losing contracts. The downside here is that this may take more than a week to return to 1700s region)
Entry Ideas:
- Play; 1DTE or 0DTE options (Depending on price) plays based on momentum going into the first hour of the trade day. (Thurs and Fri).
--- This can be a call or put nakeds, or spreads, and ENTIRELY DEPENDS on momentum going into thursday.
-----Why thursday? because SNDK options are expensive and I dont want to burn thousands for a single option to theta. We play 1DTE and 0DTEs here because SNDK has an ATR of $50+ a day right now and makes for good momentum trading.
- Will have to wait to see how everything reacts through Wednesday and Thurs premarket. My estimates are it will pop back towards the 1700s, so biased Long.  Long
Long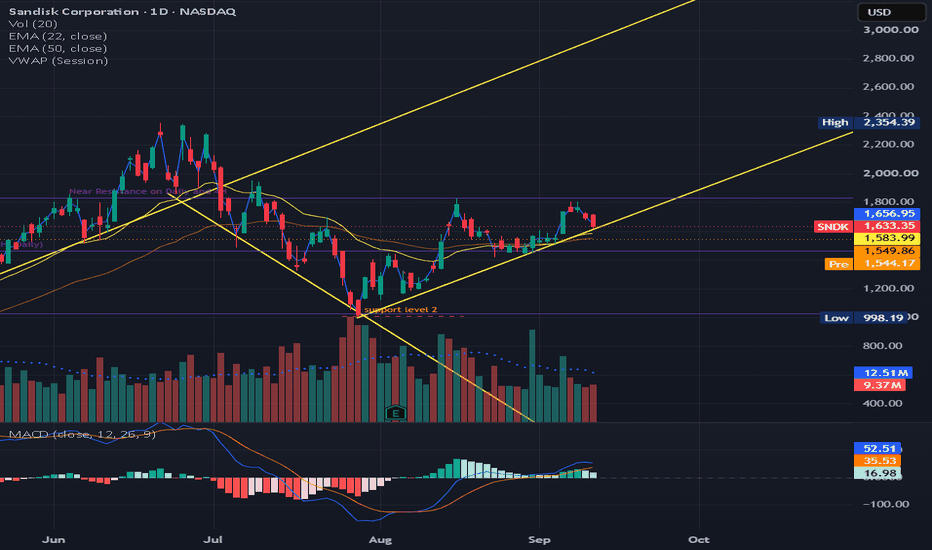
 Long
Long
 Long
Long
 Long
Long

Oracle's mounting debt spark investor skepticismORCL | 4H Technical Analysis — Sep 14, 2026
Oracle whipsawed sharply after its fiscal Q1 earnings release, initially spiking as much as 10.3% intraday before reversing to close down 1.74% at 150.28, leaving the stock down 4.39% over the past two years despite the headline growth numbers. The reversal reflects a genuinely split earnings picture. Revenue grew roughly 30% YoY, and the core cloud infrastructure business surged 121%, with remaining performance obligations reaching $664 billion at quarter-end after more than $30 billion in new contracts signed during the quarter alone. On the surface, this confirms Oracle's transformation into a serious cloud infrastructure competitor.
The cost of that growth is what spooked the market on the reversal. Oracle poured $28.5 billion into capital expenditures last quarter, more than triple the prior year's pace, pushing free cash flow to negative $5.4 billion. Total debt has climbed to roughly $156 billion, and gross margin compressed to 61% from 66.3% the previous quarter. The debt chart shows this is not a one-quarter anomaly. Oracle's total debt has roughly doubled since Q4 2024, a direct byproduct of the aggressive infrastructure buildout needed to service its cloud contract backlog.
ORCL spent January through April consolidating in a wide 140 to 170 range before a sharp cloud-driven rally in May and June pushed price to a high near 250. That spike proved unsustainable, and price fell hard through July to a low near 115, effectively unwinding the entire cloud euphoria rally. Since that July low, price has climbed steadily inside a well-defined ascending channel, reclaiming the 140 to 170 range and now trading around 150, back inside the same box that contained price for the first four months of the year.
The EMA cross shows the fast EMA at 153.33 just above the slow EMA at 149.13, a mildly bullish but tightly compressed setup that reflects the current indecision. RSI at 46.56 sits almost exactly at the midpoint, offering no directional edge either way. Price is currently pressing against the lower boundary of the old range near 150, the same level where the two-year chart shows Oracle essentially unchanged despite the intervening volatility.
Key levels to watch:
Resistance: 170 (top of multi-month range) / 200 (psychological level, June retracement zone)
Support: 140 (bottom of multi-month range) / 115 (July swing low)
Bear case: The margin compression from 66.3% to 61%, negative free cash flow, and debt load nearly doubling in under two years suggest Oracle is buying growth at a steep financial cost, and the earnings day reversal from plus 10% to a net loss shows the market is already uneasy about that trade-off. A break below the ascending trendline and the 140 range floor would confirm the growth story is losing credibility with investors and open a retest of the 115 July low.
Bull case: The underlying growth numbers, 121% cloud infrastructure growth and a $664 billion order backlog, are difficult to dismiss, and if Oracle can show the capex spending translates into sustained revenue conversion in coming quarters, the current pullback becomes a buying opportunity within the still-intact ascending channel. A reclaim of 170 would resume the broader uptrend from the July low.
Bias is neutral to cautiously bullish while price holds above the ascending trendline near 140, with the market currently undecided on whether Oracle's cloud growth justifies its deteriorating margins and ballooning debt. The earnings-day reversal is the key signal here. Strong headline numbers weren't enough to hold gains once investors examined the balance sheet details, and that skepticism needs to clear before the stock can push convincingly back toward 170 and beyond.
HPE – DELL Made Its Move. HPE Is Sitting Under 64 With Catch-Up HPE – Three Tests of 64. DELL Already Ran. Flat Top Breakout Loading.
─────────────────────────────────
HPE – Flat Top Breakout | Swing
DELL is doing the heavy lifting in AI servers right now. HPE is the same sector, same catalyst, and it hasn't broken out yet. 64 is the old high. It's been tested three times. That's the trigger.
─────────────────────────────────
THE SETUP
─────────────────────────────────
Three tests of the same resistance is a flat top. Each time price comes back to 64 and sellers show up, there are fewer of them. That's what a flat top breakout is – supply getting absorbed until there's nothing left overhead.
This is a top setup in the right sector. DELL made its move first. HPE is the laggard with catch-up to do, and laggards in a hot group don't stay laggards for long when the leader is holding its gains.
Watch the whole pack: DELL, SMCI, HPE. Same trade, different stages.
─────────────────────────────────
THE CATALYST
─────────────────────────────────
Sep 2 earnings: EPS $1.11 vs $0.92 expected. Revenue $12.2B, up 34%. Orders up 42%. AI systems orders $2.4B, up over 30% sequentially. Guidance raised for both fiscal 2026 and 2027.
Orders are growing 3.5x faster than revenue – that's a record backlog, and the supply constraint is component availability, not demand.
Stock fell on the print, then ripped to a record $61.62 on Sep 11. That's a post-earnings reversal into a flat top. Next earnings Dec 3.
─────────────────────────────────
TRADE PLAN
─────────────────────────────────
Entry: Break and hold over 64 with volume
Stop: Below the breakout day low – if it falls back under 61 the breakout failed
Pattern: Flat top breakout, three tests of resistance
Timeframe: Swing
Not in yet. Waiting for 64 to go.
─────────────────────────────────
THE RISK
─────────────────────────────────
Stop is defined. If 64 breaks and holds, the setup is clean. If it rejects a fourth time and rolls over, I'm not interested – four tests without a break starts looking like distribution, not accumulation.
Stock is up roughly 130% on the year. Extended names can gap against you. Size like it can move 5% either way on any given day, because it just did.  Long
Long
 Long
Long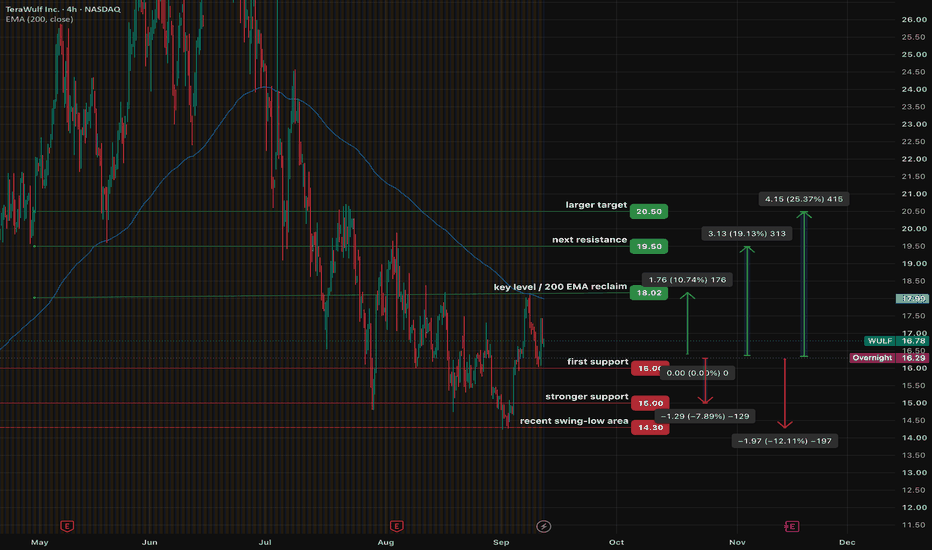
 Long
Long
 Long
Long
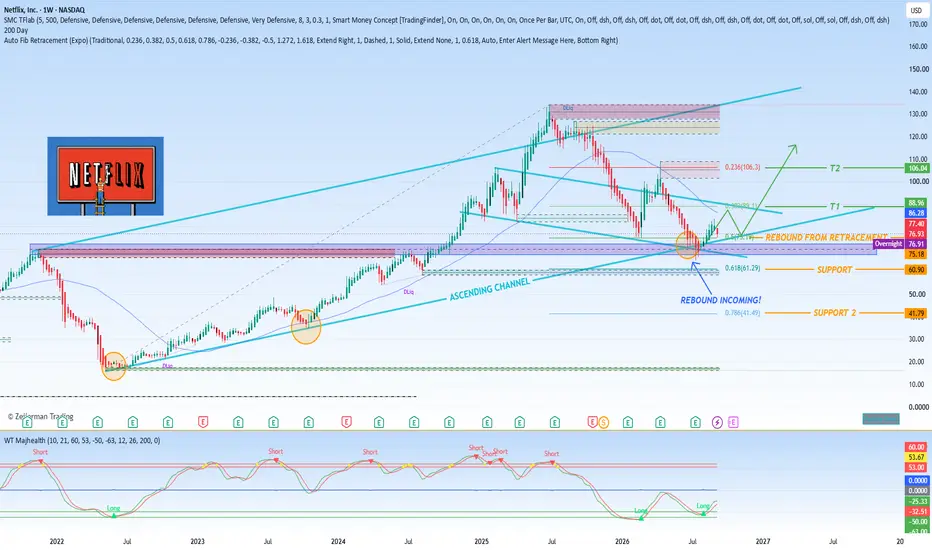
70.00 is still our support #NFLXNetflix (NFLX) grew revenue faster over the past twelve months than Amazon, Apple, Comcast, or Disney and earned a wider operating margin than all of them except Apple. Its shares still finished those twelve months down 38.9%, the last of the five. The fall has not made the stock cheap. That is the mismatch worth explaining.
Is There Anything Left for Netflix to Grow Into?
When the question turns to whether Netflix still has room to expand, management’s answer is unambiguous: most of the opportunity has not yet been claimed. According to the company’s CFO, Netflix has reached less than 45% penetration of an estimated 800 million addressable households worldwide. That leaves more than half of the potential market still outside its subscriber base, suggesting that the core streaming business alone has a substantial runway remaining. In management’s view, Netflix is not nearing a ceiling; it is still working through the early chapters of a much larger global opportunity.
That optimism extends beyond traditional streaming. Netflix’s live events are expected to consume only about 5% of the 2026 content budget and to generate roughly 1% of total viewing hours. On those measures alone, live programming might look like a minor part of the business. But Netflix credits live events with driving six of the ten biggest new-member sign-up days over the past five years. That suggests their real value is not measured simply in hours watched. They act as acquisition engines, creating urgency, cultural moments, and reasons for people to subscribe or re-engage with the service.
Cloud gaming is another area where Netflix sees future potential. Management says monthly players for its cloud games have risen elevenfold since the company scaled up the effort in October 2025. The business is still relatively young, and it is not yet clear how large it will become, but the pace of growth gives management reason to believe it can develop into a more meaningful part of the broader Netflix ecosystem over time.
Advertising is likewise positioned as a major source of untapped growth. Netflix’s ads plan is expected to generate about $3.00 billion in advertising revenue in 2026. Against the company’s total 2026 revenue forecast of roughly $51.20 billion, that remains a relatively small slice. Management describes the gap between what an advertising-supported member is currently worth and what that member could eventually be worth as near-term unrealized revenue growth. In other words, the ads tier is already contributing, but Netflix believes it has not yet come close to extracting its full monetization potential.
So what does Netflix need to deliver next? The answer is not simply a repeat of the last twelve months. The CFO has guided full-year 2026 top-line growth of 13% to 14%. Netflix has stopped asking to be paid for acceleration. The company is no longer seeking credit merely for the promise of faster growth; it now has to show that its investments in live events, cloud gaming, and advertising can translate into durable revenue and subscriber gains.
The next phase for Netflix is therefore less about proving that opportunity exists and more about proving that it can capture that opportunity efficiently. The runway may still be long, but the market will judge the company on execution. Management has laid out the case that there is plenty left to grow into. The task now is to convert that potential into measurable results.  Long
Long
JPMorgan Upgrades Meta Platforms to Overweight!JPMorgan has upgraded Meta Platforms to Overweight from Neutral, raising its price target to $820 from $640, citing the company's aggressive push into frontier AI models and AI agents as a new avenue for growth that extends well beyond its core advertising business. The upgrade reflects growing analyst confidence that Meta is positioning itself as a serious competitor in the broader artificial intelligence landscape, not just as a social media and advertising company.
The Upgrade and Price Target
The upgrade was announced by JPMorgan analyst Doug Anmuth, who raised his price target on Meta shares to $820 from $640 — a substantial increase that implies meaningful upside from current levels. The shift to Overweight signals that JPMorgan now views Meta as a stock worth overweighting in portfolios relative to its sector peers, a notable change from the Neutral stance the firm had previously held.
Meta's Superintelligence Lab Delivers
At the heart of the upgrade is Meta's superintelligence lab, which Anmuth said has essentially delivered on its goal of reaching the frontier within a year. This achievement is significant because it demonstrates that Meta has been able to compete at the highest levels of AI research and development, an area where it had previously been viewed as trailing rivals such as OpenAI, Anthropic and Google.
Anmuth pointed to an accelerating cadence of model releases as evidence of Meta's momentum. This faster release schedule suggests the company has built the infrastructure, talent and organizational capacity to iterate quickly on cutting-edge AI models — a critical capability in the fast-moving AI race.
Muse Spark 1.3 and Watermelon
The culmination of Meta's efforts so far is Muse Spark 1.3, which Anmuth described as competitive with leading models like Claude and GPT. Achieving parity with these widely respected models is a major milestone for Meta, as it validates the company's technical capabilities and suggests its AI research is now on par with the best in the industry.
Looking ahead, Anmuth expects a coming model, dubbed Watermelon, to unlock further opportunities across a range of areas. These include consumer products, user engagement, advertising and internal efficiency. The breadth of potential applications suggests Meta's AI investments could pay off across multiple dimensions of its business, from improving user experiences to making its advertising systems more effective and its operations more efficient.
AI Agents as a New Growth Avenue
The upgrade is centered on the idea that Meta's push into AI agents opens a new avenue for growth beyond advertising. AI agents — autonomous systems that can perform tasks on behalf of users — represent a potentially massive new market that could generate revenue streams independent of Meta's traditional advertising business.
For Meta, AI agents could be integrated into its existing products, including Facebook, Instagram, WhatsApp and Messenger, giving the company a vast distribution network to deploy agent-based services. This could create new monetization opportunities, enhance user engagement and deepen the company's relationship with billions of users worldwide.
Beyond Advertising
Meta has historically been primarily an advertising company, generating the vast majority of its revenue from ads across its family of apps. The AI opportunity represents a potential diversification of that revenue base, reducing reliance on advertising alone. If Meta can successfully commercialize AI agents and other AI-powered services, it could establish new business lines that complement its existing advertising operations.
What This Means for Investors
The upgrade from JPMorgan reflects a growing recognition that Meta's AI investments may be more impactful than previously appreciated. By raising the price target so significantly — from $640 to $820 — Anmuth is signaling that he sees substantial upside in Meta shares based on the company's AI trajectory.
For investors, the key takeaway is that Meta is increasingly being viewed not just as a social media and advertising giant, but as a legitimate contender in the frontier AI race. If the company can continue its rapid pace of model development and successfully commercialize AI agents, it could unlock significant value beyond its traditional advertising business. However, as with any AI investment thesis, execution risk remains, and the competitive landscape is fierce, with well-funded rivals also racing to advance the technology.
 Long
Long
Long 
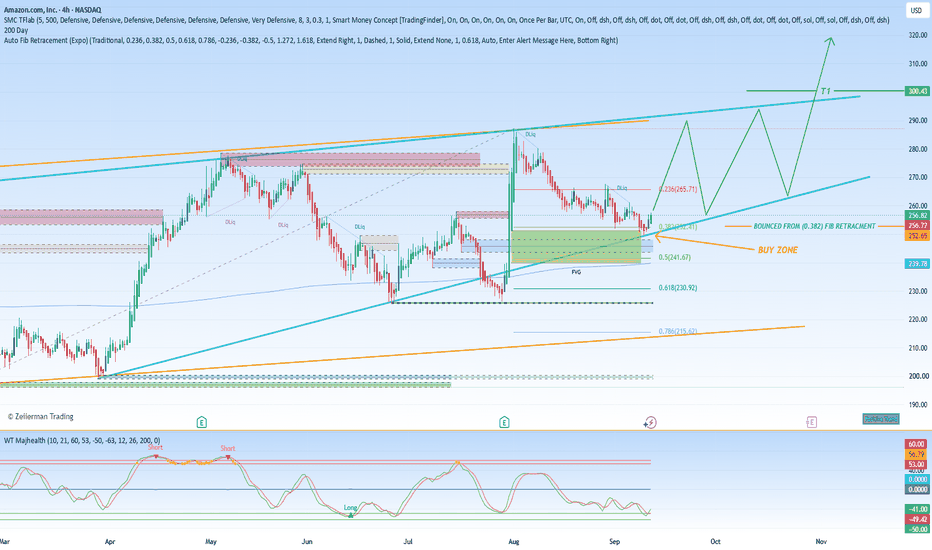
Amazon to Invest $230 Million in Whole Foods!Amazon has announced a major investment in its Whole Foods Market workforce, committing more than $230 million over the coming year toward pay increases and expanded benefits for more than 100,000 U.S. Whole Foods team members. The move represents one of the company's most significant single investments in employee compensation since acquiring the grocery chain.
New Benefits Package Starting January 2027
The company said the new health, family and financial benefits will begin on January 1, 2027, when U.S. Whole Foods Market team members will gain access to Amazon's broader benefits package. This alignment brings Whole Foods employees under the same benefits umbrella as Amazon's other U.S. workers, creating a more unified compensation structure across the organization.
Eligible full-time team members will be able to use health plans starting at just $5 per week, with $5 copays for primary care and behavioral health services. The plans also include a One Medical membership, giving employees access to enhanced primary care services. Additionally, the benefits extend to fertility and specialty care, addressing a broader range of health needs for workers and their families.
Significant Increase in Total Benefits Value
Amazon said the total value of benefits available to a full-time team member is rising by more than 75%, a substantial increase that reflects the company's effort to position itself as a competitive employer in the grocery retail sector. The updated package also includes company-paid short- and long-term disability insurance from day one of employment, fertility and family-building care, and cancer support and care navigation for those enrolled in an Amazon medical plan.
Paid parental leave is being increased to up to 20 weeks for birthing parents and up to six weeks for supporting and adoptive parents. This expansion of parental leave aligns Whole Foods team members with Amazon's broader parental leave policies and represents a meaningful improvement over previous offerings.
Part-Time Workers Also Benefit
Nearly 20,000 part-time team members working 20 or more hours per week will receive dental and vision coverage, as well as free basic life insurance, according to the company. This extension of benefits to part-time workers is notable in the retail grocery industry, where part-time employees often receive limited or no benefits.
Pay Increases Beginning September 2026
Amazon also announced that from September 28, 2026, hourly store team members will receive a pay raise through an annual pay-progression model based on time in role rather than performance reviews. This shift to a tenure-based system provides more predictable wage growth for employees and reduces reliance on subjective performance evaluations.
The company said this will lift the average store team member's wage to more than $21 an hour, while total compensation, including benefits, will exceed $29 an hour. These figures position Whole Foods as a competitive employer in the grocery retail space, where average hourly wages have been rising across the industry.
Career Choice Education Benefit
As of next year, Whole Foods Market team members will also be given access to Career Choice, Amazon's education benefit that prepays tuition for college, skills training and certifications. This program is designed to help employees develop new skills and advance their careers, whether within Amazon or elsewhere.
Regulatory Scrutiny Continues
The benefits announcement comes amid ongoing regulatory challenges for Amazon. Last month, Amazon was sued by the U.S. Federal Trade Commission and attorneys general across 22 states over alleged hidden price hikes. The lawsuit alleges that Amazon used deceptive practices that harmed consumers, adding to the company's legal and regulatory pressures.
Strategic Context
The investment in Whole Foods employee benefits comes as Amazon continues to integrate the grocery chain more deeply into its broader operations. By aligning Whole Foods benefits with Amazon's own packages, the company is signaling a long-term commitment to the grocery business and to its workforce. The move may also help Amazon attract and retain workers in a competitive labor market, where benefits and pay are increasingly important factors in employment decisions.
"Amazon to invest $230m in Whole Foods staff benefits" was originally created and published by Retail Insight Network, a GlobalData owned brand.  Long
Long