Long
Long
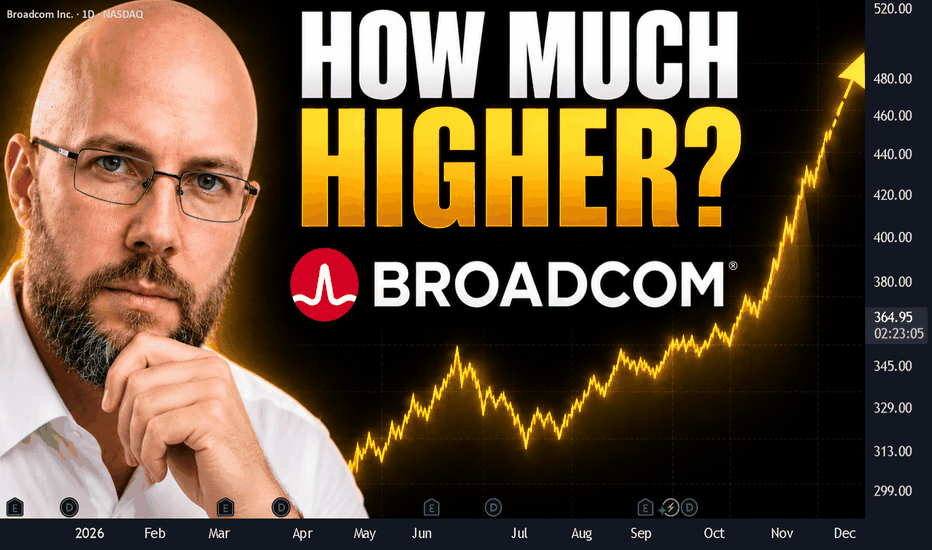
Broadcom Stock Analysis: How Much Higher Can AVGO Go?Broadcom is still in a long-term uptrend, but the current advance is already at a much later stage.
NASDAQ:AVGO is trading around $365 after reaching almost $500 at the recent high. I still see room for the larger move to continue, although the structure is no longer early. My current Broadcom stock analysis is built around three areas: whether the larger Elliott Wave structure remains incomplete, whether a break above the recent high near $500 can open the path toward $600, and whether a sustained break below $290 would materially weaken the current bullish structure.
The larger Elliott Wave structure still looks incomplete.
A break above the recent high near $500 would keep the path toward $600 open.
A sustained break below $290 would materially weaken the current bullish structure and make me reassess the count.
The long-term structure is still incomplete
On the monthly chart, Broadcom has been moving inside a large rising structure for several years. The advance accelerated significantly during the latest part of the trend, bringing price close to $500 before the current pullback. From an Elliott Wave perspective, I still read the larger advance as incomplete, but the wave relationships also suggest that the current part of the move is already in its final stage. A trend can remain bullish while the amount of remaining upside becomes progressively smaller relative to the advance that has already taken place.
The potential completion area I am using for this part of the structure is roughly $350 to $600, which means Broadcom is already trading inside it. I do not consider the move complete at the current price. The important point is that AVGO has reached a part of the long-term structure where continuation conditions matter more and where I would start paying much closer attention to evidence that the expected correction has begun.
The fundamental picture still supports the larger trend
Broadcom's fundamental picture remains strong enough to support the larger trend. The fundamental dashboard I am using shows revenue growth of roughly 18%, EPS growth of about 30%, and free cash flow growth of approximately 20%. At the same time, valuation is already fairly high, with forward P/E around 21 and forward P/S around 10.9.
There are also risks that become more important at this stage of the advance. Broadcom's five largest end customers accounted for about 45% of revenue during the first two fiscal quarters of 2026, while a large part of current growth is tied to AI infrastructure spending. If large AI deployments slow, Broadcom's growth rate can slow as well. For me, this combination fits the chart reasonably well: the business remains strong, while valuation, customer concentration and the maturity of the technical structure make the current position less straightforward than it was earlier in the trend.
The first important upside test is near $500
The daily chart makes the practical Broadcom technical analysis simpler. AVGO first needs to recover the recent high near $500. If price breaks above that area and can hold above it, I would expect the current advance to continue toward the $600 area. I would place more weight on price establishing itself above the old high than on a brief move through the level followed by an immediate reversal.
That gives me a clear decision map. Below $500, the previous high remains the immediate obstacle. A break above $500 followed by acceptance would shift the focus toward $600. On the downside, $290 is the more important structural boundary because a sustained move below it would change the interpretation rather than simply mark another support test.
Below $500: the previous high remains the immediate obstacle.
Above $500 and holding: the $600 area becomes the next important upside zone.
Below $290 and holding: the current upside continuation scenario becomes substantially weaker.
If Broadcom breaks below $290 and remains below it, my base case would be that the correction I am expecting has already started. At that point I would reassess the current Elliott Wave structure rather than continue treating the existing upside path as the primary scenario.
What I expect after the current advance
Even if Broadcom reaches the upper part of the current completion area, I do not expect the larger move to continue vertically. Once this part of the advance is complete, I expect a correction. The first move down could be sharp, while the broader correction can later become more complicated, move sideways and take considerably more time.
The red path on this chart is schematic. I am not treating every swing or turning point as an exact forecast. The important part is the broader sequence: the current advance completes, the first corrective leg can be sharp, and the larger correction can later develop sideways with strong countertrend recoveries. After that correction is complete, the larger structure would still support another major move higher.
The current advance completes.
The first corrective leg can be sharp.
The broader correction can later become sideways.
After the correction is complete, the larger structure would still support another major advance.
That last point is important for the long-term AVGO outlook because my Elliott Wave interpretation does not end the entire Broadcom bull structure with the current move. I expect a meaningful correction after this stage, but the larger count can still allow another major advance once that correction has completed.
The levels that would change my view
For now, my Broadcom technical analysis remains constructive while the larger structure stays intact. The two main levels are straightforward: a break above $500 followed by a hold above it would keep continuation toward the $600 area as my preferred path, while a sustained break below $290 would materially weaken the current upside scenario and make it more likely that the expected correction has already started.
Above $500 and holding: continuation toward the $600 area becomes my preferred path.
Below $290 and holding: the current upside scenario weakens materially and I would reassess the structure.
Broadcom has already completed a very large part of this long-term advance. I still do not consider the current move finished, but I also would not read the chart as an early-stage trend anymore. That is why the next move around $500 matters more to me than simply extrapolating the previous rally. If $500 breaks and price holds above it, I would continue to follow the move toward $600. If $290 breaks and price remains below it, I will reassess the current Elliott Wave structure and update the Broadcom analysis.  Long
Long
 Long
Long
Week 37 of 52 | META From $524 to $650—Now Comes the Hard PartSeven weeks ago, NASDAQ:META was trading near $530 after a sharp post-earnings selloff.
In our Week 31 idea, we said the business was not broken. Revenue was still growing, but investors were worried about how quickly Meta was spending money on AI without showing a clear return.
Technically, we identified $530–$540 as the first support area and said that a move back above $600 would be the first real sign that buyers were taking control again.
That is exactly what happened.
META reached $524.49, held the support area and then recovered $580, $600 and $640. From the low, the stock has gained roughly 24%.
But this is where the easy part of the recovery ends.
META is now testing the descending trendline that has rejected every major rally since the stock peaked near $800. It also lines up with the $660–$680 resistance area, making this the most important test since our previous idea.
The story around AI is also beginning to change.
Before, investors were only seeing the cost: higher infrastructure spending, lower free cash flow and no clear timeline for a return. The recent launch of Muse gives the market something more tangible to evaluate. Early interest has been strong, and investors are beginning to consider whether Meta can turn its enormous AI spending into another product and revenue stream.
That helps explain the latest rally, but one strong move does not erase the technical resistance directly above the price.
I would not chase META into this area.
A daily close above $680, followed by the price holding that level, would confirm the first meaningful break of the bearish structure. If that happens, $720 becomes the first target, followed by $760 and potentially the previous high around $795.
If META is rejected again, $620–$600 becomes the first area to watch. That zone was resistance during the recovery and should now act as support. A break below $600 would weaken the setup and could send the stock back toward $580.
The support call worked.
The recovery above $600 worked.
Now META has to do something it has not been able to do for more than a year: break the descending trendline and stay above it.
Bullish confirmation: Daily close above $680
First target: $720
Second target: $760
Major target: $795
Support: $620–$600  Long
Long
 Long
Long
 Long
Long
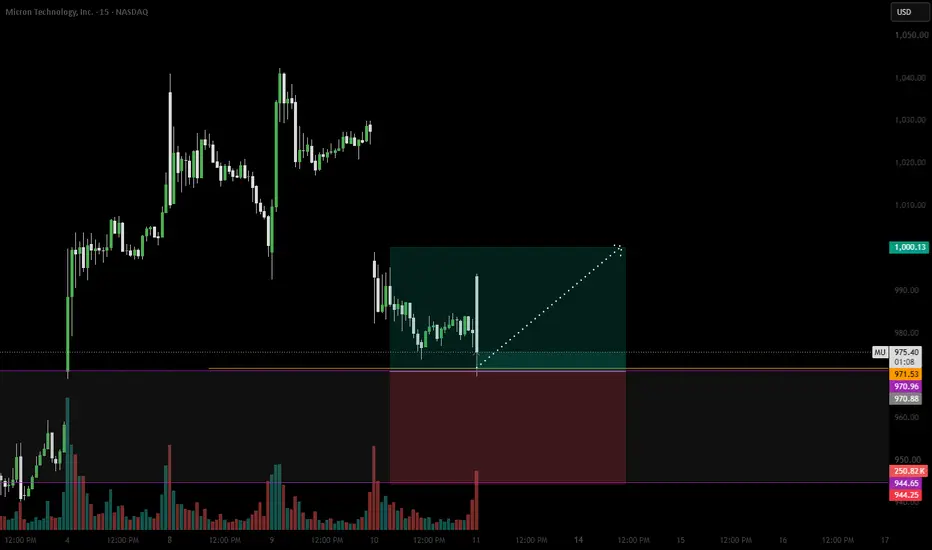
$MU: Rebuilding My Position After Taking ProfitsOver the weekend, I noticed that NASDAQ:MU broke above $1,050, allowing me to take partial profits on my 4th swing position.
Now, I’m looking to gradually rebuild the position I took off the table.
🔘 Chart Analysis
On the 4H timeframe, NASDAQ:MU has broken out of a triangle structure with strong volume, followed by the formation of a bullish H4 Order Block at $940–920.
🔘 Key Levels
🔴 Triangle Lower Boundary: $970
🟢 H4 Bullish OB: $940–920
🟢 Golden Pocket: $850–840
🔻 My Defense Level: $800
🔘 Trading Plan
I’ll look to scale into the position around these key levels, then wait for price to break above the $1,050 resistance. 📈
The idea is simple: take profits into strength, then reload on meaningful pullbacks instead of chasing price.
🔘And remember:
A business with stable and growing revenue can solve a lot of problems.
I’m still bullish on the future of DRAM and the broader memory semiconductor sector.
With market volatility picking up recently, I’ve been using rToken for execution.
rToken routes orders through broker channels directly to the real Nasdaq and NYSE order books, enabling 24/7 trading while maintaining access to real U.S. equity liquidity with the efficiency of the crypto market.  Long
Long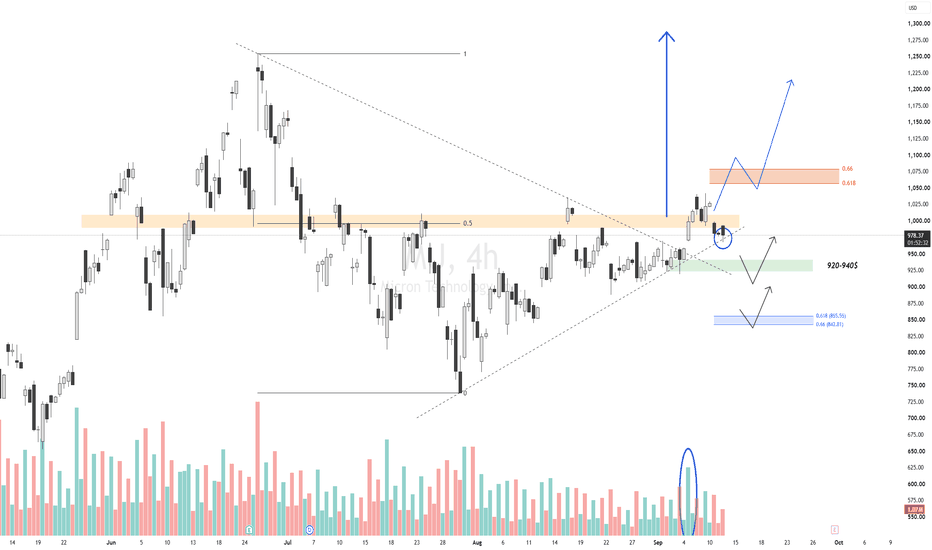
SNOW - Snowflake Inc.Snowflake, Inc. engages in the provision of cloud data warehousing software. The firm offers Data Cloud, an ecosystem where Snowflake customers, partners, data providers, and data consumers can break down data silos and derive value from data. Its platform supports a range of use cases including data warehousing, data lakes, data engineering, data science, data application development, and data sharing. The cloud-native architecture consists of layers across storage, compute, and cloud services. The storage layer ingests structured and semi-structured data to create a unified data record. The compute layer provides dedicated resources to enable users to access common data sets for many use cases without latency. The cloud services layer optimizes each use case's performance requirements with no administration. The company was founded by Marcin Zukowski, Thierry Cruanes, and Benoit Dageville on July 23, 2012 and is headquartered in Menlo Park, CA.  Long
Long
 Long
Long
 Long
Long
 Long
Long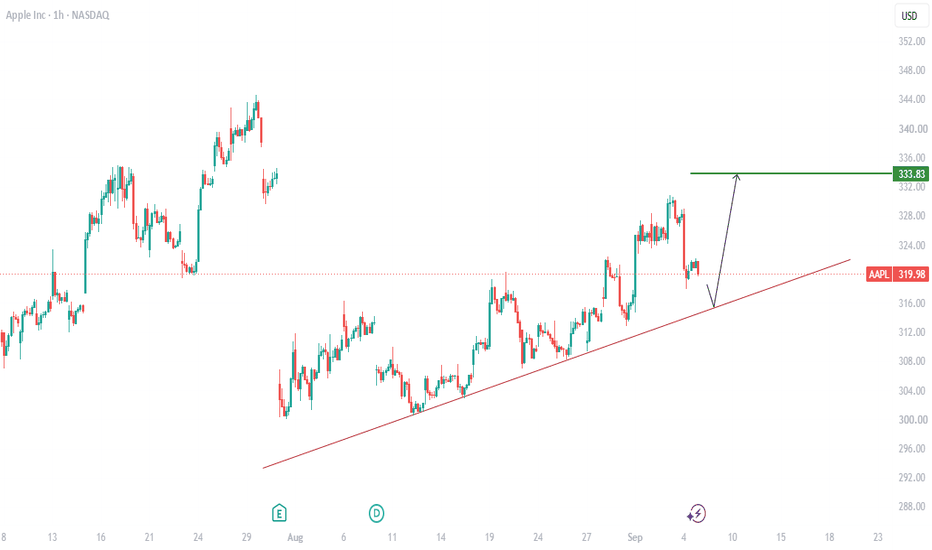
Long 
 Long
Long
 Long
Long
AEO — Bullish Post-Earnings Recovery Setup With UOAI am watching American Eagle Outfitters (AEO) as a speculative bullish recovery trade following its sharp post-earnings decline.
AEO dropped approximately 14% following earnings, bringing the stock down to around $14.53. While the initial market reaction was clearly bearish, I think the selloff has created an interesting risk/reward setup as the stock approaches a technical support level, particularly with unusual call activity in the options market.
Unusual Options Activity
The options activity is one of the main reasons AEO caught my attention.
The UOA data I am following showed approximately 31,553 calls, with the activity centered around the $15 strike.
More importantly, the current November option chain shows approximately 20,200 contracts of open interest on the November 2026 $15 Call.
That contract currently has approximately:
20.2K open interest
0.49 delta
47.8% implied volatility
Bid/ask around $0.96/$1.08
Stock price around $14.53
The combination of significant call activity and substantial existing open interest at a strike only slightly above the current stock price makes the November $15 level particularly interesting to me.
Post-Earnings Gap
The earnings selloff created a substantial gap above the current price. Rather than assuming the gap will automatically fill, I am looking for evidence that buyers are stepping back in. If AEO stabilizes and begins to recover, the large gap created by the earnings decline provides considerable room for an upside move. The first challenge is simply getting back above $15.
My chart identifies $15.07–$15.30 as a confluence resistance zone. A sustained move through that area would be an important bullish confirmation and could open the door toward approximately $15.85, followed by the larger overhead gap.
Support and Risk
AEO is currently sitting directly inside an important technical area.
Confluence Support: $13.89–$14.56
Confluence Resistance: $15.07–$15.30
That makes the current price of around $14.53 interesting, as the stock is near the upper end of support rather than chasing it after a recovery has already occurred. For me, $13.89 is an important invalidation level. If AEO loses that area and cannot recover it, the bullish recovery thesis becomes considerably weaker.
Holiday Shopping Catalyst
I also think the timing makes this worth watching. We're moving toward the holiday shopping season, which could provide an additional catalyst if investors begin anticipating stronger seasonal retail activity. I wouldn't use the holiday season by itself as a reason to buy AEO. The company's execution and consumer spending will ultimately matter, but it provides a potential narrative catalyst for a recovery over the next several months.
That is also one reason the November expiration interests me more than the September calls. It provides additional time for the post-earnings reaction to settle and for the market to reassess the company.
For me, the setup comes down to:
Post-earnings oversold move + support at $13.89–$14.56 + large November $15 call OI + potential gap recovery + approaching holiday season.
I would like to see AEO hold the current support area and reclaim $15.00. A move through $15.07–$15.30 would provide stronger confirmation.
My initial upside levels would then be approximately $15.85, followed by $16.70–$17.00 if the recovery develops. That latter area is especially important because the chart shows the 21/50 EMA region between $16.71 and $16.96.
The larger post-earnings gap could eventually become a target, but I wouldn't assume a complete gap fill until AEO proves it can reclaim those intermediate resistance levels.
This is a speculative trade idea being shared for educational purposes only. It is not financial advice or a recommendation to buy or sell AEO or any option contract. Post-earnings trades can remain volatile, and anyone considering a position should evaluate the risks based on their own objectives, account size, and risk tolerance.  Long
Long
ADBE: Earnings Sell-Off Confirms Rejection at the 200-Day EMAAdobe’s summer rebound stalled at $294.09 after briefly moving above the declining 200-day EMA. The stock subsequently reversed, lost its 50-day EMA, and closed at $248.83 on heavy volume.
Despite strong quarterly figures and higher full-year guidance, ADBE is trading near $241 in the pre-market. This negative reaction suggests that expectations were already high and creates a potential gap below the previous session’s low at $247.19.
The first support zone is located between $235 and $240. A daily close below this area could open the way toward $223, followed by $211.
On the upside, the $247–250 area should now act as the first resistance. The 50-day EMA near $257.60 is the main short-term pivot, while the declining 200-day EMA around $272–274 remains the key resistance.
The technical structure remains bearish below $257.60. A more convincing bullish reversal would require a sustained recovery above $272–274, potentially opening the way toward $286 and the recent high at $294.09.
Key levels
- Support: $240–235, $223, $211
- Resistance: $247–250, $257.60, $272–274
- Bullish targets after confirmation: $286 and $294.09
Disclaimer: This analysis is for informational and educational purposes only and does not constitute financial advice. Pre-market prices may change significantly before the market opens.
Laurent - Private Investor
✅ DL INVEST | Community Leader
 Short
Short
CPI Today. Calls or Puts?AAPL closed Thursday at $326.57 and is sitting almost dead center in my PD-15 box (Previous Day 15, the high and low of the prior day's final 15-minute candle) this morning. Oracle's AI cloud beat is lifting QQQ, SPY, and NVDA, but AAPL isn't participating, it's actually red on the day. August CPI drops at 8:30am ET, so I'm letting the data print and the market react before I trust either direction.
Key levels:
- PD-15 High / PDH (liquidity): $326.74 (Thursday's close-of-day high and full-session high overlap here)
- PD-15 Low (entry/retest): $325.17
- Prior Close (TP anchor): $326.57
- PDL: $316.51
- Call TPs: $329.44 / $331.22 / $334.09
- Put TPs: $323.70 / $321.92 / $319.05
- Daily ATR: $7.52
Bullish: break and close above $326.74 with volume (R.Vol at least 1.0x), retest the level or the 8 EMA, confirm with a bullish 2-min close. Check that QQQ/SPY are cooperating.
Bearish: close below $325.17 with volume, retest, confirm with a bearish 2-min close. Lines up with AAPL's relative weakness against today's rally.
If AAPL stays boxed after CPI, NVDA and QQQ are showing cleaner directional participation this morning.
Educational only, not financial advice. Options trading carries substantial risk. Do your own research and manage your own risk.
Study the levels. Wait for agreement. Trade with discipline. Short