Long
Long
 Short
Short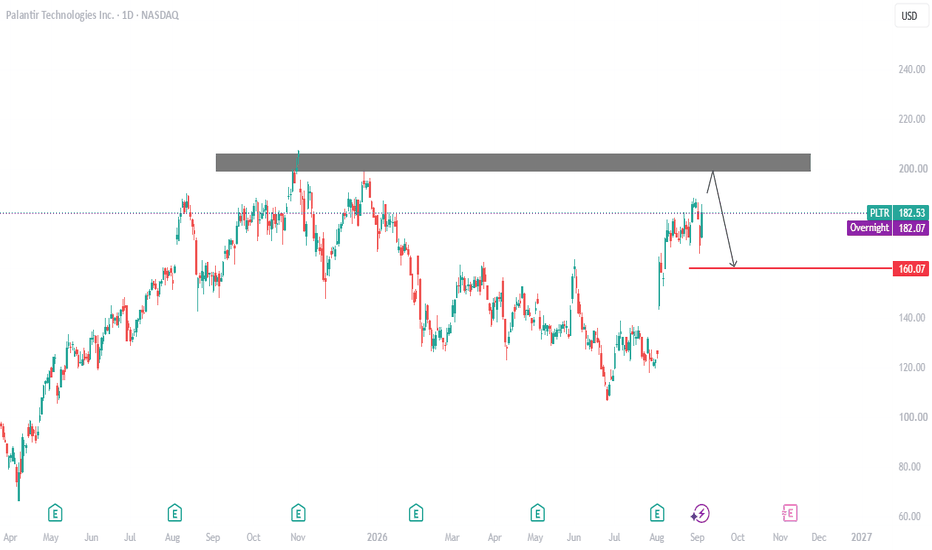
 Long
Long
 Long
Long
AMD: Elliott Wave roadmap through the 520 and 584.73 testsAMD's daily chart is testing whether the July pullback can support another advance. The near-term roadmap begins with daily closes above 520 and then 574.20. A sustained break above the June high at 584.73 would provide stronger support for the proposed next cycle wave. Until those conditions develop, the upside zones remain conditional.
The analysis uses NASDAQ:AMD, the displayed Cboe One feed, USD and a logarithmic daily chart, dated September 9, 2026. The last completed regular session, September 8, closed at 505.74. The study window starts October 12, 2022; the actual wave origin is the October 13 low at 54.57. Premarket indications should not be mistaken for completed daily confirmation.
The larger count
Cycle is outlined as a Primary five-wave advance from 54.57 to the March 8, 2024 high at 227.30. An A-B-C decline then reaches the April 8, 2025 low at 76.48, labeled Cycle . The subsequent five-wave advance into 584.73 on June 30, 2026 is a candidate for Cycle , followed by a possible Cycle correction to 424.03 on July 29.
Intermediate subdivisions are drawn within the final Primary waves of both large advances. The selected impulses pass the origin, shortest-third and wave-one/four nonoverlap checks. One detail deserves care: the latest Primary 4 low at 188.22 is only 1.57 above the Primary 1 high at 186.65. The count passes that price constraint on this feed, but the narrow margin is worth keeping visible.
The Elliott perspective
The latest advance contains a strongly extended fifth wave. That can make the following correction difficult to label confidently while it develops. The chart therefore treats the proposed Cycle and endpoints as provisional. A longer complex correction, or a further extension of the preceding structure, may require relabeling.
Selected subdivisions are not an exhaustive proof of every internal wave. The purpose of the count is to organize confirmation and failure conditions. A projected fifth wave should earn credibility through price behavior above resistance, rather than through a target calculation alone.
The decision framework
Daily closes above 520 and then 574.20 improve the restart case. Above 584.73, watch the first projection band at 590–600. A sustained advance beyond that band would make the more distant 695–710 projection relevant.
Both projections use the arithmetic length of Cycle , 227.30 − 54.57 = 172.73, measured upward from the proposed Cycle low at 424.03. Equality gives 596.76; multiplying that length by 1.618 gives 703.51. These are arithmetic extensions displayed on a logarithmic chart, not time targets or guaranteed destinations.
The first band lies close to the breakout high. Chasing a break above 584.73 without a suitable local risk structure may therefore leave little room before resistance. A constructive retest, or waiting for a clearer setup, can be more useful than treating the distant extension as justification for any entry. A structural cycle invalidation is not automatically an appropriate trade stop.
When the count needs revision
Below 424.03, the proposed restart from the July low fails. The alternative 390–395 reaction band contains the arithmetic 38.2% retracement of the 76.48-to-584.73 advance at 390.58 and lies near the May 19 low at 393.36. It is a potential reaction area, not an automatic buy.
Below 227.30, the proposed Cycle enters Cycle territory and the standard impulse interpretation needs revision. Below 54.57, the entire bullish origin fails. These are different degrees of failure and should not be conflated.
The next checkpoints remain 520, 574.20 and 584.73. Dashed paths illustrate conditional price scenarios, not timing forecasts. This is educational analysis with explicit revision levels, not a promise of future performance.
PLTR: Elliott Wave roadmap and the 188.37 recovery testPalantir's rebound has reached a stage where confirmation matters more than projecting a new high. The first checkpoint on this daily roadmap is a close above 188.37. Beyond it, the historical 198–208 resistance band would test whether the recovery can develop into a sustained advance.
This chart uses NASDAQ:PLTR, the displayed Cboe One feed, USD and a logarithmic daily view, dated September 9, 2026. The last completed regular session, September 8, closed at 170.30. Premarket indications are separate from the completed daily structure. The requested study window begins December 23, 2022; the actual wave origin is the subsequent December 27 low at 5.92.
The three-degree structure
A Primary five-wave advance is outlined from 5.92 into the November 3, 2025 high at 207.52, provisionally completing Cycle . Intermediate subdivisions are drawn within Primary 1 and Primary 5. These selected structures pass the tested impulse constraints, but the long Primary 3 is not exhaustively subdivided.
The decline from 207.52 is shown as a working W–X–Y outline toward the June 25, 2026 low at 106.37, potentially Cycle . An Intermediate A-B-C structure is shown inside W. The X and Y internals remain unresolved: this is not a claim that a complete double combination has been validated. The June cycle-low label therefore retains a question mark.
Why the uncertainty matters
Elliott analysis is most useful when it clarifies what would change the interpretation. The June low sits close to the arithmetic 50% retracement of the 5.92-to-207.52 advance, at 106.72. That relationship makes it an interesting candidate for a larger correction low; it does not prove that the correction is finished.
A rally can look compelling while still belonging to a larger corrective sequence. The next resistance tests should therefore carry more weight than the elegance of the historical labels. Fibonacci proximity supplies context, not a measured probability of success.
The recovery ladder
A daily close above 188.37 opens the historical 198–208 band. A sustained break above 207.52, followed by constructive price behavior, would strengthen the case for the recovery extensions at 230–233 and then 268–272.
The arithmetic calculation is 106.37 + r × (207.52 − 106.37). At r = 1.236 it gives 231.39; at r = 1.618 it gives 270.03. These are extensions of the recovery relative to the preceding decline, not measured lengths of an already established future impulse. The chart is logarithmic, while these calculations are arithmetic. The farther band depends on the earlier resistance levels being cleared.
For a practical setup, watch whether a breakout holds on a retest and leaves enough room to the next resistance band. An entry immediately beneath 198–208 could have limited reward relative to its local invalidation. Waiting is a valid outcome when that relationship is unattractive. The distant cycle low is not automatically an appropriate trade stop.
The alternative
A failed recovery at 188.37 or 198–208 keeps the corrective-rally scenario open. Below 106.37, the proposed restart from June is invalid. The alternative 82–85 band contains the 61.8% retracement of Cycle , approximately 82.93. Below 5.92, the entire bullish origin fails.
The next useful evidence is a completed daily close above 188.37 and the subsequent response at historical resistance. Dashed paths show conditional price scenarios rather than calendar forecasts. This is educational analysis; the count may require revision as price develops.
 Short
Short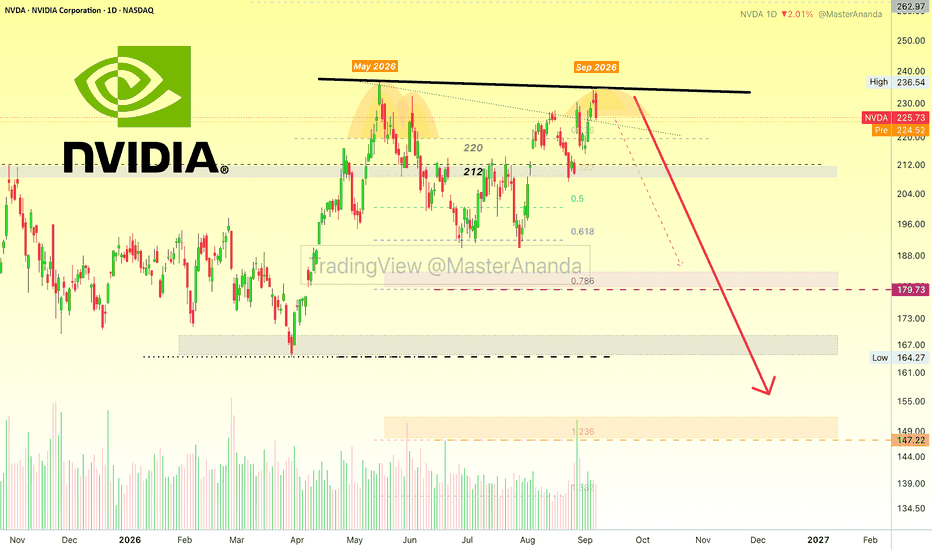
 Long
Long
PayPal: What Goes Up, Must Come Down?PayPal leaped on takeover hopes two months ago, but it may have reversed.
The first pattern on today’s chart is the bullish gap on July 15 after Reuters and CNBC reported a potential purchase. It was followed by a drop on August 28 after Bloomberg reported that the attempted deal was abandoned.
Second, the 100-day simple moving average (SMA) has remained below the 200-day SMA. That may indicate PYPL’s longer-term trend is bearish. It could also suggest the recent surge was a countertrend move.
Third, the payments stock peaked under $57 last Thursday. That level is near the July 28 low and a 50 percent retracement of its August 28 drop. Both points may confirm resistance is in place.
Next, the 8-day exponential moving average (EMA) crossed below the 21-day EMA. MACD is also falling. Those signals may reflect a bearish short-term trend.
Finally, PYPL has turned negative again on a year-to-date basis. Could that weigh on sentiment as the final months of 2026 come into view?
TradeStation has, for decades, advanced the trading industry, providing access to stocks, options and futures. If you're born to trade, we could be for you. Learn more here about TradingView’s Broker of the Year!
Past performance, whether actual or indicated by historical tests of strategies, is no guarantee of future performance or success. There is a possibility that you may sustain a loss equal to or greater than your entire investment regardless of which asset class you trade (equities, options or futures); therefore, you should not invest or risk money that you cannot afford to lose. Online trading is not suitable for all investors. View the document titled Characteristics and Risks of Standardized Options at www.TradeStation.com . Before trading any asset class, customers must read the relevant risk disclosure statements on www.TradeStation.com . System access and trade placement and execution may be delayed or fail due to market volatility and volume, quote delays, system and software errors, Internet traffic, outages and other factors.
Securities and futures trading is offered to self-directed customers by TradeStation Securities, Inc., a broker-dealer registered with the Securities and Exchange Commission and a futures commission merchant licensed with the Commodity Futures Trading Commission). TradeStation Securities is a member of the Financial Industry Regulatory Authority, the National Futures Association, and a number of exchanges.
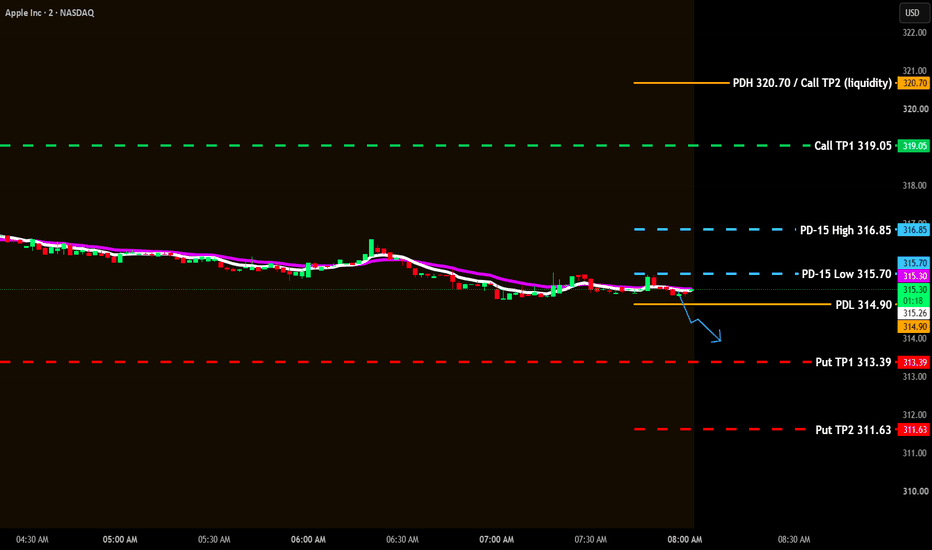
TradeStation Securities, Inc. and TradeStation Technologies, Inc. are each wholly owned subsidiaries of TradeStation Group, Inc., both operating, and providing products and services, under the TradeStation brand and trademark. When applying for, or purchasing, accounts, subscriptions, products and services, it is important that you know which company you will be dealing with. Visit www.TradeStation.com for further important information explaining what this means. AAPL Before Apple's Event Today: Calls or Puts?AAPL closed Tuesday at $316.22 and is drifting below my PD-15 box (Previous Day 15, the high and low of the prior day's final 15-minute candle) this morning. Apple has a product launch event later today, so I'm expecting more chop than usual and demanding real confirmation before trusting either side.
Key levels:
- PD-15 High (reclaim): $316.85
- PD-15 Low (breakdown): $315.70
- Prior Close (TP anchor): $316.22
- PDH: $320.70 | PDL: $314.90
- Call TPs: $319.05 / $320.70 / $323.64
- Put TPs: $313.39 / $311.64 / $308.80
- Daily ATR: $7.42
Bullish: reclaim $315.70, close back inside the box, break $316.85 with volume (R.Vol at least 1.0x), retest, confirm.
Bearish: close below $315.70 with volume, retest the level or the 8 EMA, confirm with a bearish 2-min close.
Lower-confidence setup today given event risk. Sizing smaller, waiting for real proof either way.
If AAPL stays messy: SPY has the cleanest structure this morning, TSLA is directional but choppier, NVDA is whipsawing with no clear direction.
Educational only, not financial advice. Options trading carries substantial risk. Do your own research and manage your own risk.
Study the levels. Wait for agreement. Trade with discipline.
 Short
Short
TSM: news flow leaning bullish — the net read
TSM did not get one story today, it got several, and they do not all point the same way. Weighed against each other — new against old, and tracking which ones have already faded:
++ Van Buren Township officials to consider final site plan for Google data center - The Detroit News
+ TSMC to use ASML’s next-gen machines for high-volume chip manufacturing - The Business Journals (fading)
+ Oracle updates Doña Ana County on Project Jupiter data center - abqjournal.com
104 stories were weighed in this window; the 3 carrying the most weight are listed.
Net read: +++ leaning bullish — top of our scale.
What this is: a measure of which way the *news* is leaning right now — not a promise about price. A read being right and a read still being worth taking are two different things: once price has travelled a long way from where the read was published, it is stretched, and a lean that is stretched is a no-chase rather than an invitation.
Weight is not fixed either. A fresh headline lands, the balance tips, and the net read can flip inside an hour — that shift is the part worth watching, not the first print.
I will post an update under this idea once the market has had time to speak, either way.
(Informational only — not financial advice, not a signal.)  Long
Long
AMAT: news flow leaning bullish — the net read
AMAT did not get one story today, it got several, and they do not all point the same way. Weighed against each other — new against old, and tracking which ones have already faded:
+ Capex Rebound Powers Applied Materials’ (AMAT) Performance (fading)
+ TSMC, Samsung Back High NA EUV And New Mask Size - Semiecosystem (fading)
43 stories were weighed in this window; the 2 carrying the most weight are listed.
Net read: +++ leaning bullish — top of our scale.
What this is: a measure of which way the *news* is leaning right now — not a promise about price. A read being right and a read still being worth taking are two different things: once price has travelled a long way from where the read was published, it is stretched, and a lean that is stretched is a no-chase rather than an invitation.
Weight is not fixed either. A fresh headline lands, the balance tips, and the net read can flip inside an hour — that shift is the part worth watching, not the first print.
I will post an update under this idea once the market has had time to speak, either way.
 Long
Long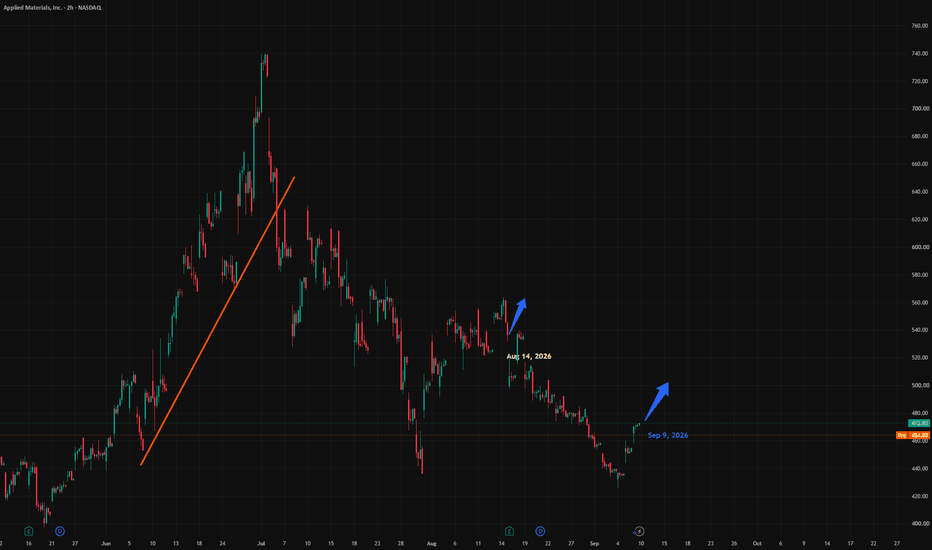
 Long
Long
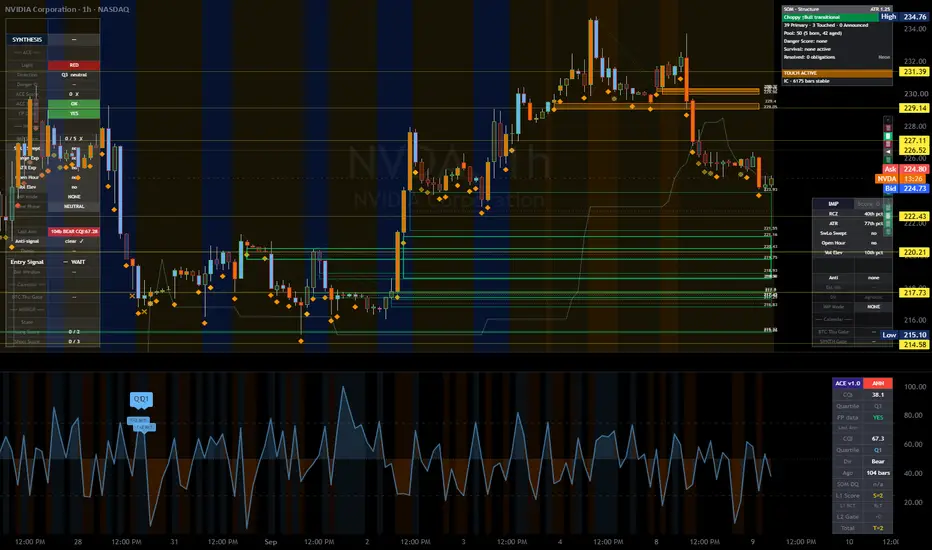
NVDA Lost 225.73 And Is Working Toward 222.43.NVDA Lost 225.73 And Is Working Toward 222.43.
NVDA is at 224.92 after Tuesday's 2.01% drop took out three levels in one session, and it has now given up the 225.73 close as well. That leaves it in open space between 226.52 overhead and 222.43 below, with nothing in between that has held. Conviction is empty rather than bearish - both timeframes read neutral, participation and extension conditions are zero on both, and hourly volume sits in the 10th percentile, so this leg is drifting rather than being driven. Neutral.
Resistance: 226.52 - the level lost Tuesday
Key resistance: 229.14 - the shelf that broke first
Current price: 224.92
Support: 222.43 - the next real level
Key support: 220.21 - the trend line under it
Structural floor: 217.73 - deeper support
Two paths from here:
It reclaims 226.52 and holds. Getting back above the level that broke first would make Tuesday's flush a single-session event and put 229.14 back in question. Nothing in the current surface is pushing it there, so that reclaim has to be bought rather than drifted into.
It reaches 222.43. The space between here and that level is empty, so a continuation covers it quickly and 222.43 becomes the first real test since the flush started. Under it, 220.21 is the trend line.
Three levels lost and no volume behind the move is a combination that resolves at the next level rather than in the space between. 226.52 to repair it, 222.43 to test it.
Built with SYNTHESIS v3.3 | SOM / ACE / IMP / SYNTHESIS
Study, not financial advice. AAPL | September 9, 2026 | Supply Zones, Stop Losses & Market PsToday's AAPL review focused on supply zones and the psychology behind liquidity around retail stop losses.
We looked at what can happen when price moves into a supply zone and why obvious stop-loss areas can become important pools of liquidity. Instead of assuming every quick move through a level is a true breakout, we talked about understanding who may be trapped, where orders are sitting, and what price does after that liquidity is taken.
In today's video, I covered:
* How to identify supply zones where selling pressure may enter the market
* Why institutional traders pay attention to areas with concentrated liquidity
* How retail traders often place stop losses around similar technical levels
* Why those stops can create liquidity when they're triggered
* The psychology behind a liquidity sweep and why traders can get trapped by the initial move
* Watching what price does **after** a level is swept instead of automatically chasing the breakout
The bigger lesson is that where you place your stop matters just as much as where you enter.
Large market participants aren't necessarily targeting one individual trader's stop. But when thousands of traders place stops around the same obvious levels, those areas can hold enough liquidity to matter.
That's why I don't want to simply see price break a level and react. I want to understand the supply zone, identify where liquidity may be sitting, and then watch how price responds after that liquidity is taken.
Dad Stock Joke: I hid my stop loss from the institutions today. They said, “That's cute… we already know where everyone else put theirs.”
Short

 Long
Long
 Short
Short
 Short
Short
 Short
Short
Possible rebound for $PATHSo overnight I listened back to Ashim Gupta at Citi yesterday, and came away even more confident in where UiPath is heading.
The biggest takeaway for me is that UiPath is no longer just selling automation software. They’re positioning themselves as the orchestration layer businesses will need as AI agents become part of everyday operations.
Gupta spoke about customers moving from experimentation into real deployments, the importance of governance, and why UiPath’s existing automation footprint gives them such a strong position to build from.
What I also liked was the focus on execution. They’ve spent the last couple of years transforming the platform, improving efficiency and getting the business profitable, while continuing to invest in Maestro and agentic AI.
The opportunity now is getting existing customers using more of the platform and bringing new customers into that ecosystem.
Agents can think, robots can do, but somebody still has to orchestrate everything.
That’s the part of the UiPath story I think the market is still underestimating 🤝
----
As far as the TA goes for the stock, I feel that if we do not get a rebound at the $14 here today, we are likely to get buyers off the re-test of the previous key level at $13.20 as shown on the chart. There is still a massive gap also highlighted as shown on the charts. After a good ER beat and raised guidance, I find it hard to see this being kept down for a long period of time; it really should start to recover here, or at the $13.20 support.  Long
Long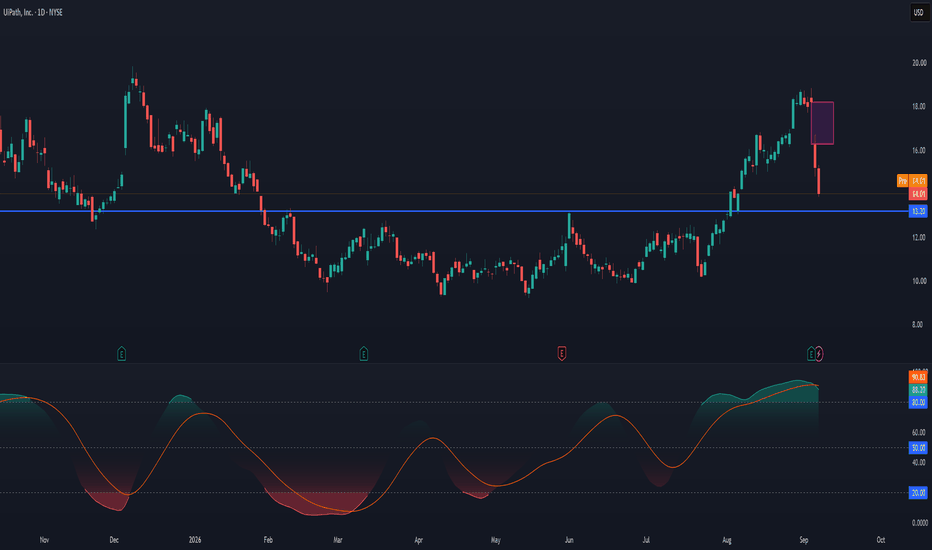
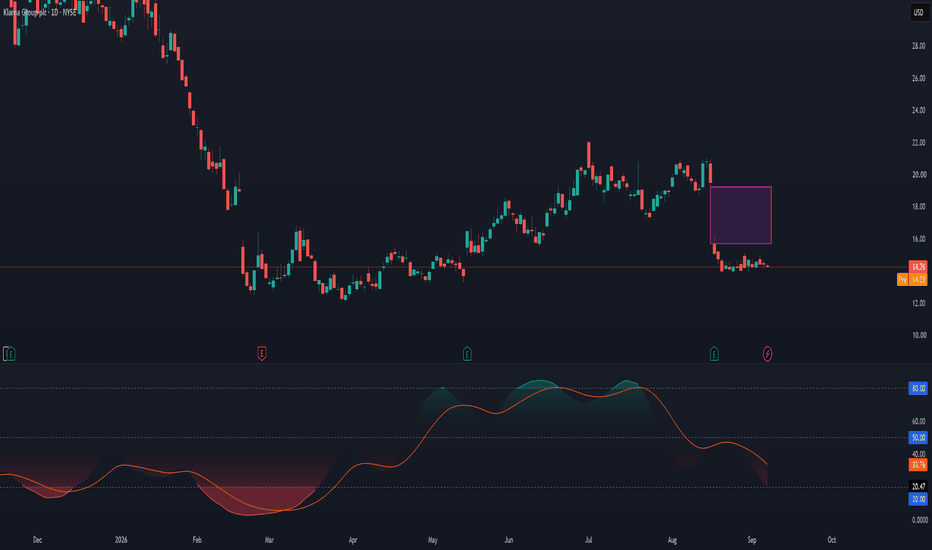
$KLAR's Gap Fill/Apple Day.Potentially a very interesting catalyst day for NYSE:KLAR today. I have been quietly adding at these low 14s over the past few weeks, as the support has been holding up.
Apple Day kicks off at 10am PT, and one thing I’ll be watching closely is Apple Upgrade. Klarna is the actual leasing provider behind the new program, covering iPhone, Apple Watch, Mac and iPad, with customers applying through Klarna and managing their lease through the Klarna app.
With new iPhones being unveiled today, including potentially some much more expensive models, it’ll be interesting to see how much exposure Apple gives the new Upgrade program.
Then just five hours later, Klarna CFO Niclas Neglén is speaking at the Goldman Sachs Communacopia + Technology Conference at 3:00pm PT.
If Apple gives Upgrade some proper airtime, Klarna then has the opportunity to speak directly to investors just hours later on the very same day.
Could be a very interesting one for Klarna as this gap is still to be filled, and the 14s have been holding for weeks now. This makes me confidant that it is likely to fill with a strong catalyst!  Long
Long