• Products
  • Community
  • Markets
  • Brokers
  • More
Get started
  • Markets
  • /USA
  • /Stocks
  • /Ideas
Moving to ATHsAfter retracing about 50% of it's total move up NASDAQ:CIFR appears to have found support at the prior resistance area. It broke above it's daily moving averages and the momentum indicators are pointing up. It has also seem some heavy call option flow recently including a 8/7 $27 call today that created a volume to open interest ratio of over 20-1. Over the last 7 days bulls have outpaced bears in both call options and call premiums by about 2-1. That $27 call is looking solid.
NASDAQ:CIFRLong
by Train4388
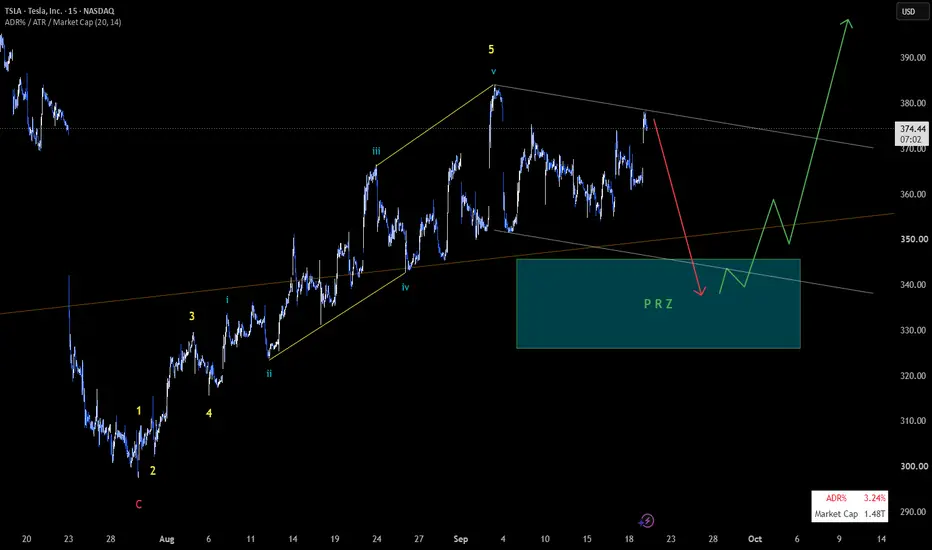
$TSLA probably stays within this channel until it breaks outWhat do you all think its gonna break out with results?
NASDAQ:TSLA
by Srini0685
MSFT: How Long Until Structure Breaks?Primary Scenario ADJUSTMENT: We primarily expect imminent declines that should take the stock directly into our green Target Zone ($294.15–$252.08). Within this zone, an interim low should eventually form, setting the stage for a counter-move. Alternative Scenario ADJUSTMENT: There’s a chance MSFT could rise soon, break through resistance at $472.21, and form a high just below resistance at $562.17. However, selling pressure is then expected to increase again, targeting our green Target Zone ($294.15–$252.08) (probability: 32%). Long-Term Outlook The daily chart shows the path of the larger corrective move. Ultimately, further sell-offs into the blue Long-Term Entry Range ($212.18–$118.87) are expected before a sustained trend reversal is likely. However, if MSFT shows more strength in the near term than previously anticipated, price could set a new all-time high above resistance at $562.17 before the (then somewhat delayed) Long-Term Entry Range is reached later on (probability: 36%).
NASDAQ:MSFTShort
02:23
by HKCM_Global
Northrop Grumman stock has fallen sharplyNorthrop Grumman is one of the largest military and defense companies in the United States and primarily works for the U.S. military and defense projects (but it is a private company, not a government entity). Therefore, if its stock were to collapse, it would imply a serious military and economic failure for the United States.
NYSE:NOCShort
by Sohrabsheikhii
Updated
COIN GEX - Breakout Above 170, Potential Gamma SqueezeCOIN printed a double bottom on the daily chart, then reclaimed structure and cleared 170 – C1 / Ab1 . Spot is now near 180.50 , holding above the former Call Wall. With 170 accepted, price has entered the positive gamma extension zone — gamma squeeze potential opens toward the 200 multi-metric cluster if momentum holds. 🔶 Regime Context 🔶 Price is trading well above HVL 155 , keeping COIN inside a positive GEX regime . The double bottom below, then the push back through HVL and into a C1 clear, frames this as a structural reclaim — not a random spike. 🔶 Options Structure Context 🔶 👉 170 – C1 + Ab1 — highest call wall + largest absolute gamma; cleared, now the breakout reference that must hold Confluence at 170: C1 — highest call NETGEX Ab1 — largest absolute gamma That makes 170 a clear reaction zone — clearing it is what can trigger a potential gamma squeeze . 👉 200 – nCV + COI + AbOI — next overhead magnet Confluence at 200: nCV — strongest net call volume COI — highest call open interest AbOI — highest absolute open interest Together, 200 is a call-inventory and call-flow cluster — the natural squeeze target if extension holds. 🔶 Downside Structure 🔶 👉 170 – C1 / Ab1 — first line that must hold for the squeeze thesis 👉 155 – HVL — regime pivot; loss of HVL would weaken the positive-regime read 👉 140 – P1 — strongest put wall / downside floor 🔶 Options Sentiment 🔶 CALL$ 84.5% means call options at an equivalent distance from spot are priced 84.5% higher than the corresponding puts — this is elevated call pricing skew . On the Options Oscillator, the filled green histogram remains elevated at the right edge — call pricing skew is still strong, not fading. IVRank 77.2 IVx 86.2 CALL$ 84.5% — call pricing skew Implied move ±6.27% (±11.3) Price is also reclaiming the 50 SMA area, while the declining 200 SMA sits near the 200 confluence — technical overhead aligned with the options cluster. 🔶 Key Structure to Watch 🔶 170 — C1 + Ab1 cleared; must hold 200 — nCV + COI + AbOI squeeze magnet 155 — HVL / regime pivot 140 — P1 put wall For now, COIN is a double-bottom reclaim + C1/Ab1 clear setup, with squeeze potential toward 200 . The key question is whether price can hold above 170 and extend toward 200 — or whether the Call Wall rejects and sends the move back toward HVL 155 .
NASDAQ:COINLong
by TanukiTrade
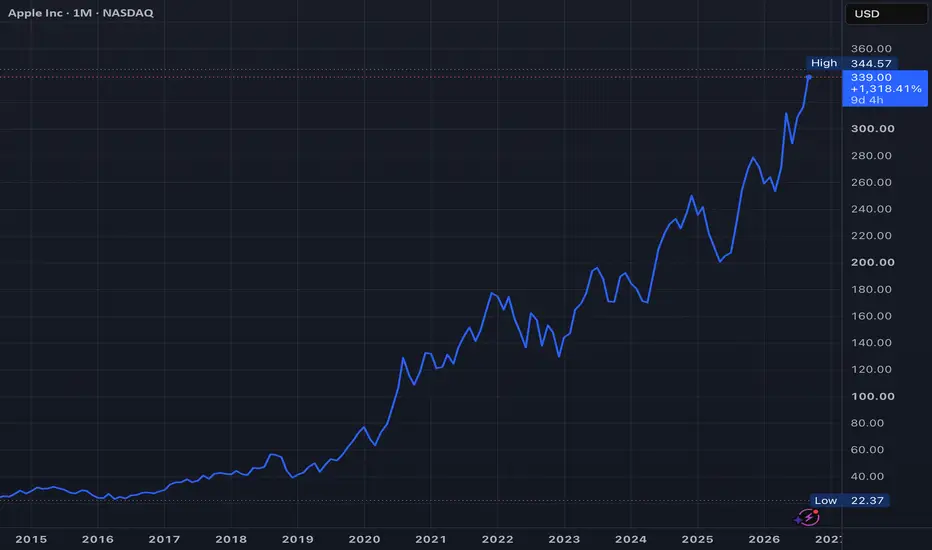
AAPL H4 | Bullish Continuation SetupThe price is falling to our buy entry level at 315.03, a pullback support that is slightly above the 38.2% Fibonacci retracement and the 78.6% Fibonacci projection. Our stop loss is set at 301.07, which is a pullback support, Our take profit is set at 333.85, a pullback resistance. High Risk Investment Warning Stratos Markets Limited fxcm.com Stratos Europe Ltd, fxcm.com CFDs are complex instruments and come with a high risk of losing money rapidly due to leverage. 69% of retail investor accounts lose money when trading CFDs with this provider. You should consider whether you understand how CFDs work and whether you can afford to take the high risk of losing your money. Stratos Global LLC fxcm.com Losses can exceed deposits. Please be advised that the information presented on TradingView is provided to FXCM (‘Company’, ‘we’) by a third-party provider (‘TFA Global Pte Ltd’). Please be reminded that you are solely responsible for the trading decisions on your account. Any information and/or content is intended entirely for research, educational and informational purposes only and does not constitute investment or consultation advice or investment strategy. The information is not tailored to the investment needs of any specific person and therefore does not involve a consideration of any of the investment objectives, financial situation or needs of any viewer that may receive it. Past performance is not a reliable indicator of future results. Actual results may differ materially from those anticipated in forward-looking or past performance statements. We assume no liability as to the accuracy or completeness of any of the information and/or content provided herein and the Company cannot be held responsible for any omission, mistake nor for any loss or damage including without limitation to any loss of profit which may arise from reliance on any information supplied by TFA Global Pte Ltd. Stratos Trading Pty. Limited fxcm.com Trading FX/CFDs carries significant risks. FXCM AU (AFSL 309763), please read the Financial Services Guide, Product Disclosure Statement, Target Market Determination and Terms of Business at fxcm.com
NASDAQ:AAPLLong
by FXCM
LONG $CCK – Raised Guidance & Strong Post-Earnings MomentumIdea: LONG (BUY) Entry: $120.00 **Stop Loss (SL):** $108.00 Take Profit (TP): $146.00 **Risk/Reward Ratio (R/R):** ~1 : 2.2 *(Risk = $12.00 / Reward = $26.00)* 🔍 FUNDAMENTAL RATIONALE (Best-in-class results) The Q2 2026 earnings results were a beast and the raised guidance is a game-changer: Adjusted EPS of $2.49 vs. $2.16 est. (+$0.33 beat, +16% YoY). Revenue of $3.668B vs. $3.37B est. (+$300M beat, +16.5% YoY). Global beverage can volumes +5%, with double-digit growth in Asia, +7% in Europe, and +5% in North America. Annual guidance RAISED from $7.90-$8.30 to $8.30-$8.50, beating the consensus of $8.11. The CEO stated the company is on track for "another exceptional year." Aggressive buybacks: $305M in the quarter (nearly 7% of shares in 12 months). Adjusted free cash flow 2026: at least $900M. Analyst backing is overwhelming: The consensus is "Strong Buy" / "Buy" with an average PT of ~$126-$128. Bank of America raised their PT to $145** (the highest on the Street). **Mizuho** and **Raymond James** are at **$135, and BMO Capital initiated coverage with Outperform and a PT of $130**. My TP of **$146 sits slightly above Wall Street's highest PT, betting that strong momentum and guidance upgrades will push the stock to new highs. 📊 TECHNICAL RATIONALE (Confirmed breakout) The stock rallied ~+2.5% in after-hours to ~$119-$120 post-earnings, breaking through the $117-$118 resistance zone. Entering at $120.00 aims to capture the follow-through momentum after the confirmed breakout on strong volume. The SL at $108.00 is placed below the prior consolidation range and the 200-day moving average, giving the trade room to breathe on a potential pullback. The **TP at $146.00** aligns with Bank of America's highest PT ($145) and targets a breakout to new 52-week / all-time highs. ⚠️ RISK MANAGEMENT Risk per trade: Do not risk more than 1-2% of your total capital. Scaling out: If the stock hits $130-$135 (the PT zone of Mizuho/Raymond James/BMO), I recommend trimming 50% of the position to lock in profits and letting the rest run toward $146. 🧠 CONCLUSION CCK delivered an exceptional quarter with revenue and EPS beats, raised annual guidance above consensus, and is aggressively buying back shares. The combination of strong fundamentals + analyst backing + technical breakout makes the entry at $120 offer an excellent 1:2.2 risk/reward ratio. Active follow-up required. Good luck to those who hop on! 🍀 ⚠️ DISCLAIMER IMPORTANT: This is NOT financial advice. This post represents my personal opinion and analysis for educational and informational purposes only. Trading stocks involves substantial risk of loss, including the potential loss of your entire invested capital. Past performance does not guarantee future results. You are solely responsible for your own trading decisions. Always conduct your own due diligence (DYOR) and consult with a licensed financial advisor before making any investment decisions. I am not liable for any gains or losses incurred from acting on this idea. #CCK #CrownHoldings #PostEarnings #Breakout #Trading #Stocks #Finance #Packaging
NYSE:CCKLong
by shortermtrader
COIN BULL TRAP?Eyes on COIN ladies and gentlemen. Bull trap setup is completed, expect a pullback. COIN just did what Bitcoin will do in the next couple of days. Coin has the same setup as Bitcoin, is like if you were looking thru a window a few days into the future.
NASDAQ:COINShort
by Numberfive
LONG $ZION – Overreaction to GAAP Noise?Idea: LONG (BUY) Entry: $68.98 **Stop Loss (SL):** $63.90 Take Profit (TP): $79.06 **Risk/Reward Ratio (R/R):** ~1 : 2.0 *(Risk = $5.08 / Reward = $10.08)* 🔍 FUNDAMENTAL RATIONALE (The underlying business is solid) The Q2 2026 earnings results were a clear beat on the core business, but the market punished the stock for accounting noise: Adjusted EPS of $1.74 vs. $1.57 est. (+10.8% upside surprise). The pure banking business crushed expectations. The GAAP EPS of $3.05** included **$252M in NON-recurring gains (Visa liquidation + SBIC investments). That's the only reason the market hesitated. Without those items, operating performance was excellent. Loan growth +3% and deposits +4% sequentially, showing a balance sheet in clear expansion. Credit quality improving: Nonperforming assets declining (0.48%) and minimal charge-offs (0.06% annualized). Management projects positive operating leverage of 100 to 150 bps for the full year 2026. Analyst consensus backs the move: The FactSet median price target rose to $75** (+4.17% vs. previous). Cantor Fitzgerald has a PT of **$80 and Stephens at $79**. My TP of **$79.06 aligns with Wall Street's most bullish projections. 📊 TECHNICAL RATIONALE (The chart context) The stock dropped ~2.8% in after-hours to ~$68-$69, erasing initial gains. I view this drop as an overreaction to the noise from non-recurring items. The $68.98 level represents a key support zone prior to the release and an attractive re-entry point after the technical "gap down." The SL at $63.90 is placed just below the 3-month consolidation range low and below the 200-day moving average, giving the trade room to breathe. The TP at $79.06 sits at the psychological and technical resistance zone of yearly highs, coinciding with the ceiling of the most optimistic analyst projections. ⚠️ RISK MANAGEMENT Risk per trade: Do not risk more than 1-2% of your total capital. Scaling out: If the stock hits **$74** (the median PT zone), I recommend trimming **50% of the position** to lock in profits and letting the rest run toward $79.06. 🧠 CONCLUSION The market punished ZION for the noise from the Visa gains, but the underlying banking business delivered a 10.8% beat with balance sheet growth and stable margins. Buying the dip at $68.98 offers an excellent 1:2 risk/reward, betting that the market will correct its initial reaction once investors look past the GAAP headline. Active follow-up required. Good luck to those who hop on! 🍀 ⚠️ DISCLAIMER IMPORTANT: This is NOT financial advice. This post represents my personal opinion and analysis for educational and informational purposes only. Trading stocks involves substantial risk of loss, including the potential loss of your entire invested capital. Past performance does not guarantee future results. You are solely responsible for your own trading decisions. Always conduct your own due diligence (DYOR) and consult with a licensed financial advisor before making any investment decisions. I am not liable for any gains or losses incurred from acting on this idea. #ZION #RegionalBanks #PostEarnings #ValuePlay #Trading #Stocks #Finance
NASDAQ:ZIONLong
by shortermtrader
TSN | The time to go long has come- Timeframe: Weekly - Trade type: Buy stop order - Price: 59.11 - Take Profit: Open - Stop Loss: 56.44 (-4.50 %) Idea: Long on a breakout above last week's high - bullish momentum continuation. Entry: Buy stop above last week’s high. Stop-loss: Below the low of the same candle. If the weekly candle closes below this level, the trade is invalidated. Take Profit: Trailing stop following the lows of new weekly candles.
NYSE:TSNLong
by Tired-Wolf
Updated
PANW Monthly Reversal bar attempt short of the midpoint of prior structure. Monthly bar close important. 345.55 341.02 Current resistance is an upper parallel of near term structure.
NASDAQ:PANW
by The_Obvious_Whale
(BZ) Fast Bounce Setup | Price:$15→ Target:$15.78 (+ 5 %)BZ — Kanzhun Limited | Bounce Setup from Key Support | +5% Target Timeframe: Daily | Bias: Bullish (Short-term) Technical Setup: Price is currently sitting near the $14.84–15.03 zone, right at a confluence of major support — a long-term ascending trendline, a high-volume node from the Volume Profile, and an oversold RSI reading near 22. This is a textbook exhaustion zone after a prolonged downtrend from the $25 highs. The marked Target Area ($16.00–$19.00) represents a ~5-30% bounce from current levels, aligning with a prior consolidation shelf and the Pivot S1 at $19.02 acting as a medium-term magnet. Key Levels: 🟢 Entry Zone: $14.84 – $15.10 🎯 Target: $15.75 – $19(+5 TO 30%) 🔴 Stop Loss: Below $13.80 (under trendline support) Confluence Factors: RSI 14 deeply oversold (~22), showing early curl VRVP shows heavy volume node acting as support in this range CD Pivot support near $14.98 Price approaching rising trendline from multi-month base Fundamentals (Bonus Context): Kanzhun's Q3 2025 net profit grew 34% YoY, beating consensus by 6.6%, driven by improved revenue and higher margins. StockAnalysis The stock appears technically oversold relative to its fundamental strength. Risk: China macro headwinds and broader market sentiment remain key risks. Not financial advice — manage your size accordingly. 🙏
NASDAQ:BZLong
by ali-lavin
Updated
22
Tesla - Support at 300 / 260Tesla has been moving sideways. The stock is expected to hit the levels of 300 and take support , however it might fall further to the levels of 260 before making a strong come back to the levels of 360 +. Support levels - 300 ( 30% Chance) 260 ( 80% chance)
NASDAQ:TSLA
by Investing_Trading
HON | Continued stock growth- Timeframe: Weekly - Trade type: Buy stop order - Price: 230.47 - Take Profit: Open - Stop Loss: 220.39 (-4.40 %) Idea: Long on a breakout above last week's high - bullish momentum continuation. Entry: Buy stop above last week’s high. Stop-loss: Below the low of the same candle. If the weekly candle closes below this level, the trade is invalidated. Take Profit: Trailing stop following the lows of new weekly candles.
HLong
by Tired-Wolf
Updated
Has circle finished its bottoming pattern?On July 9th I suggested that Circle was bottoming. I believe circle may now have completed its bottoming pattern. I expect a large bounce from here. I've included UNH as an example of a common bottoming structure. Identifying patterns can be a great edge in trading. May the trends be with you. July 9th receipt for those that are interested:
NYSE:UNH
by Strangely-accurate
Alibaba - Support 87 / 71The stock is falling heavily..however , the stock expected to hit the levels of 87 and take support...if this further breaks down then the next level is 71... The rejection is expected to hit the levels of 120....
NYSE:BABALong
by Investing_Trading
Updated
Waiting for a Reversal and Looking for a LowThe last pitchfork is clearly bearish and I don't want to fight the trend or go short after such a big drop, so the only play here is to wait for price to break above the upper parallel and then buy on a pullback.
NASDAQ:SPCXLong
by Principlesofmathprob
Updated
LONG $SFBS – Post-Earnings Breakout with a Fundamental CushionIdea: LONG (BUY) Entry: $88.70 **Stop Loss (SL):** $83.00 Take Profit (TP): $101.00 **Risk/Reward Ratio (R/R):** 1 : 2.2 *(Risk = $5.70 / Reward = $12.30)* 🔍 FUNDAMENTAL RATIONALE (Why go long here?) The Q2 2026 earnings results were a beast for the bank's fundamentals: **EPS of $1.57**, in line with consensus, but **revenues beat expectations** ($168.5M vs $167.85M est.). Annualized loan growth of 15.3% with pipelines at record highs. The CEO highlighted that demand is a "grade A" and growth is "very granular" across all regions. Net Interest Margin (NIM) expansion: 3.63% (+53 bps YoY), driven by disciplined deposit pricing and higher loan yields. Efficiency ratio below 30% (29.65%), one of the best in the banking sector, showcasing brutal cost discipline. ROACE of 17.71% and solid capital strength (CET1 at 11.83%). Analyst consensus backs the move: Average price target sits at $94 - $97, with Piper Sandler raising their PT to $94** immediately after the print. The high-end estimate reaches **$100. By setting my TP at $101**, I am positioning for a **breakout above the psychological $100 level, anticipating that the strong momentum and continued loan growth will push the stock to new highs beyond current analyst estimates over the coming months. 📊 TECHNICAL RATIONALE (The chart context) The stock was consolidating in a tight range between $83 and $87 over the past few weeks. The post-earnings gap decisively broke through the $87/$88 resistance zone on strong volume. Entering at $88.70 aims to capture the follow-through momentum after the breakout confirmation. The SL at $83.00 is strategically placed just below the old consolidation range and the 50-day moving average, giving the trade room to breathe without getting stopped out by a fakeout. The **TP at $101** sits above the psychological $100 barrier, targeting a new 52-week high zone. ⚠️ RISK MANAGEMENT Risk per trade: Do not risk more than 1-2% of your total capital on this setup. Scaling out: If the stock hits **$94** (Piper's PT zone), I recommend trimming **50% of the position** to lock in profits and letting the rest run toward $101. 🧠 CONCLUSION A winning combination: Post-earnings momentum + Best-in-class fundamentals + Attractive valuation. The market is pricing in the loan growth and margin expansion. As long as price holds above $87, the trend is your friend. The extended TP to $101 reflects confidence in sustained upside. Active follow-up required. Good luck to those who hop on! 🍀 ⚠️ DISCLAIMER IMPORTANT: This is NOT financial advice. This post represents my personal opinion and analysis for educational and informational purposes only. Trading stocks involves substantial risk of loss, including the potential loss of your entire invested capital. Past performance does not guarantee future results. You are solely responsible for your own trading decisions. Always conduct your own due diligence (DYOR) and consult with a licensed financial advisor before making any investment decisions. I am not liable for any gains or losses incurred from acting on this idea. #SFBS #Banks #PostEarnings #Breakout #Trading #Stocks #Finance
NYSE:SFBSLong
by shortermtrader
RF Long — Regions Financial's pullback screams opportunity afterRegions Financial has one of the better long setups on reward/risk, with a neutral but aligned pullback structure and plenty of room back toward resistance. The news is clearly supportive after an earnings beat, dividend hike, and several target raises, but the weak intraday trigger and price below VWAP argue for waiting on confirmation before acting. 📍 Entry: 30.83 🛑 Stop: 30.26 🎯 Target: 32.47 ⚖️ R:R: 2.88
NYSE:RFLong
by mnktrd
RF Long — RF pulls back to vwap support and buyers are stepping Neutral 4h pullback with vwap support and wide 2.87 R reward sets up a long; strong earnings, dividend increase and fresh analyst upgrades provide clear fundamental backing for continuation. 📍 Entry: 30.83 🛑 Stop: 30.26 🎯 Target: 32.47 ⚖️ R:R: 2.88
NYSE:RFLong
by mnktrd
7/21/26 - $xxi - Buying it7/21/26 :: VROCKSTAR :: NYSE:XXI Buying it - can't say much here.... - rafa is the right CEO here. no bad blood with jack and tether - buying this dip V
NYSE:XXILong
by VROCKSTAR
TEAM — 60 Seconds Read: Relaunch, but extreme volatility1️⃣ What do we see? TEAM has produced a strong upside expansion day and closed near its high. Price is above EMA8, SMA20, SMA50 and SMA100, while RS is rising with price. Short-term momentum is accelerating, but SMA20 remains below SMA50, SMA100 remains below SMA150, and volatility is extreme. 2️⃣ Thesis TEAM is attempting a legitimate momentum relaunch, but it remains a transition setup until price establishes acceptance above the $96–100 zone. The opportunity is real. The structure is not finished. 3️⃣ What validates the thesis? Price holds above SMA150 near $96.80 Multiple closes establish acceptance above $97–100 RS remains above its moving average EMA8 near $92 holds on pullbacks Volatility stops expanding or begins to contract SMA20 continues accelerating toward SMA50 Price progresses toward $108–112 4️⃣ What invalidates the thesis? Price rejects the $96–100 area and loses $92 A close below approximately $89–90 RS falls below its moving average Downside volatility expands after the breakout attempt Price returns to the prior July range Short-term momentum rolls over before structural repair completes
NASDAQ:TEAM
by TradeSentinelApp
BBY - 60 Seconds Read: A fully confirmed daily uptrend1️⃣ What do we see? BBY is in a fully confirmed daily uptrend. Price is above every major moving average, the SMA stack is bullish, RS is rising with price, and the stock is pressing near a new 52-week high. The June breakout was accepted, and July produced another expansion leg. 2️⃣ Thesis BBY remains a valid momentum-continuation candidate, but current extension makes staged engagement superior to chasing full size. The trend is strong enough to own. The entry is extended enough to manage carefully. 3️⃣ What validates the thesis? Price holds above EMA8 near $83.60 Pullbacks remain controlled above $82.50–84 RS stays above its moving average Price accepts above approximately $87 Volatility remains normal or expands with upside progress SMA20 momentum remains positive 4️⃣ What invalidates the thesis? Price decisively loses $79.80–81 RS breaks below its moving average A 52-week-high breakout fails while downside volatility expands Price stops progressing as volatility rises SMA20 momentum turns negative alongside structural damage
NYSE:BBYLong
by TradeSentinelApp
112233445566778899101011111212131314141515161617171818191920202121222223232424252526262727282829293030313132323333343435353636373738383939404041414242
…999999

Made by humans

Select market data provided by ICE Data Services. Select reference data provided by FactSet. Copyright © 2026 FactSet Research Systems Inc.Copyright © 2026, American Bankers Association. CUSIP Database provided by FactSet Research Systems Inc. All rights reserved. SEC filings and other documents provided by Quartr.© 2026 TradingView, Inc.

More than a product
  • Supercharts
Screeners
  • Stocks
  • ETFs
  • Bonds
  • Crypto coins
  • CEX pairs
  • DEX pairs
  • Pine
Heatmaps
  • Stocks
  • ETFs
  • Crypto coins
Calendars
  • Economic
  • Earnings
  • Dividends
  • IPOs
More products
  • News Flow
  • Portfolios
  • Fundamental Graphs
  • Yield Curves
  • Options
  • Macro Maps
  • Pine Script®
Apps
  • Mobile
  • Desktop
Community
  • Social network
  • Wall of Love
  • Refer a friend
  • House Rules
  • Moderators
Ideas
  • Trading
  • Education
  • Editors' picks
Pine Script
  • Indicators & strategies
  • Wizards
  • Freelancers
  • Paid Spaces
Tools & subscriptions
  • Features
  • Pricing
  • Market data
  • Gift plans
Trading
  • Overview
  • Brokers
  • Brokers comparison
  • The Leap
Special offers
  • CME Group futures
  • Eurex futures
  • US stocks bundle
About company
  • Who we are
  • Space mission
  • Blog
  • Help Center
  • Careers
  • Media kit
Merch
  • TradingView store
  • Tarot cards for traders
  • The C63 TradeTime
Policies & security
  • Terms of Use
  • Disclaimer
  • Privacy Policy
  • Cookies Policy
  • Accessibility Statement
  • Security tips
  • Bug Bounty program
  • Status page
Business solutions
  • Widgets
  • Charting libraries
  • Lightweight Charts™
  • Advanced Charts
  • Trading Platform
Growth opportunities
  • Advertising
  • Brokerage integration
  • Partner program
  • Education program
Community
  • Social network
  • Wall of Love
  • Refer a friend
  • House Rules
  • Moderators
Ideas
  • Trading
  • Education
  • Editors' picks
Pine Script
  • Indicators & strategies
  • Wizards
  • Freelancers
  • Paid Spaces
Business solutions
  • Widgets
  • Charting libraries
  • Lightweight Charts™
  • Advanced Charts
  • Trading Platform
Growth opportunities
  • Advertising
  • Brokerage integration
  • Partner program
  • Education program
Look FirstLook First