• Products
  • Community
  • Markets
  • Brokers
  • More
Get started
  • Markets
  • /USA
  • /Stocks
  • /Ideas
Moderna - Easy MoneyWe continue the idea from the previous post, where the initial targets have already been reached. At the moment, price action in Moderna shares is correcting the fifth wave formed during the downside move. The structure suggests a developing bullish impulse, and the upward move is likely to continue. So far, wave 1 and wave 2 of this impulse have been completed. Key targets: 49 - local pullback within wave 3 57 / 62 - potential completion zone for wave 3 , followed by a correction 71 / 79 - potential completion zone for the entire move The upside potential from current levels is estimated at 65 - 82 %. --- Please subscribe and leave a comment! You’ll get new information faster than anyone else. ---
NASDAQ:MRNALong
by NotBoringTrading
Updated
Coca-Cola - Slowly Moving HigherWe are analyzing the move from March 2020 to the present. We assume this is the fifth wave of the larger move, and we are currently forming the fifth sub-wave within the fifth wave. One of the key targets is at the 85 level. Estimated upside potential from current levels: Approximately 17% --- Please subscribe and leave a comment! You’ll get new information faster than anyone else. ---
NYSE:KOLong
by NotBoringTrading
Updated
Wall Street Reports Tomorrow. Tomorrow is the biggest single day of the earnings calendar so far this year. JPMorgan, Bank of America, Citigroup and Wells Fargo all report before the US market opens on Tuesday July 14, followed by Goldman Sachs, Morgan Stanley and BlackRock on Wednesday. Five banks valued at nearly $2 trillion releasing results in one morning. The numbers are expected to be strong. Total Q2 earnings for the sector are forecast to grow around 10% year over year on similar revenue growth, driven by resilient consumer spending, steady loan demand, and a robust first half for investment banking. JPMorgan's revenue is projected to reach $51.3 billion, up 14% year over year. Bank of America is expected to post $30.7 billion, up 16%. Goldman Sachs is forecast to deliver EPS of around $14.47, up more than 32% year over year, fueled by blockbuster trading and M&A advisory activity. Investment banking revenue across the industry jumped 24% in the first half of 2026 to $61.4 billion. But the bar is high Strong expectations cut both ways. When five of the world's biggest banks report on the same morning as the June CPI print, the room for disappointment is significant. Options markets are already pricing in meaningful moves: Goldman Sachs is showing a 6% implied move, Citigroup and Wells Fargo 5.5% each, Bank of America 4.5%, and JPMorgan 4.4%. These are not small numbers for large-cap stocks. Key metrics traders are likely to watch. Beyond the headline EPS, the metric that matters most this week is net interest margin — the spread between what banks earn on loans versus what they pay on deposits. With the Fed on hold and a rate hike now more likely than a cut before year-end, NIM trends will determine whether banks can sustain profitability into the second half. Credit quality is the second potential point of interest. Any sign of rising delinquencies, particularly on credit cards or commercial real estate, could overshadow even a strong earnings beat. A closer look at Citigroup The most watched name this week may not be JPMorgan. Citigroup has been quietly turning itself around, posting its best quarterly revenue in a decade in Q1 2026, with net income of $5.8 billion and EPS of $3.06. If that momentum continues into Q2, it could be the surprise of the week. What this means for markets Bank earnings have a way of setting the tone for the whole season. A strong showing from the big lenders, combined with reassuring commentary on loan demand and credit quality, would signal that the broader economy remains in good shape despite elevated oil prices and Fed hawkishness. A disappointment could be the catalyst that finally tests the S&P 500's recent highs. Nevertheless, the market reaction will also depend on broader macroeconomic data and investor expectations. Disclaimer: This content is for informational and educational purposes only and does not constitute investment advice or recommendation to trade. 49% of retail CFD accounts lose money. You should only invest money you can afford to lose. Past performance is not indicative of future results.
NYSE:JPM
by Skilling
Updated
CBOE : The cash machine is ready to take offCBOE (CBOE Global Markets, Inc.) — The Double-Screener Champion A giant financial infrastructure company that operates options and stock exchanges. It is certainly no coincidence that it caught both my "undervalued" and "bottom bounce/momentum" scanners last week. And made a small meaning full move to critical support. Why Undervalued By nature, CBOE is a cash machine. Regardless of market volumes, it takes a cut as a commission from every single transaction. This is why its Operating Cash Flow (CFO) is always massively positive. Since it generates regular and predictable profits, its Net Debt / EBITDA ratios remain well within very safe boundaries. Due to recent rotations within the financial sector or temporary quietness in exchange volumes, its multiples have been compressed, pushing it right into your "undervalued" scanner thresholds. In a volatile market, cash is king. As a major exchange operator, CBOE:CBOE is a literal cash machine with massive positive Operating Cash Flow (CFO). Net Debt / EBITDA is rock-solid (no debt traps here). Strong pricing power and high gross margins protect it from macro headwinds. It's rare to find this level of quality sitting in undervalued territory. Trade Opportunities : Buy the breakout of 280 $ or wait for a pullpack down to 245 - 250 s to buy. Targets are on the chart with green horiziontal lines Good Luck
CBOE:CBOELong
by chartreader_pro
PYPL Daily Double Bottom & Bullish Divergence Reversalhi traders This technical analysis highlights a strong accumulation and potential trend reversal setup for PayPal (PYPL) on the Daily (1D) time frame. The price action indicates a bottoming structure backed by strong bullish momentum indicators. 1. Inverse Head and Shoulders / Double Bottom Accumulation The price action has formed a clear bottoming structure, highlighted by the two green curved arcs beneath the lows in February and June. This behaves effectively as a large Double Bottom pattern (or a complex bottoming accumulation), signaling a shift from a prolonged downtrend to an emerging uptrend. The current price is steadily rising out of the second bottom, heading toward key horizontal overhead resistance levels. 2. Massive Bullish Divergence on Daily RSI A major structural validation comes from the Relative Strength Index (RSI) at the bottom of the chart. While the price action in June printed a low that was notably close to or slightly higher than the deep February low, the RSI printed a substantially higher low (indicated by the yellow upward-sloping trendline). This strong bullish divergence highlights that selling pressure has severely dried up, and buyers are aggressively absorbing shares on dips. 3. Price Path & Targets The chart projects a multi-stage bullish pathway over the coming months: Target 1 (Neckline Resistance): ~$52.00 – $53.00 The first major flag icon marks the horizontal yellow resistance line at roughly $52.50. The projected yellow path shows the price rallying directly to this neckline, followed by a brief corrective retest/consolidation phase. Target 2 (Macro Target): $68.38 Once the neckline is successfully broken and flipped to support, the ultimate target for this reversal structure sits at the higher yellow horizontal level at $68.38 (marked by the top flag icon). This represents the next major structural liquidity zone from late previous year.
NASDAQ:PYPLLong
by vf_investment
NVDA Held Its Breakout But Can't Add To It.NVDA Held Its Breakout But Can't Add To It. NVDA ran more than 4% Friday to tag 211 and has held above the 207-208 area into Monday, keeping the breakout intact after clearing a two-week range. But it has not been able to extend - price is consolidating just under the highs on very light volume, and the near-term read has cooled to neutral even as the longer-term conviction stays strongly bullish. The trend is holding; the momentum has paused. After an 8% run off the floor, a breakout that stops going without giving back is either basing for the next leg or quietly topping. Resistance: 211.10 - Friday's high Key resistance: 213.43-214.58 - the shelf above Current price: 208.28 Support: 207.59 - the trend-hold line Key support: 202.20 - the breakout level Structural floor: 191.23 - the four-times floor Two paths from here: The trend resumes. Holding 207.59 with the daily conviction still near its ceiling, a push through 211 opens 213.43 and the 214.58 prior high. The daily structure is bullish and the standing call is long - it just needs volume, which at the 17-20th percentile has not shown up to carry the next leg. The base fails. The near-term read cooled to neutral and volume dried up under the highs - a stall, not a push. A loss of 207.59 then 202.20 puts the breakout level back in play as the line that separates a real trend from a two-day spike that gave back. Below 202.20 the old range reasserts. NVDA did the hard part - cleared the range and ran 8%. The question now is whether it can hold the gains without volume to defend them. The daily conviction is strong, the near-term momentum has paused, and price is pinned just under the high. 207.59 is the line that keeps the trend honest; 211 is the level that restarts it. Built with SYNTHESIS v3.3 | SOM / ACE / IMP / SYNTHESIS Study, not financial advice.
NASDAQ:NVDA
by virDeStatera
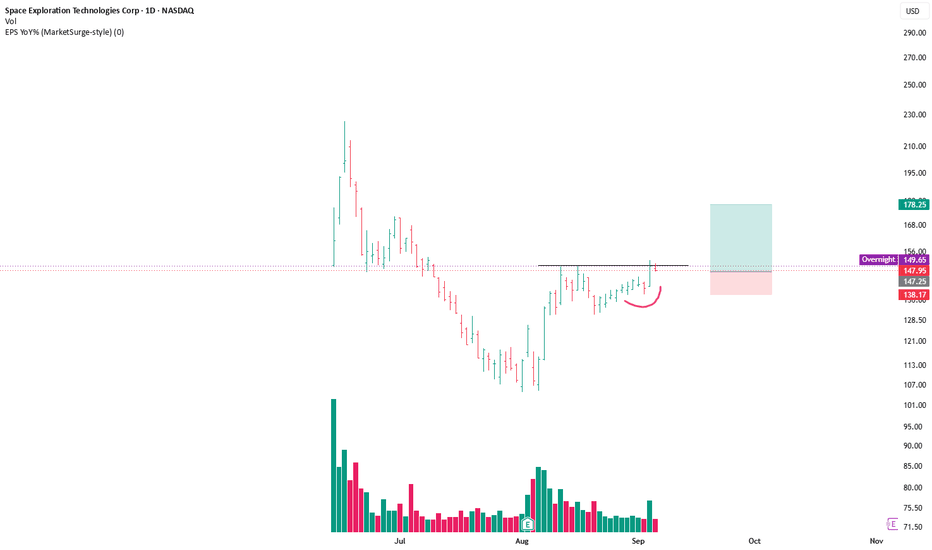
who really benefits from IPOs?An IPO is often presented as the moment when everyone gets a chance to own a piece of the future. But markets are rarely that simple. Behind every public listing is a transfer of ownership between different groups with different goals. Some are raising capital, some are unlocking years of private investment, some are gaining access to a company for the first time. The important question is not just "Is this a good company?" It is: "Who is entering, who is exiting, and why now?" The Real Purpose of an IPO An Initial Public Offering allows a private company to sell shares on a public exchange for the first time. The company may issue new shares to raise capital. Existing shareholders may also sell part of their ownership to create liquidity. Many IPOs contain a combination of both. This distinction matters because the money does not always go to the same place. If new shares are issued, capital flows into the company. If existing shares are sold, capital flows to current shareholders. The structure of the offering tells you who is benefiting. The Company Gains Access to Capital For a growing business, going public can provide billions in funding that were previously unavailable. That capital can support expansion, research, acquisitions, hiring, and future growth. The company gains something valuable: A public market where it can raise money beyond private investors. But the company is not the only participant with something to gain. Early Investors Gain Liquidity Before an IPO, private investors may hold valuable shares that cannot easily be sold. Venture capital firms, private investors, founders, and early employees may have spent years holding an investment with no public market. An IPO changes that. It creates a transparent valuation and eventually allows those shareholders to convert part of their ownership into cash. For investors who entered years earlier, the IPO may represent the beginning of an exit opportunity. Employees Gain the Value They Helped Create Many early employees accept lower salaries in exchange for equity. Their reward is tied to the company's future success. A public listing can turn those ownership stakes into a tradable asset. The IPO is often the moment when years of work become financially measurable. Investment Banks Earn From the Process Taking a company public requires a complex process. Investment banks help structure the offering, determine demand, market the shares, and connect the company with investors. For arranging the transaction, they earn underwriting fees. The IPO is not only a capital event, it is also a major financial service transaction. Institutions Often Arrive Before Retail Large institutional investors frequently receive allocations during the IPO process. They have the resources to analyze businesses, commit significant capital, and participate before shares begin public trading. Retail investors usually enter after the opening bell. By then, the market has already started forming its opinion on valuation. Where Does Retail Fit In? Retail investors are often the most visible participants, but they are usually the newest ones. They are buying into a company after: Founders have built the business, early investors have taken the initial risk, institutions have evaluated the opportunity and the market has assigned an opening valuation. That does not make retail investors disadvantaged by default. Some of the greatest companies in history created enormous shareholder value after going public. But timing matters. Buying a public company is different from investing in a private company before the market knows its value. The Hidden Lesson Behind IPOs An IPO is not simply a celebration of growth. It is a moment where different participants meet at different stages of the same story. Early investors may be looking for liquidity. Companies may be looking for capital. New investors may be looking for future growth. All three can be true at the same time. The market is not driven by one objective, it is driven by competing incentives. What This Means for Traders Price movements are easier to understand when you understand the participants behind them. Before reacting to an IPO headline, ask: Who is raising money? Who is selling? Who is buying? And what expectations are already priced in? The answer often reveals more than the excitement surrounding the listing. One Thing to Remember An IPO does not create value overnight. It reveals value that was built over years and changes who has access to it. The smartest investors don't just ask whether a company is great. They ask: At what stage of the story am I entering? put together by : Pako Phutietsile as @currencynerd
NASDAQ:SPCXEducation
by currencynerd
TSM BEFORE EARNINGS - JUL 2026TSM is trading near $434, holding above the critical $410 support but remaining below the $450 resistance. Institutional flow shows approximately -4.62M in distribution, keeping short-term pressure bearish. A breakout and daily close above $450 could trigger a move toward $475–$479. Losing $410 would expose the $390 put wall, followed by $370 and the $355 earnings target. A deeper selloff could extend toward the major $325 accumulation zone. Bullish targets: $450, $475–$479 Bearish targets: $410, $390, $370, $355 Major accumulation: $325 #TSM #Semiconductors #Chips #AI #NVDA #AMD #SOXX #SMH #QQQ #SPY
NYSE:TSM
by TWMMPRO
Meta Platforms:The story just changed; the chart is catching up?There has been a major shift at Meta Platforms Inc. and it was neither related to an earnings report nor to a product rollout. Rather, there has been an important strategic rebranding which will take time for the markets to value. On July 10, Meta announced the roll out of Meta Compute, along with the development of the Iris AI chip – a customized computer chip going into production this September and enabling plans to double their capacity of computing from 7 gigawatts by 2026 to 14 gigawatts by 2027. Meta is considering starting a cloud computing service which would compete directly with Microsoft Azure, Google Cloud, CoreWeave and Nebius.. The response of the market was quite clear. Meta rose by 15% over the week, ending at a price of $669.21 on Friday, with a volume of 40.61 million shares compared to an average of 23.63 million per day, which is close to double. Jim Cramer pointed out that Meta delivered on the 18% rise that he predicted, while 3Fourteen Research highlighted that the stock should continue rallying until July. Cathie Wood made purchases into the rally aggressively. Bank of America pointed out that Meta is approaching a positive inflection point for its chip aspirations in AI. The market sentiment changed from 'Meta is spending too much money on AI' to 'Meta is building the infrastructure to monetize AI at hyperscaler scale'. The daily chart is a great example of how fast sentiment can switch when a fundamentally different story starts unfolding. What is happening here is that a stock that has been down by 29% since its all-time high of $796.25 reached in August 2025 has recovered back to levels not seen since late March, when the stock traded near the 52-week lows of $520.26. EMA configuration has changed decisively. EMA 9 and EMA 20, which were forming the resistance ceilings all through June, have been taken out and are now turning up with an angle typical of an institutional accumulation, rather than a short term rally based on a retail buying interest. The MA Cross between the 9 and 21 lines is at $579.73 and $617.03 respectively – both way below current price, indicating that the short-term and medium-term trends have reversed from bearish to bullish overnight. The RSI indicator at 66.34 is what matters the most on the chart. It is well above its signal line at 48.04 – an 18-point difference showing the strength of the buying interest this week. The RSI has not yet reached overbought territory above 70, which means there is technical runway remaining before momentum exhaustion becomes a genuine concern. The MACD is where the setup becomes most compelling. The MACD line at −9.59 is crossing above the signal line at −27.15, with the histogram at −17.56 beginning to contract sharply toward zero ;a classic early-stage bullish crossover in motion. The histogram bars are still negative but they are narrowing at pace, and a full crossover into positive territory would be one of the strongest MACD signals visible on this chart in months. Trade recommendation Direction : Long Entry horizon : $647 – $665 Primary target : $681.85 Secondary target : $720 Stop loss : $598.3 Technical scenarios Bullish momentum and technical validation : Should the MACD histogram transition into positive territory within the upcoming sessions, it would signal a robust trend confirmation alongside an RSI push north of 70. Reclaiming the $681.85 intraday peak on a daily close would validate the Meta Compute thesis, suggesting institutional re-accumulation is firmly in control. This confluence of factors points toward a sustained trajectory toward the $720 resistance zone. Ultimately, a Q2 earnings delivery that pairs advertising acceleration with strategic capex expansion would provide the fundamental fuel necessary to challenge the 52-week high of $796.25. Mean reversion and structural support : After an aggressive 15% weekly rally, a period of healthy digestion toward the $647–$655 reclaim zone is entirely plausible as overextended momentum cools. A retreat in the RSI toward the mid-50s and a narrowing MACD histogram would represent a tactical reload opportunity rather than a trend reversal. For market participants seeking entry, the EMA 9 remains the primary zone of interest, provided that the EMA 20 at $598 continues to function as the definitive floor for this emerging bullish structure. Bearish divergence and margin risk : The inherent volatility of Zuckerberg's AI narrative was underscored by the brief 5% dip following his July 11 commentary on long-term monetization. If the July 23 print reveals softening ad revenue or suggests that massive infrastructure spending is severely eroding margins without an immediate ROI, the stock faces a sharp unwind. Such a disappointment could trigger a rapid descent to test the $598 support level. A decisive breach of the EMA 20 would invalidate the recent recovery, signaling that the broader corrective phase from the $796 peak is resuming.
NASDAQ:METALong
by Kearabilwe-Nonyana
BJDX chart analysis On daily chart you can see rsi is oversold 7 day moving average crossed price And something else I forgot to mention there have beeen build up of higher lows
NASDAQ:BJDXLong
by emonr11
ASML BEFORE EARNING JUL - 2026ASML is trading near $1,768.72 premarket, below the key $1,785–$1,800 pivot. The 30-minute and 4H structures show short-term weakness, while daily institutional flow remains bearish at -$32M. The weekly structure remains bullish with +$1.414B in flow, suggesting the current decline is still a correction within the broader accumulation trend. Reclaiming $1,785 and securing a 4H close above $1,839 would open the path toward $1,859, $1,900 and $1,970. Losing $1,752 exposes $1,721, followed by $1,707–$1,698 and $1,680. A daily close below $1,680 would confirm distribution and increase the probability of a deeper correction toward $1,624–$1,550. Upside targets: $1,839 / $1,859 / $1,900 / $1,970 Downside targets: $1,752 / $1,721 / $1,698 / $1,680 / $1,624–$1,550
NASDAQ:ASML
by TWMMPRO
SLB - SLB LimitedSLB Ltd. engages in the provision of energy technology. It operates through the following business segments: Digital, Reservoir Performance, Well Construction, Production Systems, and All Other. The Digital segment involves the combination of digital solutions and data products with its Asset Performance Solutions. The Reservoir Performance segment consists of technologies and services for productivity and performance optimization. The Well Construction segment includes the full portfolio of products and services for well placement and performance, drilling, and wellbore assurance. The Production Systems segment focuses on the development of technologies and provides services to production and recovery from subsurface reservoirs to the surface, into pipelines, and refineries. The company was founded by Conrad Schlumberger and Marcel Schlumberger in 1926 and is headquartered in Houston, TX.
NYSE:SLBLong
by Esmail_from_Kuwait
It's time for LAES.US - potential profit 65% The SEALSQ chart shows that the stock is currently trading near a significant support zone around $2.75–$2.85, an area that has been successfully defended by buyers on multiple occasions. The current consolidation following the previous upward move may indicate the formation of a solid base for the next bullish leg. From a technical perspective, selling pressure appears to be weakening, while maintaining price above the current support increases the probability of renewed buying momentum. A breakout above the nearest resistance levels, supported by stronger trading volume, could open the way toward the next key technical target around $4.60. The bullish scenario remains valid as long as the support zone continues to hold and overall market sentiment improves. Under these conditions, a move toward $4.60 could develop over the near term. Potential TP: 4.60 USD Disclaimer: This analysis is based solely on technical observations and reflects an opinion, not investment advice or a recommendation to buy or sell any financial instrument. Investing in financial markets involves risk, including the possible loss of capital. Always conduct your own research and consider consulting a licensed financial advisor before making investment decisions.
NASDAQ:LAESLong
by darksignal
DK - Delek US Holdings, Inc. WeeklyDelek US Holdings, Inc. engages in petroleum refining, and the transportation, storage, and wholesale distribution of crude oil. It operates through the following segments: Refining and Logistics, The Refining segment processes crude oil and other purchased feedstocks for the manufacture of transportation motor fuels, including gasoline, diesel fuel and aviation fuel, asphalt, and other petroleum-based products. The Logistics segment gathers, transports, and stores crude oil and markets, distributes, transports, and stores refined products. The company was founded in 2001 and is headquartered in Brentwood, TN.
NYSE:DK
by Esmail_from_Kuwait
META's Explosion at Price-Time Gate: Legendary Surge or Trap? 🌐META: The Macro Vector Matrix and the Imminent High-Velocity Expansion Phase ━━━━━━━━━━━━━━━━━━━━━━━━━━━━━━━━━━ 1. Structural Hypothesis This study is not a conventional technical analysis, nor is it a collection of retail chart patterns or speculative price projections. Instead, it is built upon a proprietary structural framework designed to decode market cycles through the convergence of price, time, geometric symmetry, and multi-layered structural compression across multiple macro timeframes. Within this framework, the primary macro cycle of META has evolved through a sequence of highly coordinated structural vectors, each serving as a critical stage in the development of the broader market architecture. The entire structural matrix originates from the historical Price-Time Box extending from the absolute low of 18.87 in November 2012 to the major cycle peak of 218.62 in July 2018. This foundational coordinate established the structural validation of Vector Alpha (v.α), which subsequently became the reference point governing every major macro development that followed. From this origin, the market successfully completed its historical expansion phases before entering the deep equilibrium reset represented by Vector Gamma (v.γ). Rather than signaling structural failure, this phase fulfilled the necessary conditions for a new macro cycle by restoring long-term balance throughout the entire framework. Following that reset, the market generated an upward directional correction toward Vector Delta (v.δ), completing the next major stage of the structural sequence. The inherent nature and behavioral dynamics of this Delta wave clearly demonstrate the immense potential and strength of the market's next directional move, which is anticipated to be highly sharp and accelerated. Importantly, the peak established at Vector Delta did not initiate a classical markdown phase. Instead, it marked the beginning of a sophisticated structural reorganization process that initiated precisely on February 10, 2025, and concluded on June 29, 2026. Throughout this period, price has continued to compress internally while maintaining the integrity of the broader macro structure. From the perspective of this model, the ongoing consolidation should not be interpreted as distribution or structural weakness. Rather, it represents a controlled phase of energy accumulation, during which both volatility and structural pressure are progressively compressed in preparation for the next macro expansion cycle. Consequently, the current market environment is viewed not as the conclusion of the existing trend, but as the final stage of structural preparation preceding the next high-velocity phase transition. ━━━━━━━━━━━━━━━━━━━━━━━━━━━━━━━━━━ 2. The Architecture of Terminal Compression The corrective and sideways development observed since META's late-2025 peak is not a random consolidation or a market driven by uncertainty. Within this framework, it represents a structured sequence that has evolved according to the laws of the price-time vector system. Throughout this period, the market has progressively constructed a flawless contracting compression matrix through the internal vector sequence of α➔β➔γ➔δ➔, culminating at Omega (ω) in July 2026. This entire consolidation cycle has successfully completed the higher-degree Vector Omega (v.ω) structure. This terminal structure is not only geometrically complete but also perfectly synchronized with the Vector Beta temporal anchor. Such alignment confirms that both the spatial and temporal dimensions of the macro cycle have matured simultaneously. The 540.40 level has consequently emerged as the definitive structural floor of the entire compression process. At this coordinate, structural compression, temporal maturity, and long-term geometric symmetry converge into a single decision zone, while continuing to respect the multi-year cycle originally established from the 2012 Price-Time Matrix. Within this model, the significance of this region extends far beyond conventional support or resistance analysis. It represents the final stage of structural equilibrium, where price, time, and behavioral organization become fully synchronized before the market commits to its next directional expansion. Historically, whenever price-time symmetry, structural compression, and geometric alignment reach this degree of coherence, the probability of a high-velocity structural phase transition increases dramatically. From the perspective of this framework, the ongoing consolidation should therefore be interpreted as a process of structural preparation rather than structural deterioration. The market has gradually absorbed volatility, balanced internal pressure, and accumulated the energy required for the next macro expansion. As a result, the current environment reflects a market that has reached structural maturity. Rather than remaining trapped in prolonged consolidation, the entire macro framework indicates that META is approaching the completion of its compression cycle and is becoming increasingly prepared for a decisive, high-momentum breakout into the next phase of its long-term structural evolution. ━━━━━━━━━━━━━━━━━━━━━━━━━━━━━━━━━━ 3. Structural Decision Window & Multi-Decade Confluence The macro and multi-year pathway ahead is strictly governed by two definitive structural boundaries: • Confirmation Zone: The definitive horizontal and vertical trigger that activates the entire macro expansion process. • 520.26 Level: The absolute structural invalidation boundary of the bullish framework. A high-volume breach below this level will signal that the complex reorganization process within Vector Omega (v.ω) at higher degrees is not yet concluded and requires further structural duration and corrective expansion. However, because the spatial compression, temporal symmetry, and overall market behavior are currently organized at the highest level of coherence, the probability of this invalidation scenario under the price-time vector system is approaching zero. ━━━━━━━━━━━━━━━━━━━━━━━━━━━━━━━━━━ 4. Primary Scenario: Generational Expansion & The 10-Year Structural Floor (High Probability) Upon a clean and high-velocity breakout through the initial Confirmation Zone, the market will encounter two highly critical algorithmic validation targets (the two major execution coordinates marked on the chart): 1. First Strategic Confluence Node: 1083.18 2. Second Strategic Confluence Node: 1233.86 These two coordinates are not merely price targets; they function as absolute "Time-Price Gates." A decisive breakthrough above these two specific spheres within their designated time windows will provide the ultimate structural validation for a historic, multi-decade expansion. Once these gates are conquered, the price-time vector system guarantees that META will not revisit these current structural floors for more than a decade (10+ Years). Following the successful unlock of these time gates, the macro trend will shift into a legendary, unhindered, and high-momentum expansion phase. Based on the hyper-extended matrix shown on the chart, the long-term targets are established at: • Fibonacci Extension Coordinate of 127.20% to price: 12190.36 • Fibonacci Extension Coordinate of 138.20% to price: 15960.53 • Fibonacci Extension Coordinate of 161.80% (4187% on the chart) to price: 20455.21 This final level represents the absolute spatial boundary and expansion capacity of the current structural cycle under the strongest possible institutional capital flows and macro accumulation. ━━━━━━━━━━━━━━━━━━━━━━━━━━━━━━━━━━ Conclusion & Research Signature This model defines the strict conditions under which actual market velocity can be evaluated against the predefined price-time vector system. The validity of this framework is measured not by random forecasting, but by the precise alignment of price and time. Ultimately, the market reveals its own path; however, the present structural setup indicates that META is on the verge of a massive, unavoidable phase transition that will completely redefine its valuation for the next decade. ━━━━━━━━━━━━━━━━━━━━━━━━━━━━━━━━━━ ✍ Mohsen Nirumand
NASDAQ:METALong
by MohsenNirumand
SPACE X A TRADE SEEN FROM SPACE AND MAYBE EVEN XThere is a trade window here. It looks good I think there is a chance. I hate explaining. It is pretty self explanatory. GL everyone/
NASDAQ:SPCXLong
by nicktussing77
11
Jul. 13th, 2026 Long - Research resultsThe market narrative is still "buy AI," but the binding constraint on AI has changed — and the tape already knows it. YTD: Energy +21%, Materials +17%, Industrials +12%, Technology flat. The thesis in one line: you no longer get paid for owning AI compute — you get paid for owning what AI compute cannot be built without: power, copper, grid equipment, and non-China critical materials.
NYSE:MOSLong
by pierre_radas
11
HOOD July 13 TA (15-Minute Chart)HOOD is sitting right on a key decision zone after a sharp intraday selloff and rebound attempts around the $111.00 area. The chart shows major weekly lines being tested, with nearby support at $110.64 and $106.89, while resistance sits overhead at $112.67, $115.79, and the bigger weekly shelf at $117.50. Earnings are in 16 days, so this setup can stay reactive to headline flow and positioning as we move through this week. I've mapped out three scenarios for the coming sessions: 🟢 Bullish Scenario (My Lean) This is the scenario I'm leaning toward. If HOOD can hold above $110.64 and reclaim $112.67 with strength, I’d look for a push into $115.79 and then the $117.50 weekly horizontal. A clean break and hold above $117.50 opens the door for a continuation move toward the $119.36 area and possibly higher if momentum expands. 🔴 Bearish Scenario If $110.64 fails and price starts accepting below the $108.69/$106.89 support band, the chart opens up to a deeper flush. In that case, I’d expect sellers to target the $98.96 weekly support zone first, with $105.00 and the low $100s acting as intraday waypoints on the way down. 🟡 Sideways Scenario This is the scenario that frustrates everyone. HOOD could remain boxed between roughly $110.64 and $115.79, chopping around the $111.02 midpoint while both calls and puts get punished by theta decay. That kind of range would likely keep the stock pinned until a catalyst or a clear break of the weekly levels forces direction. Earnings & Implied Move With earnings still 16 days away, implied volatility can stay elevated but also vulnerable to sudden expansion or a pre-earnings fade, followed by IV crush once the report hits. My Outlook If I had to rank the probabilities today: 🟢 Bullish (my current lean) 🟡 Sideways consolidation 🔴 Bearish That ranking can change quickly if HOOD loses $110.64 and fails to reclaim $112.67, or if it starts accepting above $115.79 and $117.50 with momentum. As always, the Heavy Diligence Options Signals Indicator will be my primary tool for entries and exits. While these scenarios provide the broader roadmap, the indicator is designed primarily for day trading on shorter timeframes, helping identify higher-probability Call and Put opportunities. Combining those signals with key technical levels helps improve risk management instead of simply guessing the next move. Disclaimer: This is only my interpretation of the current chart and is not financial advice. Always do your own research, wait for confirmation, and manage your risk before entering any trade.
NASDAQ:HOODLong
by heavydiligence
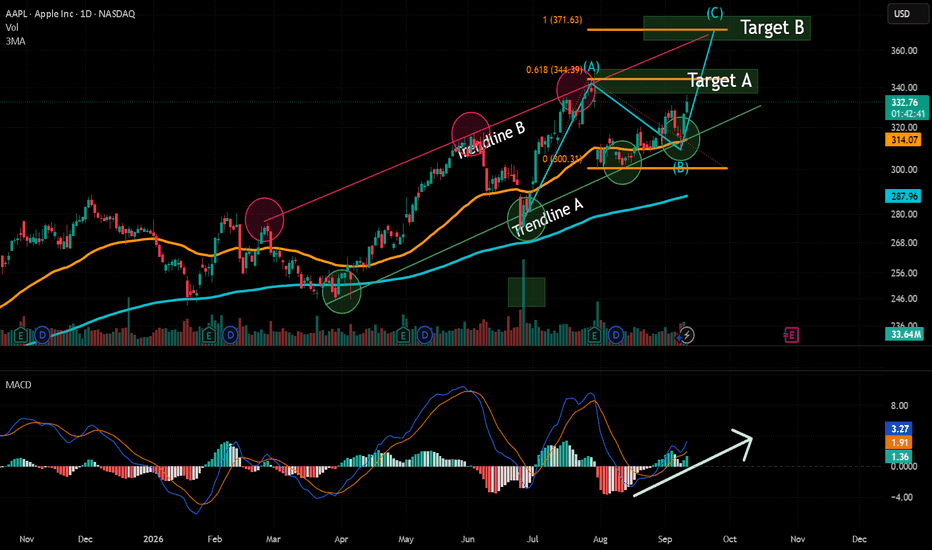
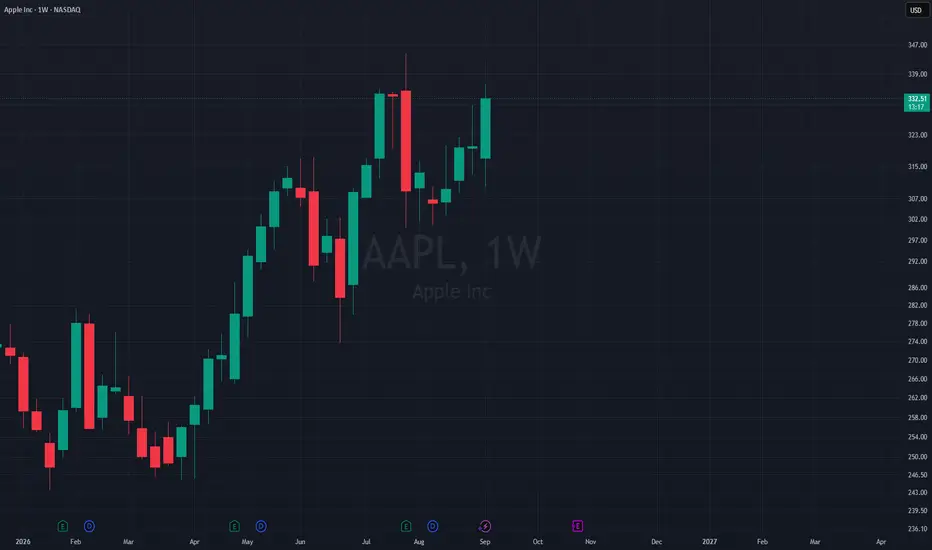
Apple Inc. (AAPL) Tradespoon – Long Setup $306.28Tradespoon model shows a long bias for NASDAQ:AAPL . Predicted range: $306.28–$318.86. Trend: +0.64% (high-quality mega-cap technology leadership, resilient fundamentals, and favorable macro conditions support the bullish setup). NASDAQ:AAPL
NASDAQ:AAPLLong
by yellowtunnel
Today, I’m calling what I believe could be a perfect 10x stock.It has everything I look for: exceptional business positioning, real profitability, and an extremely bullish chart setup. I rarely get this aggressive with a stock, but I’m convinced this is one of those rare, under-the-radar gems that the market still hasn’t fully discovered. I’m loading up heavily around the current price of $124. Talk is cheap. I’m putting my money where my mouth is. Come back in two years and judge this call. NASDAQ:PTC
NASDAQ:PTCLong
by JordanBelfort8
American Airlines and United Airlines Seek Technical SupportAmerican Airlines and United Airlines Seek Technical Support After a Mixed Earnings Season By Ion Jauregui – Market Analyst U.S. airlines are entering a new phase following an earnings season marked by very different messages. While Delta Air Lines surprised the market by reaffirming its full-year guidance, American Airlines and United Airlines adopted a more cautious tone, reflecting the uncertainty that still weighs on parts of the sector. The divergence in expectations is leading investors to increasingly differentiate between companies, rewarding those capable of maintaining high margins and passing higher operating costs on to consumers. American Airlines Maintains a Bullish Structure Despite the Correction From a technical perspective, American Airlines continues to maintain a constructive trend that began in April, characterized by a succession of higher highs and higher lows. After reaching a recent high of $19.10, the stock has corrected to trade around $16.95, with the overnight price close to $16.70. The former resistance at $16.50 is now acting as the first significant support level, while the next support levels are located at $15.37, coinciding with the origin of the latest bullish impulse, followed by $14.00 and $13.18, the starting point of the previous upward move. In the event of a deeper correction, the main long-term support levels are located at $10.09, with key lows at $9.48. From a longer-term perspective, the company moved from the highs recorded in January 2025 into a corrective phase that drove the share price down to the $8.50 area. It subsequently began a recovery during January 2026, followed by another correction to $10.09, from where the current bullish structure started to develop. Technical indicators continue to support this scenario, although they are showing a loss of short-term momentum. The RSI has moderated to 58.39 after leaving the overbought zone, while the MACD continues to correct, although both the MACD line and the signal line remain above the equilibrium level. The moving average crossover maintains an expansion configuration following the consolidation phase of the latest bullish impulse, and the price continues to trade well above its major moving averages. Meanwhile, the Point of Control (POC) is located at $11.43, well below the current share price, indicating that the bulk of traded volume remains concentrated at lower levels and reinforcing the strength of the bullish move developed over recent months. United Airlines Maintains a Positive Bias United Airlines also presents a favourable technical structure. Since mid-May, the stock has developed a sustained uptrend, posting higher highs and higher lows until reaching a recent high of $138.77. The stock is currently consolidating around $122.88, an area that coincides with the latest bullish impulse, while the premarket price stands at approximately $124.17. The most significant support levels are located at $118.70, followed by $110.66 and $102.40. Further below, the main structural lows remain at $88.55 and $84.64. Technical indicators show a pattern similar to that observed in American Airlines. The RSI has corrected from overbought territory to 55.27, moving closer to neutral levels, while the MACD also reflects slowing momentum, although both the MACD line and the signal line remain in positive territory. The moving average crossover continues to display an expansion configuration, and the price remains well above its key moving averages. The POC is located at $92.23, significantly below the current share price, indicating that the bulk of traded volume during the accumulation phase is concentrated at lower levels and continues to support the underlying bullish structure. Outlook The combination of still-favourable technical indicators and a more challenging operating environment leaves the airline sector at an inflection point. As long as the bullish structures remain intact, the market's focus is likely to shift from fuel price movements toward each airline's ability to preserve margins and sustain revenue growth. In this context, the performance of American Airlines and United Airlines will continue to depend on both the strength of travel demand and the companies' upcoming revisions to their financial guidance. - EN – ******************************************************************************************* The information provided does not constitute investment research. The material has not been prepared in accordance with the legal requirements designed to promote the independence of investment research and such should be considered a marketing communication. All information has been prepared by ActivTrades ("AT"). The information does not contain a record of AT's prices, or an offer of or solicitation for a transaction in any financial instrument. No representation or warranty is given as to the accuracy or completeness of this information. Any material provided does not have regard to the specific investment objective and financial situation of any person who may receive it. Past performance and forecasting are not a synonym of a reliable indicator of future performance. AT provides an execution-only service. Consequently, any person acting on the information provided does so at their own risk. Political risk is unpredictable. Central bank actions can vary. Platform tools do not guarantee success.
NYSE:LMT
by ActivTrades
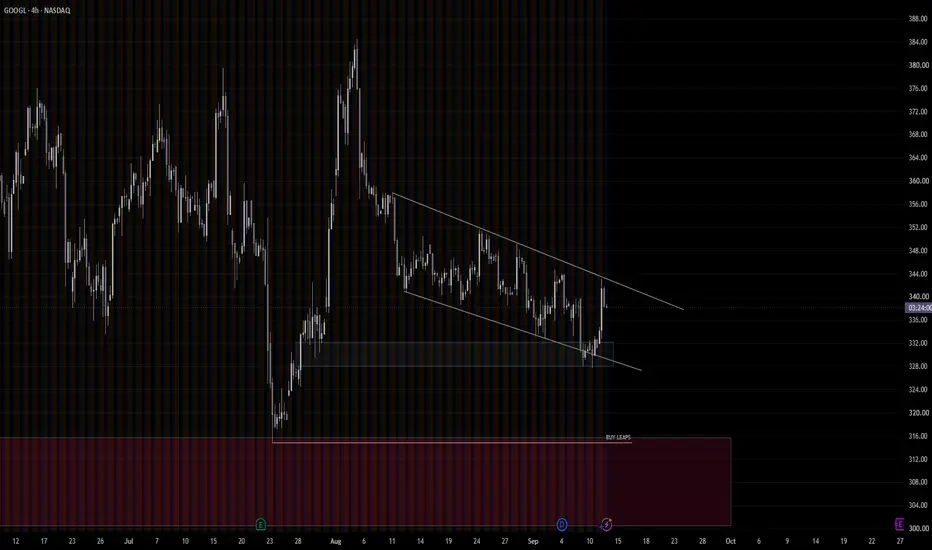
Alphabet Inc. ($GOOG) Daily: Rebounds Off 72-SMA FloorAlphabet Inc. ( NASDAQ:GOOG ) Daily: Rebounds Off 72-SMA Floor – Mapping High-RR Early Entry vs. Wave 3 Fibonacci Expansion ### 🇺🇸 Alphabet Inc. (Google) Class C ( NASDAQ:GOOG ) Daily Technical Blueprint (Ref: GOOG_2026-07-13_08-56-05.png) We are deploying an asymmetric structural study on Alphabet Inc. ( NASDAQ:GOOG ) on the Daily (1D) time matrix. Following a healthy corrective phase, price action has retraced precisely into a high-confluence institutional demand cluster, creating a highly compelling setup for both momentum breakout traders and risk-optimized swing traders. The stock is currently printing tight consolidation at **355.03 (-0.34%)**, with overnight order flow stabilizing around **354.09**. --- ### 🔍 Technical Architecture & Dynamic Defence 1. **The 72-SMA Dynamic Cushion:** The corrective leg has found an absolute technical floor right at the clustered **72-period SMA ribbon (orange line sitting at 354.23)**. This dynamic support lines up seamlessly with our primary ascending macro trendline (lower black diagonal LTA), validating deep institutional absorption. 2. **The Aggressive Early Entry Matrix (356.73):** For systematic market participants willing to accept higher immediate execution risk in exchange for institutional risk/reward metrics, an early entry can be localized around **356.73**. * **The Invalidation Level (Stop Loss):** Tightly secured just below the structural swing low printed on the July 10th daily candle. This invalidation placement minimizes capital exposure. --- ### 📈 The Breakout Trigger & Wave 3 Target Matrix (Blue Vector) As modeled by our prominent blue upward expansion vector, the broader macro structure is coiled for an aggressive impulsive continuation: * **The Breakout Trigger (370.89):** A decisive daily candle close above the **370.89** corridor (aligning closely with the 0.618 Fibonacci node and the historical **371.44** horizontal red supply resistance) will officially validate a macro structural shift. * **The Core Wave 3 Target (386.00):** Clearing the breakout trigger unlocks the technical highway for a textbook Elliott Wave 3 expansion. The mathematical 100% Fibonacci projection sequence maps out a primary upside destination locked precisely at **386.29**. ### 📊 Tactical Setup Summary: * **Trend Bias:** Bullish (Dynamic Rebound Phase) * **Early Tactical Entry:** 356.73 * **Protective Stop Loss:** Micro low of the 10/07 candle. * **Breakout Trigger Confirmation:** Daily close above 370.89. * **Core Target 3 (Fibonacci 100%):** 386.29 --- 📊 **ChartPro Data** *US Equity Architecture, Fibonacci Expansion Frameworks & Precision Asymmetric Risk Sourcing.* ⚠️ **Disclaimer:** For educational and informational purposes only. This active market study represents a personal trading framework and does not constitute financial or investment advice.
NASDAQ:GOOGLong
by ChartPro_Data
Can Palantir Really Reach a $400 Billion Valuation?Palantir Technologies is rapidly dominating the enterprise software landscape. Wall Street analysts project a staggering $400 billion market capitalization by next year. The company is shedding its old reputation as a mere government contractor. Today, Palantir serves as the foundational operating system for global industries. Geopolitics and Geostrategy Global conflicts weaponize information. Western defense agencies rely heavily on Palantir Gotham to process battlefield data. The company acts as a geostrategic deterrent in modern electronic warfare. Palantir aligns its corporate mission directly with Western democratic institutions. Consequently, authoritarian regimes cannot purchase its software. This firm ideological stance guarantees steady, long-term government defense revenue. Macroeconomics and Economics Stubborn inflation forces corporations to maximize operational efficiency. Palantir capitalizes heavily on this harsh economic climate. Its Artificial Intelligence Platform (AIP) delivers rapid, measurable cost savings. During market downturns, enterprises cut experimental tech spending. However, companies aggressively increase investments in proven data infrastructure. This macroeconomic shift fuels Palantir’s explosive financial growth. Industry Trends and Business Models Enterprise software is pivoting toward autonomous, agentic operations. Palantir leads this trend through its innovative Foundry platform. Its unique business model focuses on rapid deployment via targeted boot camps. These interactive sessions turn hesitant prospects into paying customers within days. Commercial revenue now matches government intake. Palantir expands globally, landing major Latin American deals like Mexico's GNP Seguros. Management, Leadership, and Culture CEO Alex Karp rejects conventional Silicon Valley corporate norms. He actively fosters an aggressive, mission-driven engineering culture. This unique leadership style prizes critical thinking over corporate conformity. Palantir attracts elite tech talent seeking high-impact, real-world challenges. Management empowers small engineering teams to build decentralized solutions. This lean organizational design guarantees rapid product iteration cycles. Technology, Science, and High-Tech Palantir builds highly advanced data integration plumbing. Its new AIP Analyst tool allows non-technical workers to query data using plain language. The platform integrates machine learning with complex physical science workflows. Aerospace and supply chain sectors use it to map molecular-level dependencies. Palantir transforms raw enterprise data into a dynamic, living digital twin. This technological leap changes how humans interact with machine intelligence. Cybersecurity and Data Governance Modern cyber threats bypass traditional network perimeters. Palantir enforces absolute security through granular, cell-level data permissions. The platform provides flawless data traceability and immutable compliance audits. Hackers cannot easily compromise decentralized, highly governed networks. Companies manage sensitive consumer records securely while deploying advanced AI tools. Palantir proves that rapid automation requires bulletproof data governance. The Pharmaceutical Connection The pharmaceutical sector relies on Palantir to accelerate drug discovery. Researchers unify disparate genomic datasets, clinical trials, and manufacturing supply chains. Palantir helps scientists identify promising chemical compounds years ahead of schedule. Healthcare titans optimize distribution networks during global supply shocks. Consequently, life-saving medications reach patients with unprecedented speed. Patent Analysis Intellectual property securement drives Palantir's competitive moat. Patent filings show heavy investment in ontology-based data structures. The company aggressively patents proprietary methods for multi-layer data synchronization. These patents prevent competitors from replicating Palantir’s core data integration architecture. Analysts view this robust patent portfolio as a massive barrier to market entry. Innovation ownership guarantees long-term commercial dominance.
NASDAQ:PLTRLong
by TradeThePool
112233445566778899101011111212131314141515161617171818191920202121222223232424252526262727282829293030313132323333343435353636373738383939404041414242
…999999

Made by humans

Select market data provided by ICE Data Services. Select reference data provided by FactSet. Copyright © 2026 FactSet Research Systems Inc.Copyright © 2026, American Bankers Association. CUSIP Database provided by FactSet Research Systems Inc. All rights reserved. SEC filings and other documents provided by Quartr.© 2026 TradingView, Inc.

More than a product
  • Supercharts
Screeners
  • Stocks
  • ETFs
  • Bonds
  • Crypto coins
  • CEX pairs
  • DEX pairs
  • Pine
Heatmaps
  • Stocks
  • ETFs
  • Crypto coins
Calendars
  • Economic
  • Earnings
  • Dividends
  • IPOs
More products
  • News Flow
  • Portfolios
  • Fundamental Graphs
  • Yield Curves
  • Options
  • Macro Maps
  • Pine Script®
Apps
  • Mobile
  • Desktop
Community
  • Social network
  • Wall of Love
  • Refer a friend
  • House Rules
  • Moderators
Ideas
  • Trading
  • Education
  • Editors' picks
Pine Script
  • Indicators & strategies
  • Wizards
  • Freelancers
  • Paid Spaces
Tools & subscriptions
  • Features
  • Pricing
  • Market data
  • Gift plans
Trading
  • Overview
  • Brokers
  • Brokers comparison
  • The Leap
Special offers
  • CME Group futures
  • Eurex futures
  • US stocks bundle
About company
  • Who we are
  • Space mission
  • Blog
  • Help Center
  • Careers
  • Media kit
Merch
  • TradingView store
  • Tarot cards for traders
  • The C63 TradeTime
Policies & security
  • Terms of Use
  • Disclaimer
  • Privacy Policy
  • Cookies Policy
  • Accessibility Statement
  • Security tips
  • Bug Bounty program
  • Status page
Business solutions
  • Widgets
  • Charting libraries
  • Lightweight Charts™
  • Advanced Charts
  • Trading Platform
Growth opportunities
  • Advertising
  • Brokerage integration
  • Partner program
  • Education program
Community
  • Social network
  • Wall of Love
  • Refer a friend
  • House Rules
  • Moderators
Ideas
  • Trading
  • Education
  • Editors' picks
Pine Script
  • Indicators & strategies
  • Wizards
  • Freelancers
  • Paid Spaces
Business solutions
  • Widgets
  • Charting libraries
  • Lightweight Charts™
  • Advanced Charts
  • Trading Platform
Growth opportunities
  • Advertising
  • Brokerage integration
  • Partner program
  • Education program
Look FirstLook First