• Products
  • Community
  • Markets
  • Brokers
  • More
Get started
  • Markets
  • /USA
  • /Stocks
  • /Ideas
JPM Coiling Into Earnings? July 13 JPM is coming into the week with the daily trend still bullish, but price is sitting directly under a major resistance area around 339.50–342. On the 15-minute chart, JPM is tightening between rising support and descending resistance near 336–337. This kind of compression can create a strong move, but earnings and CPI are both coming Tuesday, so I would not try to predict the direction before the news. Daily Chart The daily structure remains bullish with higher lows and a strong move from the 290 area into the 340 area. JPM is now consolidating near the highs instead of giving back the entire move. That tells me buyers are still interested, but they have not been able to clear the 339.50–341.91 resistance zone yet. A daily close above 341.91 would confirm a new breakout and give JPM room to continue toward 345, 350 and possibly 360. The larger trend remains healthy while price stays above the recent breakout area around 314–315. For this week, however, the more important short-term support is around 330–332.50. 15-Minute Chart The 15-minute chart shows JPM forming a tightening triangle around 336.50. The immediate resistance is around 337.30, followed by Friday’s high near 339.41. The immediate support is around 335.75, with another important support near 334. This is a decision area. A break above 337.30 could send price back toward 339.41 and the 340 call wall. A loss of 335.75 could bring 334 and 332.50 back into play. I would not take the first breakout candle without confirmation. With earnings approaching, JPM could easily make a quick move in one direction and then reverse. Key Levels Resistance: 337.30, 339.41, 340, 341.91, 345, 350, 355, 360 Support: 336, 335.75, 334, 332.50, 330.80–330, 327.50, 320, 314–315 GEX Positioning The GEX chart shows JPM trading between support near 335 and the main nearby call wall around 340. That makes 335–340 the most important short-term range. While JPM remains inside this zone, positive GEX could keep price pinned and create choppy movement. The better directional trade may come only after price clearly accepts above 340 or breaks below 335. Above 340, the next GEX levels are 345, 350, 355 and 360. The strongest upside targets appear to be 340 first, followed by 350 and 360. On the downside, 332.50 is the first important put level. Below that, 330 becomes the next support, followed by the high-volume level around 327.50. The 332.50–327.50 area could become the downside target zone if JPM loses 335 after the earnings reaction. Bullish Scenario For the bullish setup, I want JPM to hold above 335.75–336 and reclaim 337.30. A break above 337.30 would put 339.41 and 340 back in play. The stronger confirmation would be a 15-minute close above 340 followed by a successful retest. That would show JPM is accepting above the call wall instead of only producing a temporary earnings spike. Above 340, I will watch 341.91, 345 and 350. If buyers can hold above 350, the next larger targets would be 355 and 360. Bearish Scenario For the bearish setup, I will watch for another rejection around 337.30–340. If JPM rejects that area and then loses 335.75, the short-term structure would begin weakening. Below 335.75, I will watch 334 and the 332.50 put level. A confirmed break below 332.50 could open the move toward 330 and 327.50. If 327.50 fails, the earnings gap could continue lower toward 320 and potentially the larger daily breakout area around 314–315. Earnings and CPI Risk JPMorgan is scheduled to release its second-quarter results at approximately 7:00 a.m. ET Tuesday, July 14, followed by its earnings call at 8:30 a.m. ET. CPI is also scheduled for 8:30 a.m. ET that morning, so JPM could react to both company results and the broader interest-rate move at nearly the same time. Because of that combination, Tuesday could produce a large opening gap, wide candles and quick reversals. I would let the first move settle and wait for the opening range, VWAP and a retest of one of the major GEX levels. Options Outlook The chart shows IV Rank around 29.6 and average implied volatility near 26, but earnings can quickly change option pricing. Holding short-dated contracts through the announcement carries major gap and volatility-crush risk. For an intraday trade, I would rather wait until after the earnings reaction and trade the confirmed move. Calls become more attractive if JPM holds above 340 after the initial volatility. Puts become more attractive if JPM loses 335 and confirms below 332.50. Conclusion JPM remains bullish on the daily chart, but price is still trapped below major resistance. Above 340, I will watch 341.91, 345 and 350. Below 335, I will watch 332.50, 330 and 327.50. The main range is 335–340. With earnings and CPI arriving Tuesday, the cleanest setup will likely come after JPM breaks this range and confirms the direction instead of during the first volatile move.
NYSE:JPM
by BullBearInsights
PLTR Coiling for the Next Move? July 13 PLTR is coming into the week sitting inside a tight decision zone around 125–130. The daily chart is trying to recover after the sharp drop toward 106, but price is still below the key 129–130 resistance area. For me, this is not a place to guess direction. I want to see whether PLTR can reclaim 129–130 and hold, or lose 125 and start another move lower. Daily Chart The daily chart shows PLTR bouncing strongly from the 106.37 low, but the larger structure has not fully turned bullish yet. Price is currently sitting around 126–127 and continues to struggle below 129.24. This area acted as an important support level before the selloff, so it may now become resistance. A daily close above 129.24–130 would be the first sign that buyers are taking control again. Above 130, I will watch 135, 140 and then the larger resistance area around 162.67–165.57. The bullish structure becomes much stronger only if PLTR can eventually reclaim the 162–166 area. On the downside, 125 is the first important support. If PLTR loses 125, the next larger downside levels are 120 and then the previous low around 106.37. 15-Minute Chart The 15-minute chart shows PLTR consolidating after the rejection from 132.28. Price is now trading in a very tight range near 126.50, with support around 125.75–125 and resistance around 127.25–128. The stock is also trading below the short-term moving average, so buyers still need to prove that they can reclaim 127.25 and push back toward 128–130. This tight consolidation can lead to a strong move, but I would wait for price to break the range with volume instead of entering while it stays trapped in the middle. Key Levels Resistance: 127.25, 128, 129, 130, 132.28, 133, 135, 140 Support: 126, 125.75, 125, 124.80, 120, 116, 115, 106.37 GEX Positioning The GEX chart shows 125 as the main high-volume level and near-term support. PLTR is currently trading just above this area, so 125 may act as a magnet and keep price pinned until buyers or sellers create enough volume to break away from it. The first upside GEX level is around 127, followed by 129 and 130. The 130 level appears to be the most important nearby call wall. That means PLTR could struggle or slow down near 130 unless buyers come in with strong volume. Above 130, the next upside GEX levels are 133, 135 and 140. On the downside, 120 is the main put wall and the most important bearish target if 125 fails. Below 120, the next put levels are around 116 and 115. The GEX structure suggests PLTR may stay inside the 125–130 range until a catalyst forces a larger move. Bullish Scenario For the bullish setup, I want PLTR to hold above 125 and reclaim 127.25–128. A 15-minute close above 128 would give buyers a better chance of pushing into 129 and 130. The stronger confirmation would be a break above 130 followed by a successful retest. Above 130, I will watch 132.28, 133, 135 and then 140. If PLTR can break and hold above 140, the daily chart would have more room to recover toward the larger 162–166 resistance zone. Bearish Scenario For the bearish setup, I will watch for rejection around 127.25–130. If PLTR continues failing below this area and then loses 125, the short-term structure would weaken. A confirmed 15-minute close below 125 could open the move toward 124 and then the major 120 put wall. If 120 fails, the next downside targets would be 116 and 115. A larger breakdown below 115 could eventually bring the previous daily low around 106.37 back into play. Trade Considerations PLTR is currently sitting near the middle of the 125–130 GEX range, so this could remain choppy until price clearly breaks one side. For calls, I want to see PLTR reclaim 127.25–128, then confirm above 130. For puts, I want to see rejection from resistance followed by a clean loss of 125. I would also watch the opening range and VWAP. A breakout without volume could quickly fail because the GEX levels are positioned close together. Options Outlook The chart shows IV Rank around 59 and average implied volatility near 65.6, so options premium is already elevated. Because of that, I would avoid chasing contracts while PLTR remains stuck between 125 and 130. The cleaner opportunity may come after price breaks the range and confirms direction with a retest. Conclusion PLTR is trying to build a base, but buyers still need to reclaim 129–130 before the chart becomes more bullish. Above 130, I will watch 132.28, 133, 135 and 140. Below 125, I will watch 120, 116 and 115. The main decision zone this week is 125–130. A clean break from this range could create the next strong trading opportunity.
NASDAQ:PLTR
by BullBearInsights
NVDA Ready for 215? July 13 NVDA is coming into the week with strong short-term momentum after making a sharp move from around 200.70 to 211.10. Price is now consolidating near the highs instead of immediately selling off, which keeps the bullish setup alive. However, I would not chase NVDA directly under resistance. The main question is whether buyers can hold 210 and push through 211.10–212.50, or whether this becomes another rejection below the daily downtrend line. Daily Chart The daily chart is recovering, but NVDA has not fully broken out yet. Price bounced strongly from the 193–195 area and reclaimed 200 and 206.47. The next important test is the descending daily trendline, which is coming into the 213–215 area. That means 213–215 is more than just a GEX resistance zone. It also lines up with the larger daily technical resistance. A clean daily break and hold above 215 would be a meaningful change in structure and could open the door toward 220, 230 and eventually the previous high around 236.26. As long as NVDA remains below that trendline, traders should still be prepared for rejection and consolidation. 15-Minute Chart The 15-minute chart shows a strong breakout from around 201–202, followed by continuation into 211.10. After reaching 211.10, NVDA began trading sideways around 210.50 instead of giving back the move. That is constructive because buyers are still holding near the highs. The immediate support is around 210–209.50. If buyers continue defending this area, NVDA can make another attempt at 211.10 and 212.50. The chart becomes weaker if price loses 209.50 and cannot quickly reclaim it. That could send NVDA back toward the overnight level around 208.40 and the next GEX support at 207.50. Key Levels Resistance: 211.10, 212.50, 213, 215, 220, 230, 236.26 Support: 210–209.50, 208.40, 207.50, 205.50–205, 202.50, 200.70–200, 195, 190 GEX Positioning The GEX chart shows 210 as the main near-term pivot and call level. NVDA is currently trading slightly above 210, so this level may act as support if buyers continue holding it. However, positive GEX can also keep price pinned around this area until enough volume enters the market. The next overhead GEX levels are 212.50, 213 and 215. The 212.50–215 area is the most important upside zone because it combines several call levels with the descending daily trendline. Price could slow down or reject there unless buyers enter with strong volume. On the downside, the first support levels are 207.50 and 205. The 205 level appears to have meaningful GEX support and also lines up with the earlier breakout area. Below 205, the next levels are 202.50 and 200. The larger high-volume level is near 195, with the main put level around 190. Bullish Scenario For the bullish setup, I want to see NVDA continue holding above 210–209.50. A break above 211.10 would be the first sign that buyers are ready for continuation. The next targets would be 212.50, 213 and then 215. The better confirmation would be a 15-minute close above 212.50 followed by a successful retest. That would give NVDA a better chance of reaching 215. If NVDA can break and hold above 215, I will start watching 220 as the next upside target. A daily close above the descending trendline would strengthen the larger breakout setup toward 230 and 236.26. Bearish Scenario For the bearish setup, I will watch for rejection between 211.10 and 212.50. If NVDA rejects this zone and then loses 209.50, the short-term momentum would begin weakening. Below 208.40, the next support is 207.50. If 207.50 fails, NVDA could rotate back toward the stronger 205 support area. A confirmed break below 205 would expose 202.50 and 200.70–200. Losing 200 would be a larger warning because it would put 195 back in play. Below 195, the next major downside GEX level is around 190. Trade Considerations NVDA is currently sitting in a tight range between the 210 pivot and resistance around 211.10–212.50. Inside this range, the stock may stay choppy and options could lose value while price remains pinned. I would rather wait for the opening range, VWAP confirmation and a clean breakout or breakdown retest. For calls, I want price holding above 210 and confirming above 211.10–212.50. For puts, I want to see rejection from resistance followed by a loss of 209.50 and 208.40. Options Outlook The chart shows IV Rank around 27.6 and average implied volatility near 43. Options are not showing the same extreme premium conditions as AMD, but traders still need enough movement to overcome time decay. The cleaner opportunity may come after NVDA breaks out of the 209.50–212.50 range. Conclusion NVDA has strong short-term momentum, but it is approaching a major decision area. Above 212.50, I will watch 213, 215 and 220. Below 209.50, I will watch 208.40, 207.50 and 205. The most important zone this week is 212.50–215 because it combines GEX resistance with the descending daily trendline. A confirmed break above 215 could change the larger structure. A rejection from that area could send NVDA back toward 207.50–205 before buyers try again.
NASDAQ:NVDA
by BullBearInsights
11
AMD Breakout Loading? July 13 AMD is coming into this week with strong momentum, but price is sitting right under an important decision area around 560–565. The daily trend is still bullish, and the 15-minute chart shows AMD recovering from 537, reclaiming 550 and 555, then holding tight near the highs. This is a good setup, but I would not chase it here. I want to see AMD clearly break and hold above 560.25–565 before calling for the next leg higher. Daily Chart The daily structure still looks strong with higher highs and higher lows, and price continues to respect the rising trendline. The main upside level is the previous high around 584.73. If AMD can break above that area and hold, I will be watching 590 and then 600. As long as AMD stays above the recent 537 swing low, the larger bullish structure remains intact. A break below 537 would be the first real warning that the trend is starting to weaken. 15-Minute Chart On the 15-minute chart, AMD made a strong move from 537 and is now consolidating just under 560.25. This tight consolidation near the highs is bullish, but traders still need confirmation. I would rather wait for a 15-minute candle to close above resistance and then see if buyers can defend the retest. The short-term structure remains bullish above 555–556. If AMD holds this area, buyers can continue pushing into 560.25 and 565. If 555 fails, price may rotate back toward 552.50 and 550. Key Levels Resistance: 560.25, 565, 580, 584.73, 590, 600 Support: 557–555, 552.50, 550–547.50, 539.50–537, 530, 515 GEX Positioning The GEX chart shows AMD trading between support around 555 and 552.50, with the first major upside resistance around 565. Above 565, the next important call levels are 580, 590 and 600. The 590 area appears to have the strongest overhead call concentration, which also lines up closely with the daily resistance around 584.73. That makes the 580–590 area an important target zone, but also an area where price could slow down or reject. On the downside, 547.50 is the first important put level. If AMD loses 547.50, volatility could increase and push price back toward 537 and 530. The deeper downside GEX support is around 515. Bullish Scenario For the bullish setup, I want AMD to hold 555 and break 560.25 with strong volume. A clean 15-minute close above 565, followed by a successful retest, would give a better confirmation for continuation. The upside targets would be 580, 584.73 and then 590. If AMD can accept above 590, the next major target would be 600. Bearish Scenario For the bearish setup, I will watch for repeated rejection around 560.25–565. If AMD rejects this area and then loses 555, the short-term momentum will start weakening. Below 552.50, price could move back toward the 550–547.50 support zone. A confirmed break below 547.50 would open the door toward 539.50–537. If 537 fails, the recent higher-low structure would break, and 530 could become the next downside target. Trade Considerations This week has several major market catalysts, so AMD may react more to the overall Nasdaq and semiconductor sector than to its own company news. Because the options premium is already elevated, I would avoid chasing the first move. I would rather wait for the opening range, VWAP confirmation and a clean breakout or breakdown retest. Inside the 555–565 range, AMD could stay choppy and pinned by GEX. The better trade may come only after price clearly leaves this range. Conclusion AMD still looks bullish, but 560.25–565 is the main decision zone. Above 565, I will watch 580, 584.73, 590 and 600. Below 547.50, I will watch 539.50, 537 and 530. The main question this week is whether AMD can break out of the 555–565 GEX range or continue trading sideways until a major market catalyst creates the next move.
NASDAQ:AMD
by BullBearInsights
$MAWatching credit card companies closely. If economic growth slows in Q3 because of fiscal and political uncertainty, access to credit could become even more important for consumers and businesses managing cash flow. The interesting part: many card issuers are still competing with new offers and incentives. That doesn’t automatically mean the economy is getting stronger it could also reflect competition for high-quality borrowers. Credit isn’t income. It’s liquidity. The question I’m watching:
Will consumer credit continue supporting spending, or will tighter financial conditions eventually slow demand?
NYSE:MA
by TheMoney_Association
RIOT: Down, but not out...yet!Since my last analysis, much has happened. There was a clear fake breakout that resulted in a larger correction. This highlights the importance of setting a stop loss, no matter how good the price action looks. So, what happens now? As overall markets look to be consolidating, there is no clear indication of which way things will resolve. Even though RIOT is trying to improve its business fundamentals, the stock price will somewhat be tied to the overall market conditions. For now, the bull case still seems to be the path of least resistance. RSI in 12 hour and daily showing hidden bullish divergence. RSI reading in 12 hour is in oversold condition; and getting close to oversold in daily timeframe. So, in the near term, once this leg of correction is over, we should see at least some reaction to the upside. The big question would be, if it just a reaction or a trend reversal. Looking at EW count, my last count of 1/2, 1/2 is not valid any longer as the pivot of $23.5 got broken. Now, it seems like an expanded flat with C wave neat completion. Even though, price can fall quite a bit more and still be within the count parameters, I would like this correction to hold the previous support area red box. There are some daily timeframe price gaps I have notated on the chart where price can go back and resolve. However, if the red box does not hold support, then bull case will need to be seriously reconsidered. To conclude the near-term analysis, the 5 wave move down seems to be a C wave. Expecting a bounce sometime next week. If that bounce comes in a form of 3 waves and price starts to head back down, then bull case needs to be re-evaluated. I have a small short position, that I will close out early next week, but will things closely before going long again.
NASDAQ:RIOT
by mukit1
NVDA Breaking Out Falling Wedge - Needs to Hold 50 MA NVDA Breaking Out Falling Wedge - Needs to Hold the 50 SMA & clear this resistance but if buyers step in, or there's any catalyst NASDAQ:NVDA could really run - It needs to clear this level. It is currently testing key resistance after forming a nice double bottom / W off the 200-day SMA. EMA's are also curling upwards (Not pictured) - Watching Close as if NASDAQ:NVDA really runs it could pull the broader markets AMEX:SPY SPCFD:SPX NASDAQ:QQQ with it.
NASDAQ:NVDALong
by jacobosiason7
11
Accenture (ACN): Falling-Angel in the selloff ...[Accenture (ACN): Falling-Angel in the selloff — Navarro200 signals a bottom formation ... NYSE:ACN www.tradingview.com Hello ❤TradingView Community😍 Accenture plc (NYSE: ACN) - On the weekly-chart. This idea highlights the major, multi-year correction following the all-time high of $417.37 (Dec 2021) and focuses on the resulting Navarro200 harmonic pattern. The chart shows a clean, symmetrical M-pattern (X-A-B-C-D) with a distinct potential reversal zone near the current low. A further price decline toward the key psychological level of $100 or a dip just below it must be factored in. Potential PRZ/bottom range: $118–$135 (D-zone; marked on the chart as $118.15, current price range around $135) Interpretation of the Navarro200 Pattern concept: Following a strong rally (X→A), a three-phase correction complex is being completed (A→B→C→D). The completion at D often results from the convergence of multiple Fibonacci projections/retracements. This exact overlap is present here—a classic sign of a potential trend reversal or, at the very least, an extended rebound phase. Significance of 242.80 USD: This level acts as the pattern’s “central axis/neckline” and as a prominent retracement pivot. A sustained rise above this level would significantly strengthen the bullish scenario and open up room toward the higher retracement targets. Possible bottom-forming-phase + key volume-levels (volume-profile) - monthly-chart Following a correction of approximately 72%, the price has fallen into the PRZ and is showing initial signs of stabilization. For a valid bottom to form, I expect: A sideways/accumulation phase spanning several monthly candles between approximately 118 and 155 USD. A higher low above the D-zone (ideally >$125–130) as confirmation that sellers are running out of steam. A monthly close above a nearby trigger zone—typically $155/$165—as the first structural signal. A breakout above 242.80 USD would be the second, stronger confirmation that the market is shifting from “bottom” to “trend reversal” mode. Potential Wolfe-Wave From Elliott Wave's perspective Scenarios Bullish: Stabilization above 125–130 USD, breakout >155/165 USD, followed by a rally toward 200 and 232–243 USD. A breakout and hold above 242.80 USD opens the path to 268/302 USD. Bearish/Invalidation: A monthly close below 118 USD negates the bottom hypothesis. In this case, psychological round numbers (100 USD) and lower historical zones come into focus. Risk Management (for Swing/Position Traders) Aggressive: Open a partial position in the D-zone (125–140 USD) with a tight stop-loss below 118 USD; add to the position upon confirmation (monthly close >155/165 USD). Conservative: Wait to trade until the monthly close is above 165 USD or until 200 USD is regained; a second surge above 242.80 USD would confirm the trend. Adjust position size to the monthly time frame; be mindful of event risks (earnings, macro, USD strength). Conclusion Accenture is showing a large Navarro200 pattern with clean convergence at the D-Zone around 118–135 USD. Such setups often mark the end of cyclical corrections. An extended bottoming phase is likely; clear bullish signals will only emerge with successive higher lows and monthly closes above 155/165 USD—and will be structurally confirmed above 242.80 USD. Until then, patience and disciplined risk management remain key. As always, this is not investment advice. I am not personally invested. I look forward to hearing your opinions and seeing your charts😍 — how are you trading this potential bottoming pattern in ACN ? Have a good start to the week & successful trading decisions 💪 M_a_d_d_e_n ✌ NOTE: The above information represents my idea and is not an investment/trading recommendation! Without any guarantee & exclusion of liability!
NYSE:ACN
by M_a_d_d_e_n
1212
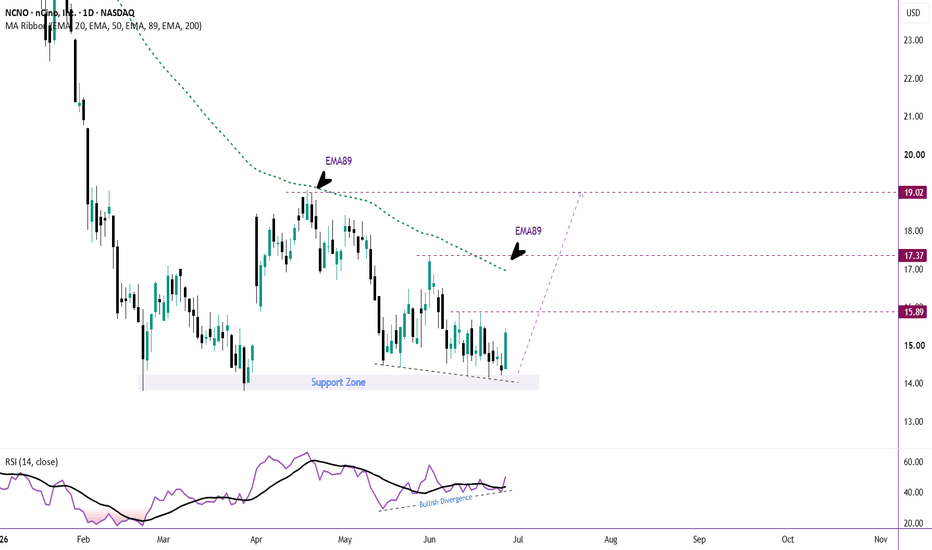
bjdx chart analysis Rsi is oversold 7 day moving average crossed Personally i am taking a long position here as historically most stocks tends to recover from being oversold. Not an expert here so any feedback would be appreciated and helpful!
NASDAQ:BJDXLong
by emonr11
22
Racing is on progress Hi community Long time no see, Let’s try this Bye
NASDAQ:AVPTLong
by lyndr
$ABNB Multi-year consolidationNASDAQ:ABNB — Watching This Setup Weekly chart, price reclaiming $148.62 after a two-year range. - Broke down from ~$170 in 2022, bottomed near $85 in early 2023 - Spent 2024–2026 chopping in a $110–$140 range - Just pushed above that range on rising volume Why this matters. A multi-year range breakout is one of the cleanest technical signals — it means supply that capped price for two years just got absorbed. Doesn't confirm a trend by itself, but it's the first sign to take seriously. What we're watching. Does price hold above the old range (~$140) on a pullback, or is this a fakeout back into the chop? That retest is the tell, not this breakout candle. Status: watchlist only. No position. No structure picked yet. This is chart study, not a trade call. *Educational content, not financial advice.*
NASDAQ:ABNBLong
by StratKing_24
NVDA at $5 Trillion and Still Climbing: The Bull Case Isn't OverNVDA continues to respect its bullish 4H structure after reclaiming the $202 to $205 breakout zone, with buyers now challenging the key resistance at $211.08. As long as the higher low structure remains intact, the path of least resistance is still to the upside, though this is no longer a low-risk chase zone. The technical setup is now lining up with a strong fundamental catalyst. The market is closely watching whether hyperscaler AI spending remains strong through upcoming earnings. At the same time, Nvidia's valuation has compressed to its lowest level in years, creating the potential for another re-rating if earnings continue to validate the AI infrastructure story. The main risk to monitor is the increasing investment by large tech companies in custom AI silicon, which could gradually reduce dependence on Nvidia over the long term. From a chart perspective, a clean acceptance above $211.08 could open the door toward the $213 to $215 region by clearing the buy-side liquidity above the highs. If buyers fail to sustain the breakout, I'd rather see price revisit the $209 to $206 demand zone, where the risk-to-reward becomes much more attractive while keeping the broader bullish structure intact. Question: Do you think the next earnings cycle will be enough to push NVDA into another valuation re-rating, or will concerns over custom AI chips keep capping upside despite the bullish chart?
NASDAQ:NVDA
by zenthena00
$SPCX: The Real Selling Pressure Hasn't Arrived YetNASDAQ:SPCX went public on June 12, peaked at $225 just four trading days later, and has since pulled back to around $145 — a correction of roughly 35%. Is $145 the bottom? The real selling pressure hasn't even started yet because the IPO lock-up period hasn't expired. Insider shares will be released in stages: Late July: First 20% of insider shares become eligible for sale. August–October: Another 35% unlocks every two weeks. December 8: Remaining shares are fully unlocked. At this point, we still don't know whether $145 will hold as the cycle low. If the $145–150 support zone survives through the entire lock-up schedule, we could see a strong rally toward $280. However, if price breaks below $135–130 in the coming months, SPCX could enter a prolonged accumulation phase , with downside potentially extending toward $84 . My View SPCX has the potential to become one of the biggest opportunities of the year. But the risk of further downside is very real, which is why I don't think now is the right time to build a position. Patience pays. I'll share my entry plan once the market offers a high-probability setup. Hopefully, we'll catch what could become a once-in-a-generation buying opportunity. If you also like planning your U.S. stock trades over the weekend—without constantly switching between Gold, Crypto, and stock trading apps—you should check out rToken. Unlike synthetic assets that rely on price oracles or on-chain liquidity pools, Bitget's rToken routes orders through broker channels directly to the real NASDAQ and NYSE order books, enabling 24/7 trading while preserving real U.S. equity liquidity with the efficiency of the crypto market. It brings together the best of both worlds: authentic stock market execution and around-the-clock crypto trading.
NASDAQ:SPCXShort
by GDJ_Jinn
Why SK Hynix listed in the US? SK Hynix’s Nasdaq listing raised US$26.5 billion last week, the largest US listing by a foreign company. Its shares have since risen more than 15.5% above the US$149 offering price. The proceeds will support the chipmaker’s growing capex, which is expected to reach up to US$50 billion annually over the next two years. However, most of this spending is expected to be funded through internal cash flow. In its latest quarter, SK Hynix reported revenue growth of 198%, reaching approximately US$35 billion. So why list in the US? The listing strengthens SK Hynix’s ability to fund future expansion and capex. This may become increasingly important as Samsung, SanDisk and Micron invest heavily in high-bandwidth memory chips and attempt to narrow SK Hynix’s lead. Can SK Hynix close the valuation gap with Micron? Despite its strong market position, SK Hynix continues to trade at a discount to Micron. That gap may begin to narrow as the listing and its profile as Nvidia’s largest memory partner increases.
S
by BlackBull Markets
BMNR - Finally buy the dipTime to buy the dip. Range breakout and Trade Rotation . Target1 : 23.00 Target2 : 27.46
NYSE:BMNRLong
by Catavolinos
11
Nvidia Still Bullish? The Charts Point to $300+Today's Chart of the Day is Nvidia... the technical picture still looks remarkably constructive. Let's start with the daily chart. Nvidia has staged a textbook rebound from its 200-day moving average, one of the most widely watched indicators of the long-term trend. As long as that level continues to hold, the primary bull trend remains intact. Now let's zoom out to the weekly chart. Here, the picture becomes even more compelling. The stock continues to find support from both the 55-week moving average, currently around 186.46, and the Ichimoku Cloud. Together, these provide a strong technical foundation for the longer-term uptrend. Finally, on the monthly chart, we still have an unfulfilled bull flag pattern. If that pattern continues to play out, it projects an upside target of above $300. So, while short-term volatility is always possible, the bigger picture remains positive. For now, the technical evidence suggests the long-term bull trend is still very much alive. What do you think? Can Nvidia reach $300? Let me know in the comments. Disclaimer: The information posted on Trading View is for informative purposes and is not intended to constitute advice in any form, including but not limited to investment, accounting, tax, legal or regulatory advice. The information therefore has no regard to the specific investment objectives, financial situation or particular needs of any specific recipient. Opinions expressed are our current opinions as of the date appearing on Trading View only. All illustrations, forecasts or hypothetical data are for illustrative purposes only. The Society of Technical Analysts Ltd does not make representation that the information provided is appropriate for use in all jurisdictions or by all Investors or other potential Investors. Parties are therefore responsible for compliance with applicable local laws and regulations. The Society of Technical Analysts will not be held liable for any loss or damage resulting directly or indirectly from the use of any information on this site.
NASDAQ:NVDALong
01:20
by The_STA
22
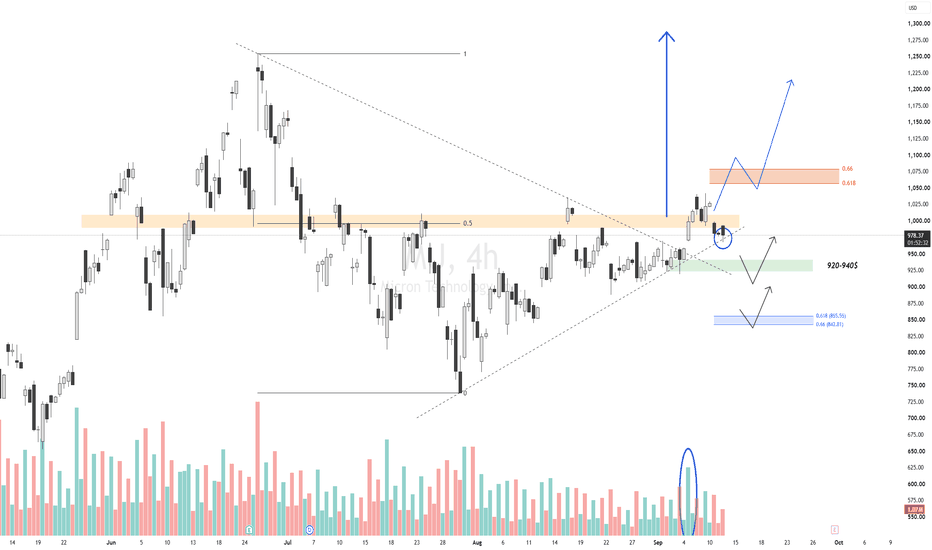
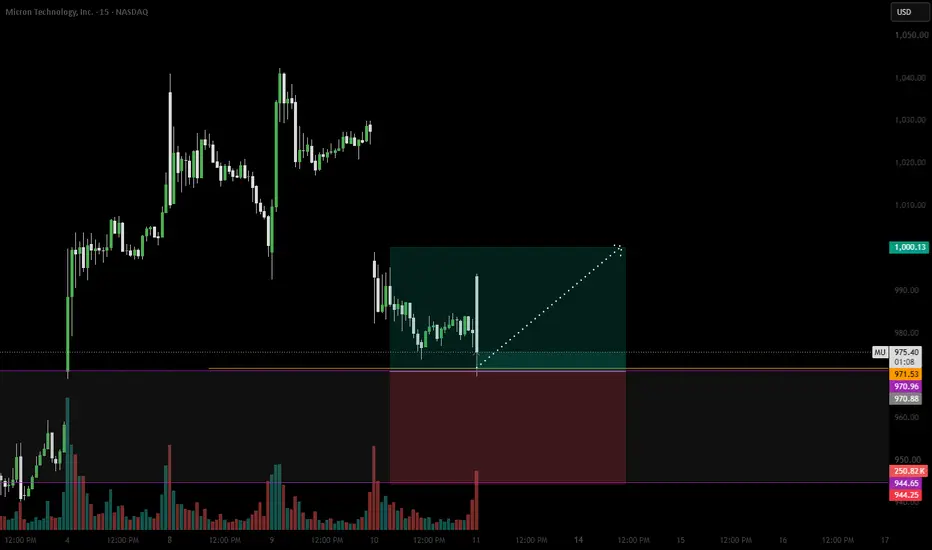
$MU: $1,500 Target — But Not YetThe bull market in the memory sector is far from over. Don't miss it again. SK Hynix CEO: "The memory shortage may persist past 2030. Next year is expected to be the worst year in the industry's history from a supply perspective." I'm still extremely bullish on the long-term outlook for the memory industry, but I don't think now is the right time to buy. From the 4H chart, Micron has already gone through roughly a 30% correction, which looks like a clear distribution phase . Although we've seen several rebounds, buying pressure has remained weak, and price is currently forming a potential Head & Shoulders pattern. My Trading Plan · Buy 20% of my intended position between $890–858 . · Watch price action closely around the $1,040–1,060 resistance zone before deciding whether to take profits or add to the position. · If MU fails to break above resistance and continues correcting, I'll wait for the $688–640 accumulation zone to add more. Long-term target: $1,500+ I'm betting on the future of Memory + AI. Are you? If you also want to plan your U.S. stock trades over the weekend—without constantly switching between apps for Gold, Crypto, and Stocks—you should check out rToken. Unlike synthetic assets that rely on oracles or on-chain liquidity pools, rToken routes orders through broker channels directly to the real NASDAQ and NYSE order books, allowing 24/7 trading while maintaining real U.S. equity liquidity with the efficiency of the crypto market. This is one of the most interesting bridges between traditional equities and crypto trading that I've seen recently.
NASDAQ:MULong
by GDJ_Jinn
Circle Internet Group📊 ****Circle Internet Group, Inc. (CRCL)**** ISIN: US1725731079 ****What the Company Does**** 🪙 Issues the USDC stablecoin and blockchain payment solutions 💳 Provides digital asset infrastructure for businesses ****Future Potential**** 📈 Growing adoption of stablecoins in global payments 🤖 Expansion of blockchain infrastructure and financial services ****Future Risks**** ⚔️ Competition from Tether, PayPal, and traditional payment networks 🌍 Regulatory uncertainty and crypto market volatility
NYSE:CRCLLong
by robo414
JPM — Earnings in 48 hours with CPI the same day. What the....JPM — Earnings in 48 hours with CPI the same day. What the levels say. **JPM — JPMorgan Chase — July 12, 2026** JPM reports Q2 results Tuesday morning before the open. The same day brings the June CPI print. This is the cleanest near-term catalyst in the market right now. Traders are watching whether the stock can hold recent levels into the print or if it needs to digest expectations first. **Technical Structure:** Price has been consolidating in a relatively tight range after the recent move higher. It is holding above the $330 area, which has acted as support on multiple tests in the past several weeks. Volume has been moderate — typical for a pre-earnings period. RSI is in neutral territory, neither overbought nor oversold on the daily timeframe. **Key Levels:** **Support:** $330 — Multiple tests this month; strong confluence with prior swing lows. **Resistance:** $345–348 — Recent highs and analyst target cluster. **Invalidation:** Below $325 on a closing basis would shift focus to deeper support near $310–315. **The Fundamental Context:** Consensus expects solid Q2 EPS growth driven by Markets and Investment Banking fees. Credit provisions have been well-controlled. The same-day CPI release means any surprise in inflation data will immediately affect rate expectations and therefore perceived pressure on net interest margins. **Catalyst to Watch:** July 14 — Q2 earnings + June CPI. Strong beat with stable credit commentary would be bullish. Hotter CPI or higher-than-expected provisions would likely pressure the stock. **The Risk:** Pre-earnings positioning is often crowded. Even a decent print can lead to “sell the news” if expectations are already high and valuation is not cheap. #JPM #Banking #Earnings #Macro #Value
NYSE:JPMLong
by DCAlpha
Reversing to the bottom of the range Two important lows, they define the bottom of the range. In a range the play is buy low, sell high.
NASDAQ:SMCILong
by Principlesofmathprob
Shell PLC📊 ****Shell plc (SHEL)**** ISIN: GB00BP6MXD84 ****What the Company Does**** 🛢️ Produces oil and natural gas worldwide ⚡ Invests in LNG, renewables, and energy solutions ****Future Potential**** 📈 Growing demand for LNG and energy infrastructure 🌱 Expansion in low-carbon and renewable energy ****Future Risks**** ⚔️ Volatile oil and gas prices 🌍 Climate regulations and energy transition pressures
NYSE:SHELLong
by robo414
Nebius Group📊 Nebius Group N.V. (NBIS) ISIN: NL0009805522 ****What the Company Does**** ☁️ Provides AI cloud infrastructure and computing services 🖥️ Develops GPU-powered platforms for AI workloads ****Future Potential**** 🤖 Growing demand for AI infrastructure and cloud services 📈 Expansion of GPU capacity and enterprise AI solutions ****Future Risks**** ⚔️ Competition from Amazon, Microsoft, and Google 🌍 High infrastructure costs and rapid technology changes
NASDAQ:NBISLong
by robo414
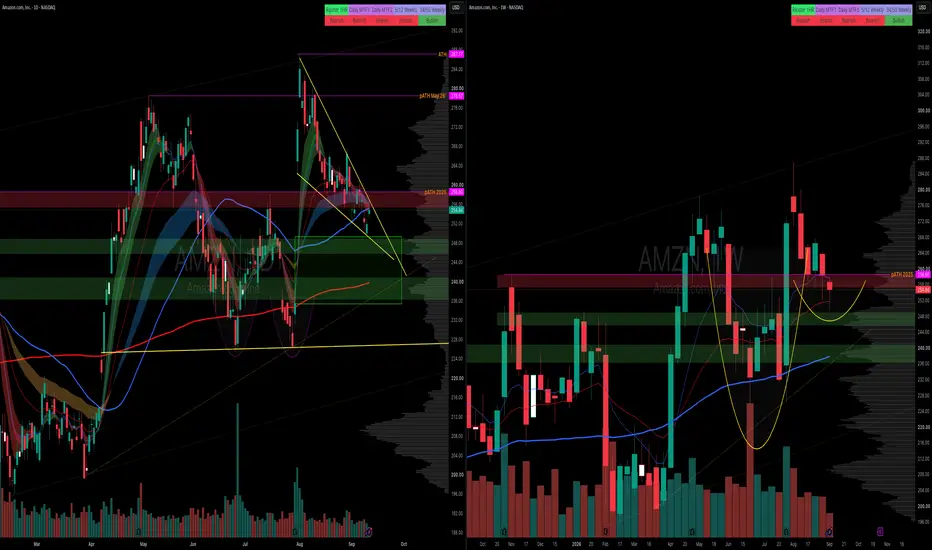
AMZN | Healthy Pullback Complete — Buyers Eye The $278 Liquidity By analyzing the #AMZN (Amazon) chart on the Daily timeframe, we can see that price remains firmly within a long-term uptrend, riding cleanly inside a rising price channel and printing higher structure along the way. Each leg up has confirmed the trend with a fresh bullish BOS — strong evidence that buyers remain in control of the bigger picture. 📊 Daily Timeframe On the Daily, the structure is textbook bullish — a series of BOS to the upside inside the ascending channel. In the most recent leg, price pulled back below the 0.5 equilibrium ( $238.82 ) — a healthy, well-earned correction rather than a sign of weakness — and reacted right from the daily Order Block ( $219.58 – $226.49 ), exactly where demand should step in. Price is now trading around $245.34 , pressing into a zone that also acts as a bearish Order Block, so I expect it to pause and consolidate here for a bit. The key trigger: a daily candle close above $249.75 would print an iCHoCH to the upside and confirm the continuation — opening a clear path toward the buy-side liquidity (BSL) resting overhead at $278.82 (the 1.0 extension). The whole bullish thesis stays valid above the Protected Low at $195.91 , with the deeper Breaker Block ( $188.71 – $198.99 ) beneath it as structural support. ⏱️ 1H Timeframe On the 1H, price had been printing bearish BOS after bearish BOS on the way down into the correction. That's the short-term picture that now needs to flip. The level to watch is the Protected High at $249.51 : if price can reclaim and break it, that's the lower-timeframe confirmation that buyers have wrestled back control — and it aligns perfectly with the daily $249.75 trigger, stacking both timeframes into one clean signal for the push toward the liquidity above. 🎯 The Bias My base case is bullish continuation. The daily uptrend is intact, the correction into discount is complete, and price has already reacted from the Order Block. What I want now is confirmation: a daily close above $249.75 (and the 1H reclaim of $249.51). On that trigger, I look for the move toward the BSL at $278.82. In my view, as long as AMZN holds above the Protected Low ($195.91), every dip remains a buying opportunity rather than a reversal — but I'll respect that the current bearish OB may cap price briefly before the breakout. 📰 Fundamental Backdrop The bullish structure lines up with a genuinely strong run of catalysts. Amazon just posted a record Prime Day, generating roughly $26.4 billion in US sales — a clear signal of robust consumer demand that should feed directly into Q2 numbers. On the AI front, the company launched a $25 billion bond sale to fund its aggressive data-center and cloud buildout (2026 capex tracking toward ~$200 billion), and just landed a high-profile deal with Warner Bros. to power agentic AI advertising technology on AWS. Analyst sentiment is warming ahead of earnings — Goldman Sachs raised its price target, and the Street consensus sits well above current price. The next major catalyst is Q2 earnings on July 30, with analysts modeling around $196 billion in revenue on the back of AWS growth (last quarter grew 28%) and a booming ad business. The one caution worth flagging: heavy AI capex has compressed free cash flow and made the recent bond sale less favorably received — so the earnings print, and management's commentary on spend, will be the real test. For now, price action and fundamentals point the same way: higher. This analysis will be updated as the market evolves. If this breakdown added value, drop a like 👍 and a comment 💬 to support the work — and share where you see Amazon heading next! Best Regards, BigBeluga 🐳
NASDAQ:AMZN
by BigBeluga
99
112233445566778899101011111212131314141515161617171818191920202121222223232424252526262727282829293030313132323333343435353636373738383939404041414242
…999999

Made by humans

Select market data provided by ICE Data Services. Select reference data provided by FactSet. Copyright © 2026 FactSet Research Systems Inc.Copyright © 2026, American Bankers Association. CUSIP Database provided by FactSet Research Systems Inc. All rights reserved. SEC filings and other documents provided by Quartr.© 2026 TradingView, Inc.

More than a product
  • Supercharts
Screeners
  • Stocks
  • ETFs
  • Bonds
  • Crypto coins
  • CEX pairs
  • DEX pairs
  • Pine
Heatmaps
  • Stocks
  • ETFs
  • Crypto coins
Calendars
  • Economic
  • Earnings
  • Dividends
  • IPOs
More products
  • News Flow
  • Portfolios
  • Fundamental Graphs
  • Yield Curves
  • Options
  • Macro Maps
  • Pine Script®
Apps
  • Mobile
  • Desktop
Community
  • Social network
  • Wall of Love
  • Refer a friend
  • House Rules
  • Moderators
Ideas
  • Trading
  • Education
  • Editors' picks
Pine Script
  • Indicators & strategies
  • Wizards
  • Freelancers
  • Paid Spaces
Tools & subscriptions
  • Features
  • Pricing
  • Market data
  • Gift plans
Trading
  • Overview
  • Brokers
  • Brokers comparison
  • The Leap
Special offers
  • CME Group futures
  • Eurex futures
  • US stocks bundle
About company
  • Who we are
  • Space mission
  • Blog
  • Help Center
  • Careers
  • Media kit
Merch
  • TradingView store
  • Tarot cards for traders
  • The C63 TradeTime
Policies & security
  • Terms of Use
  • Disclaimer
  • Privacy Policy
  • Cookies Policy
  • Accessibility Statement
  • Security tips
  • Bug Bounty program
  • Status page
Business solutions
  • Widgets
  • Charting libraries
  • Lightweight Charts™
  • Advanced Charts
  • Trading Platform
Growth opportunities
  • Advertising
  • Brokerage integration
  • Partner program
  • Education program
Community
  • Social network
  • Wall of Love
  • Refer a friend
  • House Rules
  • Moderators
Ideas
  • Trading
  • Education
  • Editors' picks
Pine Script
  • Indicators & strategies
  • Wizards
  • Freelancers
  • Paid Spaces
Business solutions
  • Widgets
  • Charting libraries
  • Lightweight Charts™
  • Advanced Charts
  • Trading Platform
Growth opportunities
  • Advertising
  • Brokerage integration
  • Partner program
  • Education program
Look FirstLook First