AAPL Testing Macro Wedge Resistance & Bearish RSI DivergenceApple is approaching the upper boundary of a long-term rising wedge while daily RSI is developing bearish divergence. Price is making a higher high, but RSI remains below its prior peak, suggesting momentum may be weakening as AAPL tests major resistance.
This is not an immediate short signal. I am watching for confirmation through rejection at the upper trendline, a bearish reversal candle, or a loss of nearby support.
Trade thesis
A confirmed rejection could open the door to a broader pullback toward the $265โ$280 confluence zone, where the lower wedge boundary and prior descending resistance may provide support.
If that zone fails, the next major structural support is near $245.56.
Key levels
Resistance and rejection area: approximately $330โ$335
Initial pullback support zone: approximately $265โ$280
Major structural support: approximately $245โ$246
Invalidation
A sustained breakout and close above the upper wedge boundary would weaken the bearish thesis and suggest continued upside.
The divergence is still forming, so confirmation matters more than anticipation. Earnings Call is approaching as well so a break above the wedge on earnings may still not negate the wedge as many symbols have pumped and dumped on earnings during this calendar year.
Educational analysis onlyโnot financial advice.
ARM Flat Finished ARM has hit the 61.8% retracement after a clean 5 waves down from what looks like a perfectly clean flat after an impulse up. Looking to go long here and ride this to potentially $300+. It is bouncing out of a bull gap that is still open, it may still close that tomorrow before really taking off.
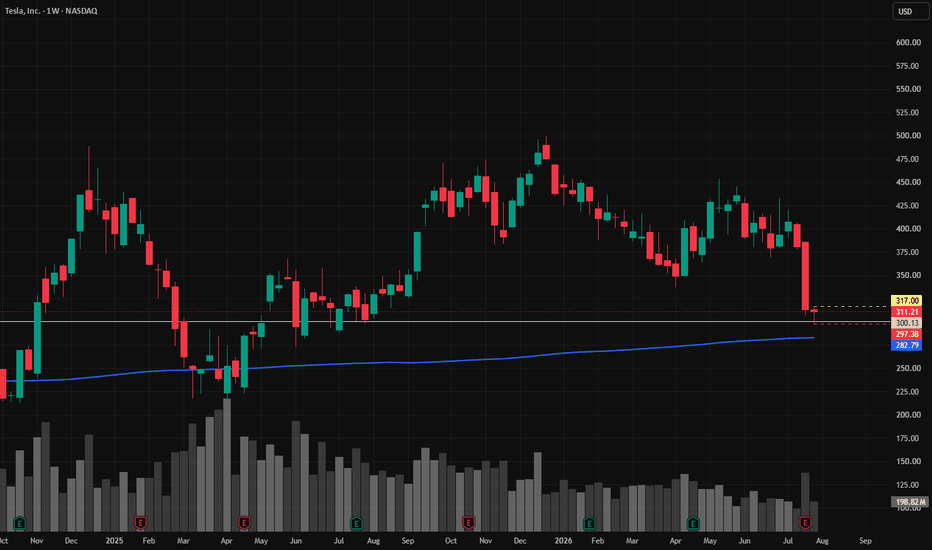
TESLA โ Will buyers take back control?
๐Tesla is testing a key support area while still trading below the descending dynamic resistance. The recent reaction shows buyers are trying to defend this level, but the overall structure remains bearish until resistance is reclaimed.
๐ Bullish scenario
If buyers manage to hold the current support and break above the dynamic resistance, momentum could begin shifting back in favor of the bulls. A confirmed breakout would be the first sign that the recent downtrend is losing strength.
๐ Bearish scenario
If the highlighted support fails to hold, sellers could quickly regain control and extend the decline toward the next demand zones. Losing this area would reinforce the current bearish market structure.
For now, Tesla is sitting at a critical decision point. Buyers have an opportunity to build a reversal, but they still need confirmation above resistance before a sustained recovery can be expected.
TSLA about to rip for W-3TSLA looks like it just finished a small wave 2 of a larger C. The close today bounced off the downtrend for the week so we could get a small pullback Monday or gap up and run. The volume on the daily with the hammer candle is very bullish for the continuation of the uptrend. I'm looking for this wave 3 to end around 470 but maybe 450 before finishing up around 510.
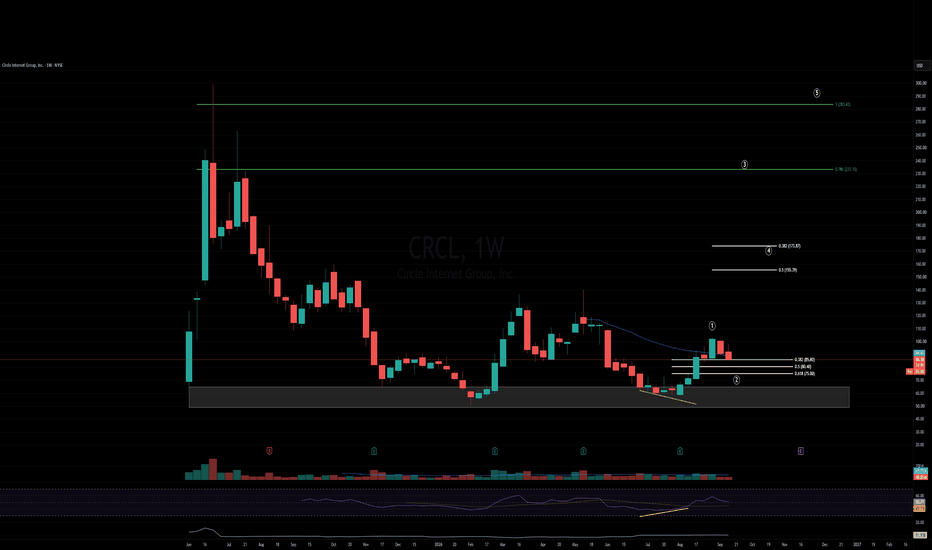
Is Circle Ready to Circle Back After Falling 55% Since May?Circle Internet Group NYSE:CRCL has been beaten up pretty well over the past two months after the stablecoin firm hit a $140 2026 high in mid-May. Shares have given back some 55% since then. Let's see what Circle's chart and fundamentals say about whether the stock came mount a comeback.
Circle's Fundamental Analysis
For those who wondered but were afraid to ask, Circle is a financial-technology company that builds infrastructure for digital currencies, stablecoins and blockchain-based applications.
Circle is primarily known for having issued two stablecoins -- the U.S. dollar-backed CRYPTOCAP:USDC USDC and the Euro-backed CRYPTOCAP:EURC . (CRCL also offers a tokenized money-market fund known as "USYC.")
The firm primarily operates a business-to-business enterprise, with no real contact with the consumer.
Wall Street expects Circle to release Q2 results on or about Aug. 10, with the Street looking for $0.17 of GAAP earnings per share on about $721 million of revenue.
Such a top-line result would only represent about 10% year-over-year growth, but that kind of bottom-line print would compare very well to the $4.48-per-share loss that Circle saw a year ago.
Still, a lot of analysts appear to be unsure of what to expect from the upcoming results.
Only one of the 15 sell-side analysts that I know to cover this stock has increased his earnings estimate for the period since it began, while six have cut their estimates. (Eight haven't adjusted anything in months.) All of that is a little odd.
Circle's Technical Analysis
Now let's check out Circle's year-to-date chart running through Wednesday afternoon (July 15):
Readers will see that from early March into early June, CRCL developed and completed a double-top pattern of bearish reversal, shaded in pink in the chart above.
This pattern worked to textbook-like perfection, with its $84 downside pivot (the stock's early April low) ultimately leading to Circle falling to a $59.29 2026 low on July 14.
In doing so, CRCL surrendered three key levels. The stock lost its 50-day Simple Moving Average (or "SMA," marked with a blue line), its 200-day SMA (the red line) and its 21-day Exponential Moving Average (or "EMA," denoted by a green line).
That might have turned both professional managers and swing traders against the stock. Then again, the 21-day line acted as resistance as recently as July 10, indicating that maybe the swing crowd isn't yet quite ready to change sides.
And while Circle's Relative Strength Index (the gray line marked "RSI" at the chart's top) has been weak, at least it's off of its lows.
The stock's daily Moving Average Convergence Divergence indicator (or "MACD," denoted by blue bars, a black line and gold line at the chart's bottom) is looking more bullish as well.
For instance, the histogram of the 9-day EMA (the blue bars) has gone positive. That's a short-term bullish signal.
Meanwhile, the 12-day EMA (the black line) has crossed above the 26-day EMA (the gold line). That's often one of the first signals of a changed environment, although both lines are still running in negative territory. That does mute this signal to some degree.
No promises, but these technicals say there's definitely a chance that CRCL has bottomed out -- or has at least begun the process of building a bottom.
(Moomoo Technologies Inc. Markets Commentator Stephen "Sarge" Guilfoyle had no position in CRCL at the time of writing this column.)
This article discusses technical analysis, other approaches, including fundamental analysis, may offer very different views. The examples provided are for illustrative purposes only and are not intended to be reflective of the results you can expect to achieve. Specific security charts used are for illustrative purposes only and are not a recommendation, offer to sell, or a solicitation of an offer to buy any security. Past investment performance does not indicate or guarantee future success. Returns will vary, and all investments carry risks, including loss of principal. This content is also not a research report and is not intended to serve as the basis for any investment decision. The information contained in this article does not purport to be a complete description of the securities, markets, or developments referred to in this material. Moomoo and its affiliates make no representation or warranty as to the article's adequacy, completeness, accuracy or timeliness for any particular purpose of the above content. Furthermore, there is no guarantee that any statements, estimates, price targets, opinions or forecasts provided herein will prove to be correct.
Moomoo is a financial information and trading app offered by Moomoo Technologies Inc. In the U.S., investment products and services on Moomoo are offered by Moomoo Financial Inc., Member FINRA/SIPC.
TradingView is an independent third party not affiliated with Moomoo Financial Inc., Moomoo Technologies Inc., or its affiliates. Moomoo Financial Inc. and its affiliates do not endorse, represent or warrant the completeness and accuracy of the data and information available on the TradingView platform and are not responsible for any services provided by the third-party platform.
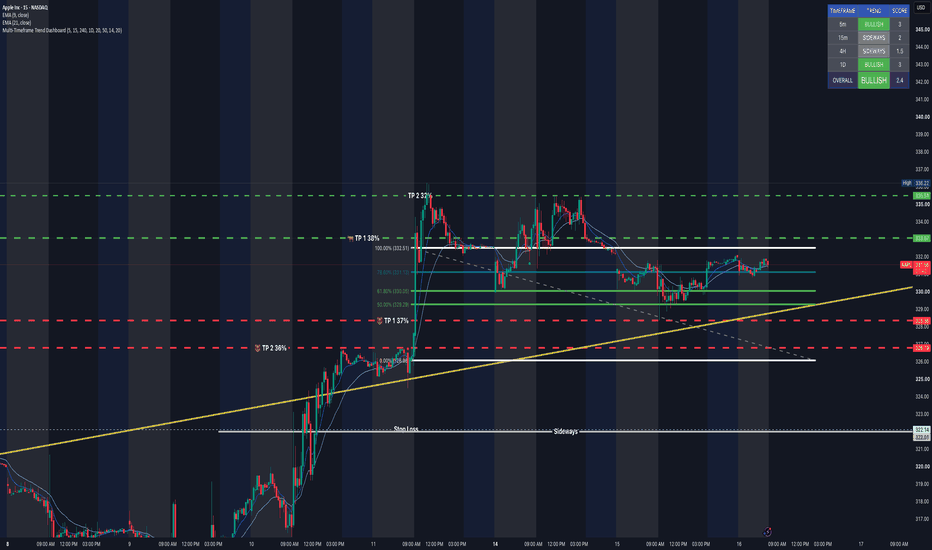
AAPL 15m โ Buying the Pullback Into 327 | Jul 17Apple's had a clean run off 318, building value the whole way up to 336. Price is now pulling back, and that's what I've been waiting for.
The level I care about is 327โ328. That's where the point of control sits โ the price where the bulk of this move's volume actually transacted โ and the anchored VWAP has risen right into the same area. When those two line up, you've got fair value and the average participant's cost basis in the same spot. That's the shelf.
Conditions support it. The higher timeframe trend is expanding, pointed up, and stable โ that's what gives this a green light rather than a guess. The short-term leg looks tired after seventeen bars of pushing, but that's not a bearish signal, that's just the pullback arriving. The trend behind it is intact.
The trade:
Long: A pullback into 327โ328 that actually holds. I want to see buyers defend it โ absorption, sellers failing to follow through, a reclaim rather than a slice straight through. Target is back to the 336 high and above. Stop below the shelf with room for the noise, not jammed underneath the entry.
I'm taking a partial position into the level and adding on the confirmation rather than dumping full size on a limit bid. The short-term move looks stretched, so there's a real chance price cuts through 327 instead of bouncing cleanly off it. Let the level earn the rest of the size.
Short: No interest. Fading a confirmed uptrend with both timeframes aligned is fighting the market for scraps.
Not buying 330. That's mid-air between the high and the shelf โ no structure, nothing to lean a stop against. The trade is at the level or it isn't a trade.
Wait for the pullback. Let it hold. Then get involved.
Not financial advice. Trade your own plan.
NFLX: Post-ER Washout, Chart Breakdown & Where I'm Stepping inYou don't have to be an expert to realize that the post-ER flush has materialized an incredibly ugly weekly chart. The gap down on high volume creates multiple bearish interpretations, most notably a confirmed multi-year Head and Shoulders pattern, with the Head peak at $134.12 and a slanted neckline break.
Crucially, the price has broken and confirmed a weekly close below that massive structural neckline. This is a very bearish technical breakdown, IMO. There's zero logical reason to rush into this position right now. A breakdown of this size often implies a protracted wash-out period to establish a stable base. At the current post-earnings price near $68, I don't want to touch this for at least another $15 of downside.
My precise target area of interest for a potential starter position is the $53.40 midline within the defined upper band ($58.72) and lower band ($48.08) range shown on the chart.
Why $53.40? I am picking this specific midline for clear structural reasons:
Arithmetic Precision: Obviously, it is the exact mid-point of the $58.72 to $48.08 "Buy Zone" range defined on the chart, which represents historical high-volume structural support.
Historical Confluence: This area aligns with significant historical support lows established during prior consolidation phases (such as the 2022-2023 period before the breakout), which may generate a significant base-building bounce.
Risk-Defined Tactical Entry: It provides a specific, risk-defined area to execute a two-pronged strategy.
The Execution Strategy: If NFLX washes down into that specific area (my $53.40 target):
- I will take a 1/3 - 1/2 common equity starter position.
- I will simultaneously write cash-secured puts to extract the elevated post-earnings implied Vol and establish a much lower net basis, should the position be assigned.
This strategy allows for slow accumulation and income generation while waiting for confirmation. For me, patience is the key on this one. If it flushes there, it does. If it doesn't, I am not chasing it. The focus is structural interest, not FOMO. Just sharing my thoughts. NFA.
Breakout soon potentiallyDPRO - On the inverted chart there's very clearly a repeated formation of bear flags that are eventually broken to the downside (Upside in normal perspective). In the normal perspective there's a very clear bullflag that it currently resides in and is now testing a strong level of support.
If drones have potentially bottomed here, looking at ONDS, then this repeated pattern may play out again? Though this time a bit different as it is clearly breaking a long term structure so in this case more bullish potentially. Thought it was worth sharing.
TSLA wave b Finished at a = c, looking for c of C next TSLA put in a very nice bearish triangle down to 377 at a = c which as been my target the last week. From here we should see 5 waves up for wave C. Mini a =c would be 443 target, but I'm mostly shooting for 495. Stop below the previous wave B low at 368 or if more conservative below 377.
The triangle formation only occurs before the last move of an Elliot Wave structure. The wave (B) is very telling here because of that. It is more than likely a wave (B) or a wave (4) - but a 4 does not fit the count.
IREN Limited: Recent Developments and 6-Month OutlookOver the past several months, IREN Ltd. has continued its strategic transformation from being primarily a Bitcoin mining company into a broader AI infrastructure and digital infrastructure provider. While Bitcoin mining remains a major contributor to revenue and cash generation, management has increasingly shifted capital allocation toward AI cloud services and hyperscale AI data centers.
A key milestone has been the completion of the company's 50 EH/s self-mining expansion, after which management announced that further mining expansion would be paused in favor of accelerating AI-related investments. This marks an important strategic pivot, reflecting management's view that AI infrastructure offers a significantly larger long-term addressable market than Bitcoin mining alone.
Operationally, IREN has maintained strong mining margins thanks to its low-cost renewable energy infrastructure, while simultaneously expanding its AI cloud business through additional NVIDIA Blackwell GPU deployments. The company has also continued advancing the Horizon 1 AI Data Center and the large-scale Sweetwater campus, both of which represent critical assets for future AI capacity.
Outlook for the Next Six Months
Looking ahead, the investment thesis is likely to revolve around several key factors:
Execution of the AI data center strategy and customer onboarding.
Progress in monetizing new AI cloud capacity.
Bitcoin price stability, which continues to influence near-term cash generation.
Financing execution and capital allocation as large infrastructure projects move forward.
Potential announcements regarding additional hyperscaler or enterprise AI customers.
If management continues executing successfully, investors may increasingly value IREN as an AI infrastructure company rather than solely as a Bitcoin miner. However, execution risk remains elevated given the capital-intensive nature of the expansion, and market sentiment is still highly sensitive to both cryptocurrency prices and broader AI infrastructure demand.
Technical Perspective
From a technical analysis standpoint, the current price structure appears consistent with the possible completion of a lower-degree Elliott Wave pattern. As always, Elliott Wave analysis should be applied with appropriate flexibility, particularly because the methodology was originally developed to analyze broad market indices rather than individual stocks, which are generally more susceptible to company-specific news and higher volatility. Therefore, this interpretation should be viewed as a probabilistic framework rather than a deterministic forecast.
This is not a financial advice.
TTD | June, 2026 | The time to go long has come- Timeframe: Weekly
- Trade type: Buy stop order
- Price: 20.59
- Take Profit: Open
- Stop Loss: 18.31 (-11.00 %)
Idea: Long on a breakout above last week's high โ bullish momentum continuation.
Entry: Buy stop above last weekโs high.
Stop-loss: Below the low of the same candle.
If the weekly candle closes below this level, the trade is invalidated.
Take Profit: Trailing stop following the lows of new weekly candles.
Feel free to like and share your thoughts in the comments! โค๏ธ
LOW 1 Month Chart Technical Analysis
Chart Patterns: Broke below the ascending staircase (green line) bearish.
Exponential Moving Average: EMA 9 (green line) is below EMA 21 (red line) bearish.
Bollinger Band (BB): LOW is in the lower band (green) it could be bullish, however, let's check the volume to make sure this isn't signifying a reversal upwards.
Moving Average Convergence Divergence: The MACD (green line) is below the signal (red line) bearish.
Volume: The volume for last month (Monday 1, Jun 2026) is higher than this month's volume (Wednesday 1, Jul 2026). This month's volume is seeing an increase in bearish volume.
Opinion: Bearish on the 1-month chart. Everything pertaining to the chart looks promising. LOW closed below my trendline (green line), I see it going to my next trendline $206.46, and potentially going to my next target $181.72.
Out of the money options (OTM): Puts.
LPTH โ Expanding into High-Growth Infrared and Defense OpticsLightPath Technologies, Inc. NASDAQ:LPTH develops precision optical components, infrared lenses, and advanced imaging systems serving the defense, aerospace, industrial, security, and sensing markets.
Key Catalysts:
Transformation into an integrated optics platform:
LightPath is evolving from a traditional optics manufacturer into a vertically integrated infrared imaging and optical solutions provider, expanding its presence in higher-value defense and industrial applications.
Strong financial momentum:
Fiscal Q3 2026 results demonstrated significant operational progress:
Revenue: Approximately $19.1 million, more than doubling year over year
Gross Margin: Improved to approximately 36%
Adjusted EBITDA: Turned positive at approximately $1.1 million, reflecting improving operating leverage.
Record backlog supports visibility:
A record backlog of approximately $110.6 million provides strong revenue visibility and supports continued growth across defense, aerospace, and industrial programs.
Strategic acquisitions:
The acquisitions of G5 Infrared and Amorphous Technologies expand LightPath's capabilities in infrared materials, thermal imaging, and advanced optical technologies, strengthening its competitive position.
Defense and sensing tailwinds:
Increasing investment in defense modernization, infrared sensing, thermal imaging, and advanced optical systems continues to create favorable long-term demand for the company's products.
Investment Outlook:
Bullish above: $9.50โ$10.00
Upside target: $24.00โ$25.00
Supported by accelerating revenue growth, improving profitability, strategic acquisitions, and rising defense demand, LightPath is well positioned to benefit from expanding opportunities in advanced imaging and infrared technologies.
๐ข LPTH โ Building the next generation of infrared imaging and precision optics for defense, aerospace, and industrial innovation.
Booked rNVDA at Target 1. The Trade Went Exactly as Planned.A few days ago, I shared my 4H Bull Flag analysis on rNVDA, highlighting that a breakout from the consolidation could push price toward higher resistance levels. The first target has now been reached, and I decided to lock in profits according to my plan. Consistency comes from following the strategy, not chasing every extension.
I traded this setup on Bitget using rNVDA, where orders during US market hours are routed through a licensed broker directly into the NASDAQ order book. Instead of relying on an oracle or synthetic price peg, execution reflects the actual US equity market, making it a compelling way to express a technical view on NVIDIA.
But the technical setup is only part of the story.
NVIDIA remains the backbone of the AI infrastructure cycle. Hyperscalers continue investing aggressively in AI data centers, and management has highlighted visibility into more than $1 trillion of AI infrastructure demand through 2027. At the same time, the rollout of the next-generation Rubin platform is expected to strengthen NVIDIA's position as AI workloads continue to expand beyond training into robotics, sovereign AI, and physical AI applications.
From a chart perspective, the structure remains constructive.
If buyers reclaim and hold above the $211 resistance, the next upside objective sits near $217, while a sustained breakout could extend toward the $236 measured move from the bull flag. A healthy retest of the breakout zone would also be normal before another continuation. However, if price loses the recent support area, the bullish structure weakens and patience becomes the better trade.
The first target has already been achieved, but with AI infrastructure spending still acting as a major long-term catalyst, NVIDIA remains one of the most important stocks on my watchlist. The next move will depend on whether buyers can turn this breakout into sustained momentum.
SPCX: Price Reaches the Balance Line After Breaking 157.50This update shows that SPCX has continued to move according to the numerical structure highlighted in the previous analysis. After breaking the main pivot at 157.50, the reading shifted directly toward the next balance line at 123.75, which has now been reached on the chart.
The key point here is that a main pivot is not treated as a random level. When price loses 157.50 and remains below it, the movement shifts toward the next level within the structure. In this case, the 123.75 balance line became the next station in the move.
Adding the midpoint at 140.63 helped track the quality of movement between 157.50 and 123.75. Breaking below that midpoint confirmed the continuation of downside pressure before price reached the main balance line at 123.75.
The reading now depends on how price reacts around 123.75. A positive reaction from this level may open the door for a rebound attempt, while a clear break below it would shift attention toward the lower main pivot at 90.00.
This is an updated analytical reading of SPCX price movement based on the numerical pivots and balance lines shown on the chart. It is not a buy or sell recommendation.
I thought this was Caramel? $CRMLThe Technical Nexus
Critical Metals Corp. NASDAQ:CRML has completed a massive structural unwind from its previous high beta expansions and is currently sitting directly on its most critical horizontal support level. This is not just a random intraday level; this is the definitive resistance turned-support base that defined the mid 2025 accumulation phase prior to the massive breakout.
Concurrently, the daily Relative Strength Index has collapsed into deeply oversold territory, marking its lowest reading since the late 2024 capitulation base. When a stock undergoes an extreme momentum washout precisely as it tags a multi year horizontal floor, it creates a pristine structural inflection zone where risk and reward are clearly defined.
The Bull Case (If Support Holds)
Mean Reversion Snap: The combination of an extreme oversold RSI and a major historical support level structurally favors a sharp, explosive relief rally as selling pressure reaches exhaustion.
Low Float Volatility: Because of the company's tight tradable float, any sudden return of buying volume can cause an exaggerated upside response.
The Upper Gaps: The $9 and $11 may act as natural magnets for a dead cat bounce or structural trend reversal. If buyers successfully defend that and form a base, the daily chart features clean liquidity gaps above.
The Bear Case (If Support Fails)
Structural Floor Collapse: A clean, closing breakdown below this multi year base completely voids the accumulation thesis and inflicts severe technical damage.
Liquidity Vacuum: Because the stock violently gapped through the lower single digits during its late 2025 expansion, there is very little historical volume profile to act as a cushion beneath this shelf.
The Downside Target: If $6.40 breaks on heavy, decisive volume, CRML enters free-fall territory with the next major volume-validated support sitting much lower at $4.70.
Tactical Execution Plan
This is the ultimate line in the sand for the asset. Managing risk here is mathematically straightforward: the $6.50 zone must be defended by institutional buyers. If the floor holds, the upside leverage is substantial; if it fails on volume, capital preservation dictates stepping aside as the trapdoor opens.
LONG AYI - Bounce at Weekly Fibonacci 0.618 + 200MA Confluence๐ ENTRY: $338.60
๐ **STOP LOSS:** $315.00 (Risk: $23.60)
๐ฏ **TAKE PROFIT:** $395.00 (Reward: $56.40)
๐ R:R RATIO: ~1:2.39
๐ TECHNICAL ANALYSIS (The Signal):
Key Confluence Zone: The price is currently bouncing from a critical support area. We are seeing a bullish RSI(2) reversal signal on the weekly chart, aligning perfectly with the weekly Fibonacci 0.618 retracement level, which coincides with the 200-period moving average. This triple confluence makes this a high-probability bounce zone.
Momentum Confirmation: After today's session (July 17, 2026), AYI is up +1.71%, showing buyers stepping in right at this precise demand zone.
52-week range: The stock is trading at ~$340, well within its **$257.04 โ $380.17** yearly range, with plenty of room to run toward the highs.
Moving Averages: The 20-day MA sits at ~$325.33** and the **50-day MA at ~$302.50. My stop loss at $315.00 is placed safely below the 20-day MA but above the 50-day MA, giving the trade room to breathe while protecting against a breakdown.
Key Resistance: The $380.17 52-week high is the primary hurdle. A breakout above this level would open the door to new all-time highs.
Target at $395.00**: This sits just above the **average analyst price target of $397.17 and approaches the Oppenheimer target of $465.
๐ FUNDAMENTAL ANALYSIS (The Catalyst):
Acuity Brands reported Q3 FY2026 earnings on June 25, 2026, and the results were strong:
โ
**Adjusted EPS of $5.31** beat the $5.16 consensus estimate by +2.9%.
โ
Revenue of $1.2B** beat the $1.18B estimate, marking +1.6% YoY growth.
โ
Operating profit surged +38.3% to $193.3M.
โ
**Diluted EPS (GAAP) of $4.56, up +46.2% YoY.
โ
Operating cash flow of $520.2M** and **free cash flow of $461.7M in the first nine months of fiscal 2026.
The Growth Driver โ Acuity Intelligent Spaces (AIS):
The AIS segment delivered a 15% surge in revenue, driving the company's overall growth.
This offset a 2% decline in the legacy lighting business.
Capital Returns & Balance Sheet Strength:
โ
Repaid $200M of term debt** year-to-date.
โ
Repurchased **~766,000 shares for $230M.
โ
Refinanced revolver with a new five-year $800M unsecured facility**.
โ
**FY2026 guidance**: Net sales of **$4.7Bโ$4.9B** and adjusted EPS of **$19.00โ$20.50.
Analyst Sentiment (Bullish):
Firm Rating Price Target
Morgan Stanley Buy **$410** (raised from $400)
Oppenheimer Buy $465
Goldman Sachs Hold **$358** (raised from $295)
Consensus (8-9 analysts) Buy ~$397
The average price target of ~$397 implies an ~17% upside from current levels.
๐ฏ TRADE STRATEGY:
Entry at $338.60: Entering at the bounce off the weekly Fibonacci 0.618 level coinciding with the 200MA, confirmed by the RSI(2) reversal signal.
**SL at $315.00:** Placed safely below the 20-day MA (~$325) and above the 50-day MA (~$302), protecting against a breakdown while allowing for normal pullback volatility.
**TP at $395.00:** Approaching the average analyst price target and just below the Oppenheimer target of $465, capturing the full upside of the fundamental setup.
โ ๏ธ RISK MANAGEMENT:
Index rebalancing risk: AYI was recently dropped from the Russell 1000 Dynamic Index, triggering forced selling by institutional investors who track that benchmark.
Technical stretch: While we are bouncing, the stock has had a strong run; ensure proper position sizing.
Lighting business headwinds: The legacy lighting segment declined 2% YoY, partially offset by AIS growth.
Minimal dividend yield: At ~0.26% yield, this is not a dividend play.
๐ฌ What are your thoughts? Is anyone else watching this Fibonacci/200MA confluence zone for the bounce?
โ ๏ธ DISCLAIMER:
This is NOT financial or investment advice. This post reflects my personal opinion and analysis based on publicly available information. Trading and investing involve substantial risk, including the potential loss of your entire capital. Past performance does not guarantee future results. Always do your own research (DYOR) and consult with a licensed financial advisor before making any trading decisions. I am not responsible for any losses incurred.
#AYI #AcuityBrands #Earnings #AIS #TradingSetup #TechnicalAnalysis #Stocks #Fibonacci #RSI
ORACLE'S $638 BILLION QUESTION: WHEN DOES BACKLOG BECOME CASH?Applying the complete operating-metric-to-present-value framework to Oracle's AI-cloud buildout
Oracle may be one of the most interesting valuation tests in the US market today.
At the end of fiscal 2026, the company reported $638 billion of remaining performance obligations, or RPO. Revenue reached $67.4 billion, cloud revenue grew 39%, and Oracle Cloud Infrastructure revenue grew 77%. At the same time, Oracle spent $55.7 billion on capital expenditure, generated roughly $32.0 billion of operating cash flow, and reported negative free cash flow of about $23.7 billion.
That combination creates a perfect battlefield for two opposing stories.
The optimistic story says Oracle has secured years of AI demand and is building the capacity needed to serve it. The pessimistic story says the company is borrowing heavily to build expensive infrastructure while the economic return remains uncertain.
Both stories contain some truth. Neither is a valuation.
A contract is not revenue. Revenue is not operating profit. Operating profit is not cash flow. And future cash flow is not worth its undiscounted face value.
The only useful way to analyse Oracle is to follow the complete chain:
Operating metric โ Revenue โ Operating profit โ Taxes โ Reinvestment โ Free cash flow โ Risk and probability โ Present value
This article applies that framework fully. It does not produce a buy or sell call, and it does not treat framework suitability as investment quality. It turns the Oracle thesis into a set of claims that can be measured quarter by quarter.
1. WHY ORACLE FITS THIS FRAMEWORK SO WELL
In a broader screen of 60 US stocks, Oracle received the highest framework-suitability score. That did not mean it was the cheapest or best stock. It meant every stage of the valuation chain mattered unusually strongly.
There is a large disclosed operating metric: $638 billion of RPO.
The metric has an unusually long recognition schedule.
Cloud revenue is already growing rapidly.
Infrastructure costs are changing the margin mix.
Capital expenditure is larger than operating cash flow.
Customer funding, debt and equity financing materially affect the cash bridge.
The final result depends heavily on execution timing and present value.
This makes Oracle a useful case study because lazy valuation shortcuts fail very quickly here.
2. OPERATING METRIC: WHAT DOES $638 BILLION OF RPO ACTUALLY MEAN?
RPO represents contracted revenue that Oracle expects to recognise in the future from obligations that have not yet been fully satisfied. It is evidence of committed demand, but it is not a bank balance and it is not the same thing as immediately collectible cash.
Oracle disclosed the following expected recognition schedule at May 31, 2026:
Next 12 months: 12% โ approximately $76.6 billion
Months 13โ36: 34% โ approximately $216.9 billion
Months 37โ60: 34% โ approximately $216.9 billion
After 60 months: 20% โ approximately $127.6 billion
Here is the important human comment: the headline is $638 billion, but only 12% is expected to be recognised within the next year. In other words, 88% sits beyond the first 12 months, and 54% sits beyond the first three years.
That does not make the backlog weak. It makes timing central to the valuation.
RPO rose from $138 billion a year earlier to $638 billion, an increase of 363%. Oracle also added $85 billion sequentially during the fourth quarter. Those are extraordinary figures. Yet the quality of RPO cannot be judged from its size alone. Investors also need to ask:
How quickly does contracted capacity become available?
How much revenue is recognised from each new data-centre cohort?
What operating margin does that revenue earn?
How much additional capital is required before Oracle can deliver it?
How much of the obligation is prepaid or supported by customer-supplied equipment?
What happens if deployment dates move or customer needs change?
Oracle's RPO-to-revenue ratio is approximately 9.5 times, calculated as $638 billion divided by FY2026 revenue of $67.4 billion. That ratio signals exceptional future coverage. It does not say that nine and a half years of current profit are already secured.
Framework conclusion at this stage: RPO is a strong demand indicator, but its valuation relevance depends on conversion speed, unit economics and required reinvestment.
3. REVENUE: IS THE OPERATING METRIC ALREADY CONVERTING?
There is real conversion underway.
FY2026 total revenue rose 17% to $67.4 billion. Cloud revenue increased 39% to $34.0 billion, representing slightly more than half of company revenue. Within cloud, infrastructure revenue reached $18.1 billion and grew 77%. Fourth-quarter OCI growth accelerated to 93%.
The rest of the company provides useful context:
Software revenue: $24.5 billion, down 1%
Services revenue: $5.7 billion, up 10%
Hardware revenue: $3.1 billion, up 5%
Oracle is therefore not a clean, single-product AI company. It is a mature enterprise-software business being reshaped by a fast-growing, capital-intensive infrastructure operation. The legacy businesses can supply revenue, customer relationships and cash, while OCI becomes a larger part of the total mix.
For FY2027, management guided to approximately $90 billion of total revenue. Achieving that figure would mean growth of about 33.5% from FY2026. Oracle also guided first-quarter FY2027 revenue growth of 27% to 29%, with cloud revenue growth of 58% to 64% in US-dollar terms.
This gives the market something better than a vague AI promise: a near-term conversion test.
The relevant question is not whether Oracle can sign large contracts. It is whether completed capacity can turn those contracts into recognised, profitable revenue at the guided pace.
The revenue stage is currently passing the framework. OCI growth is visible and accelerating. The harder stages begin after revenue.
4. OPERATING PROFIT: RAPID GROWTH DOES NOT GUARANTEE LEGACY MARGINS
Oracle generated $20.6 billion of GAAP operating income in FY2026, up 17%. On $67.4 billion of revenue, that implies a GAAP operating margin of approximately 30.6%. Non-GAAP operating income was $28.9 billion.
Those figures show a highly profitable company at the consolidated level. But applying the current company-wide margin directly to the entire RPO would be a serious modelling error.
Why? Because the revenue mix is changing.
Oracle disclosed that cloud and software expenses increased by $5.8 billion, including a $5.7 billion increase in infrastructure expenses. It also said margins as a percentage of revenue declined because of higher infrastructure expenses. AI infrastructure requires servers, networking, energy, buildings, depreciation, operations and financing. The economics are different from selling another licence or renewing high-margin support.
A proper model should separate at least three economic buckets:
Mature software and support: slower growth, high recurring margins and lower incremental capital intensity.
Cloud applications: recurring revenue with meaningful infrastructure needs but software-like customer economics.
OCI and AI capacity: very high growth, much heavier capital requirements and margins that depend on utilisation, contract pricing and depreciation.
There is also a timing issue. A new data centre may generate large costs before it reaches efficient utilisation. Early reported margins can therefore understate mature economics. But the reverse shortcut is equally dangerous: assuming every new facility will automatically achieve attractive utilisation and margins.
The practical question is whether incremental cloud operating profit grows faster than the depreciation, infrastructure expense and financing cost attached to the new capacity.
What would strengthen the thesis? OCI revenue remaining strong while consolidated or cloud-related margins stabilise and eventually expand.
What would weaken it? Revenue meeting guidance while infrastructure expense keeps absorbing an increasing share of the revenue.
5. TAXES: THE BRIDGE MUST USE AFTER-TAX OPERATING ECONOMICS
Oracle reported $17.0 billion of GAAP net income available to common shareholders in FY2026, up 36%, and GAAP diluted EPS of $5.83.
Net income is useful, but it is not the cleanest starting point for valuing the operating assets. It already includes interest, tax effects and other items associated with the capital structure. For a full enterprise DCF, the cleaner route is:
Revenue ร normalised operating margin = operating profit
Operating profit ร (1 โ normalised cash tax rate) = after-tax operating profit
The word normalised matters. A modeller should not assume one reported tax line will remain constant throughout a multi-year AI buildout. Geographic profit mix, tax incentives, timing differences, stock compensation and the financing structure can move the reported rate.
The conservative method is to scenario-test a sustainable cash tax rate and keep it separate from interest expense. This prevents the model from accidentally treating tax timing benefits as permanent operating value.
6. REINVESTMENT: THE NUMBER THE HEADLINE STORY CANNOT IGNORE
Oracle's FY2026 cash-flow bridge was dramatic:
Operating cash flow: approximately $32.0 billion
Capital expenditure: approximately $55.7 billion
Free cash flow: approximately negative $23.7 billion
The arithmetic is straightforward:
$32.0B operating cash flow โ $55.7B capital expenditure = โ$23.7B free cash flow
Capital expenditure was approximately 82.6% of revenue and 174.1% of operating cash flow. It rose 162% from $21.2 billion in FY2025. Oracle also expects the upward capital-expenditure trend to continue in FY2027 and subsequent years.
Calling all of this spending โbadโ would be simplistic. Growth capex can create enormous value when it is tied to contracted demand and earns an attractive return. Calling it irrelevant because it supports growth would be just as simplistic. The cash has left the business either way.
The real analytical task is to separate:
Maintenance capex: spending required to sustain existing capacity and service quality.
Committed growth capex: spending needed to deliver already contracted RPO.
Speculative growth capex: capacity built in anticipation of future demand not yet economically secured.
Oracle does not provide a neat public split for these categories. That means investors should track data-centre cohorts: capital deployed, timing to activation, revenue ramp, utilisation and eventual cash return.
Negative free cash flow during a major buildout is not automatically value destruction. It becomes value destruction if the future after-tax cash generated by the assets fails to compensate for the capital and risk taken today.
7. CUSTOMER FUNDING, DEBT AND DILUTION: WHO PAYS BEFORE THE CASH ARRIVES?
Oracle's disclosures contain a meaningful positive offset. The company said approximately $75 billion of hardware associated with large AI contracts is either prepaid by customers or supplied by them.
This is valuable because it can reduce Oracle's funding burden. But the wording must be handled carefully. It does not mean Oracle received $75 billion in cash.
The actual disclosed customer prepayments received in FY2026 that contained a significant financing component were approximately $4.6 billion. Those prepayments helped working capital and operating cash flow. The distinction is essential:
$75 billion: hardware portions expected to be prepaid or customer-supplied.
$4.6 billion: qualifying customer prepayments actually received during FY2026.
Customer funding lowers risk only to the extent that it is collected, contractually durable and matched to the required deployment. It should be tracked as a separate thesis variable, not used as a substitute for future free cash flow.
The remaining funding need is large. Oracle reported $129.5 billion of outstanding indebtedness at May 31, 2026. During FY2026 it raised roughly $43 billion of debt and $5 billion through mandatory convertible preferred stock. It also used short-term capex financing and continued scheduled debt repayments.
For FY2027, Oracle expects to raise approximately $40 billion through a combination of debt and equity, including a previously announced $20 billion at-the-market equity programme. The company also said it did not expect additional debt issuance during calendar 2026 after its financing actions.
This creates two costs that operating-revenue headlines do not capture:
Interest and refinancing risk: more debt creates fixed claims on future cash.
Dilution risk: equity and convertible securities spread future value across more common-share equivalents.
Oracle reported that potential dilution from stock awards granted since June 1, 2023 was approximately 1.0% on an annualised basis. Planned equity and convertible financing add another reason to track the fully diluted share count, not only EPS growth.
Framework conclusion at this stage: customer-supported hardware improves the funding picture, but debt, interest and dilution must be charged against the value created by the cloud buildout.
8. FREE CASH FLOW: WHAT THE CURRENT DEFICIT DOES AND DOES NOT TELL US
FY2026 free cash flow was approximately negative $23.7 billion. That is a real economic fact, but it is not a complete verdict.
During the build phase, current free cash flow is deliberately depressed by assets that may support revenue for years. At the same time, FY2026 operating cash flow benefited from the $4.6 billion of customer prepayments described above. A model should therefore avoid assuming either the current capex intensity or the working-capital benefit continues forever.
The cash thesis requires an eventual transition:
Stage 1: Contracting โ RPO grows.
Stage 2: Construction โ capex and financing rise before revenue.
Stage 3: Activation โ capacity comes online and RPO converts to revenue.
Stage 4: Utilisation โ revenue grows faster than incremental operating cost.
Stage 5: Harvest โ operating cash flow exceeds maintenance and necessary growth capex, allowing free cash flow to turn sustainably positive.
Oracle has clearly passed Stage 1 and is deep in Stages 2 and 3. Parts of the business may already be entering Stage 4. The market's central disagreement is about the timing and magnitude of Stage 5.
9. RISK AND PROBABILITY: THREE POSSIBLE ORACLE PATHS
Instead of pretending there is one certain forecast, the framework should use scenarios.
Scenario A โ Efficient conversion
FY2027 revenue lands near the $90 billion guide.
OCI growth remains strong as new capacity becomes available.
RPO converts broadly on the disclosed schedule.
Customer-prepaid or customer-supplied hardware reduces Oracle's cash burden.
Utilisation rises and infrastructure margins improve.
Capex growth eventually slows relative to operating cash flow.
Free cash flow inflects upward before financing costs overwhelm the benefit.
In this outcome, current negative free cash flow represents a front-loaded investment in contracted demand.
Scenario B โ Delayed conversion
Demand remains real, but site completion, power availability or hardware deployment slows recognition.
Revenue is pushed further into the future.
Capex, depreciation and interest arrive before the associated cash flow.
Oracle raises additional capital or carries negative free cash flow longer than expected.
The contracts may still be honoured, but present value falls because cash arrives later and financing costs accumulate.
Scenario C โ Weak economics or impairment
Some customers reduce, renegotiate or delay their usage.
Pricing or utilisation is weaker than expected.
Infrastructure margins remain structurally below the level implied by the valuation.
Technology changes shorten useful asset lives or force additional spending.
The company absorbs debt, dilution or asset impairments without receiving sufficient cash return.
In this outcome, impressive RPO and revenue growth fail to translate into attractive shareholder cash flow.
Probability is not a decorative percentage added at the end. It should be linked to observable evidence: recognition rates, utilisation, margin progression, actual customer funding, construction timing and financing needs.
10. PRESENT VALUE: WHY $638 BILLION CANNOT BE ADDED TO EQUITY VALUE
Even if every dollar of RPO converts to revenue, those dollars arrive over several years. Future money must be discounted.
Consider a simple timing illustration using Oracle's recognition buckets. Assume the revenue arrives, on average, at 0.5 years, 2 years, 4 years and 6 years for the four disclosed buckets.
At an 8% discount rate, the approximate present value of the gross RPO revenue is:
$638B ร 78.3% โ $499.5B
At a 10% discount rate, it is approximately:
$638B ร 74.1% โ $472.4B
These figures are deliberately not fair values. They are not estimates of Oracle's enterprise value or equity value. They simply demonstrate the effect of timing on the revenue headline.
From that discounted gross revenue, a real valuation would still need to deduct or account for:
Operating expenses required to provide the service
Cash taxes
Maintenance and growth capital expenditure
Working-capital requirements
Interest and other financing costs where appropriate
Net debt and senior claims when moving from enterprise value to equity value
Dilution from stock compensation, preferred conversion and equity issuance
Execution risk and the probability of each scenario
The value or burden of assets after the contracted period
The correct DCF engine is therefore:
After-tax operating profit
+ non-cash charges
โ capital expenditure
โ change in working capital
= unlevered free cash flow
Then discount those annual cash flows at a rate reflecting business risk, add the present value of a conservatively estimated terminal cash flow, and reconcile debt and dilution to reach common-equity value.
Without reliable assumptions for OCI mature margins, maintenance capex, RPO conversion, customer funding and terminal reinvestment, a precise price target would create false confidence. The framework is more useful when it shows which missing variables control the outcome.
11. THE PRACTICAL ORACLE DASHBOARD: WHAT TO CHECK EACH QUARTER
An Oracle investor does not need to react to every headline. These eight measurements cover most of the thesis:
RPO and its near-term recognition percentage: Is the backlog growing, and is more of it moving closer to revenue?
OCI revenue growth: Is installed capacity converting into recognised demand?
FY2027 revenue-guide progress: Is Oracle tracking toward approximately $90 billion?
Operating margin and infrastructure expense: Is incremental cloud revenue becoming more efficient?
Operating cash flow versus capex: Is the funding gap narrowing or widening?
Actual customer prepayments and customer-supplied equipment: How much construction burden is genuinely transferred?
Debt, interest cost and refinancing: How much future cash is already claimed by lenders?
Fully diluted shares: Is business value growing faster than each shareholder's ownership is being diluted?
One additional metric would be extremely valuable if Oracle expands its disclosure: revenue and cash return by data-centre cohort. That would allow the market to compare construction cost, activation date, utilisation and mature economics directly.
12. THE FALSIFIABLE ORACLE THESIS
Here is the full thesis in one sentence:
Oracle's $638 billion RPO creates shareholder value only if recognised AI-cloud revenue and after-tax operating cash eventually grow faster than capital expenditure, interest obligations and the diluted share count.
That statement can be tested.
The thesis strengthens if RPO converts on schedule, OCI revenue meets guidance, margins improve with utilisation, customer funding materialises, and operating cash flow begins to catch capex.
The thesis weakens if the recognition schedule moves outward, infrastructure costs prevent margin improvement, capex stays structurally above operating cash flow, or financing and dilution grow faster than the cash-generation capacity.
FINAL VIEW: COUNT THE CASH, NOT ONLY THE CONTRACTS
Oracle's situation is neither a simple bubble story nor a simple backlog story.
The bullish shortcut is to treat $638 billion of RPO as if it were already high-margin cash. The bearish shortcut is to treat every dollar of current capex as waste before the assets have had time to earn revenue. A serious analysis must live between those extremes.
Oracle has demonstrated extraordinary contracted demand and very strong OCI revenue growth. It also faces extraordinary reinvestment, substantial debt, planned equity financing and a long-dated conversion schedule. The final shareholder result will be determined not by the biggest number in the press release, but by the sequence underneath it.
Operating metric โ Revenue โ Operating profit โ Taxes โ Reinvestment โ Free cash flow โ Risk and probability โ Present value
That is the whole framework. For Oracle, every arrow matters.
SOURCE OF FRAMEWORK: