Long
Long
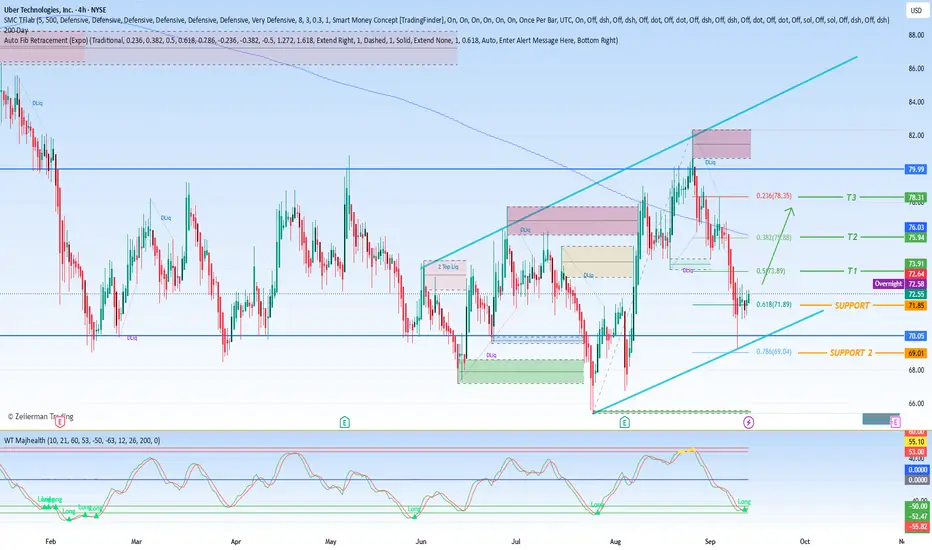
Is Uber Stock Cheap, or Is the Cash Already Spent?Uber Technologies (UBER) generates free cash flow equal to roughly 6.8% of its market value every year. For the median S&P 500 company, that figure sits at about 4.5%. A gap that wide normally tells you something important: the market may be pricing Uber as though its business is expected to shrink, or at least as though its cash generation is not expected to remain this strong. But Uber is not shrinking. Its revenue grew 16.7% over the trailing twelve months. That creates a puzzle. If the cash is real and the business is still growing, why does the market appear to value that cash so cautiously? The answer may come down to a different question: not whether Uber produces cash, but who ultimately gets it.
Where Does Uber’s Cash Actually Come From?
It does not come from unusually fat margins. Uber is fundamentally a marketplace business. It takes a cut of the activity that moves across its platform, whether that activity involves rides, delivery, or other services. Its economics depend on volume, take rates, frequency, and the ability to keep both sides of the marketplace engaged. Uber does not need to own the cars or employ every driver to generate revenue, but it does need to keep transactions flowing and defend its position against competitors.
One example of how Uber tries to widen its appeal is Wait & Save, its lower-cost product in the United States. Wait & Save lets riders trade time against price: if they are willing to wait a little longer, they can pay less. That can make Uber more accessible to price-sensitive customers, encourage more trips, and improve utilization across the network. It can also pressure revenue per trip, which means the strategy only works if the extra volume and efficiency more than offset the lower price.
The Scale Numbers Are Doing the Heavy Lifting
The latest results suggest that Uber’s volume growth is translating into real financial leverage. Gross bookings grew 22% year over year to more than $58 billion in the June 2026 quarter. Management says that growth fed through into operating leverage: non-GAAP earnings per share rose 35%, and trailing twelve-month free cash flow surpassed $10 billion for the first time. That combination matters. It suggests Uber is not simply buying growth with unsustainable discounts. Instead, it is expanding the top line while also converting more of that revenue into cash.
Operating leverage is the key idea here. When a marketplace grows, many costs do not rise at the same pace as revenue. Technology, platform development, and corporate overhead can be spread across a larger base of transactions. If Uber can keep adding gross bookings without letting costs scale just as quickly, more of each additional dollar can fall to the bottom line. That is what management appears to be emphasizing: growth is not coming at the expense of profitability.
So Why the Wide Free Cash Flow Yield?
A high free cash flow yield can mean several things. It can signal that a stock is cheap. It can also signal that investors doubt the durability of those cash flows. In Uber’s case, the market may be asking whether today’s cash generation can survive competition, regulatory pressure, labor disputes, insurance costs, or heavy reinvestment in new areas such as autonomous vehicles and expansion into additional markets.
There is also the question of capital allocation. Free cash flow belongs to the business, but shareholders only benefit directly if that cash is returned through buybacks or dividends, used to pay down obligations, or reinvested at attractive returns. If Uber instead spends the cash defending its marketplace, subsidizing riders, offering incentives to drivers, or funding expensive new initiatives, then the cash may never show up in shareholders’ pockets in a meaningful way. In that case, the stock could look cheap on a cash flow basis while still failing to deliver the returns that the yield seems to promise.
The Real Question Is Not Growth Alone
Uber’s cash generation is real, and it is growing. The company is not shrinking, and its revenue and bookings trends point to a business with momentum. But the market’s relatively low valuation against free cash flow suggests that investors want proof on two fronts: that the cash flow is durable, and that it will eventually accrue to shareholders rather than being consumed by competition, regulation, or reinvestment.
So the question is not simply whether Uber stock is cheap. The deeper question is who gets the cash. If management can sustain growth, preserve operating leverage, and return excess cash to shareholders, the current free cash flow yield may look like a genuine bargain. If the cash is continually spent to defend and expand the business, then the discount may be less of an opportunity and more of a warning.
 Long
Long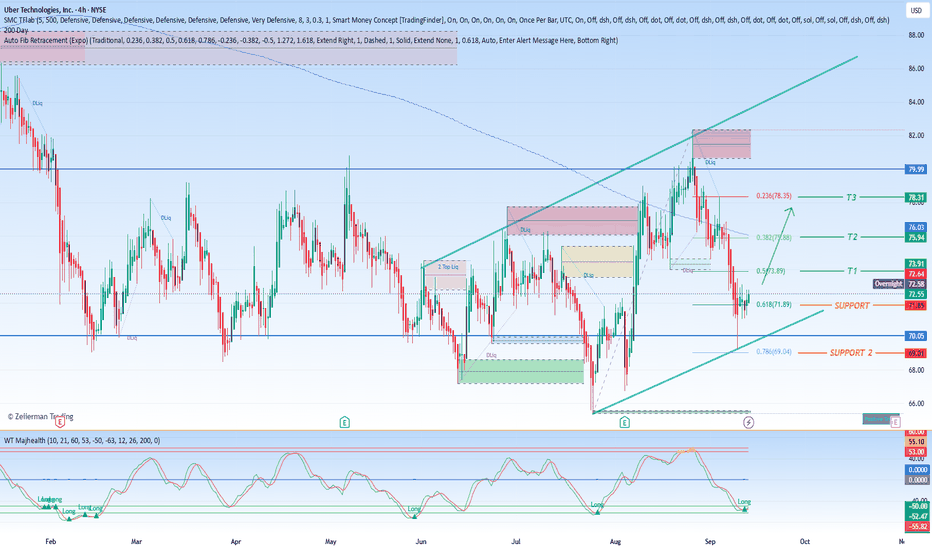
JPMorgan Revises #HIMS Outlook as Regulatory and Execution RisksJPMorgan has taken a fresh look at Hims & Hers Health (NYSE: HIMS), resuming coverage of the stock with a Neutral rating and a $32 price target. The decision reflects a more complicated growth path for the direct-to-consumer telehealth company, especially as regulatory pressure continues to reshape its weight-loss business. The $32 target implies roughly 17% upside from the Sept. 10 close. However, JPMorgan is not yet ready to adopt a more bullish stance. The bank wants clearer evidence that Hims & Hers can successfully transition away from compounded GLP-1 drugs and toward branded treatments without sacrificing margins along the way.
Hims & Hers operates a direct-to-consumer telehealth platform that offers treatments across a wide range of categories, including weight loss, sexual health, dermatology, mental health, and other areas. The company generates revenue primarily through subscriptions and prescription medications delivered through its digital platform. That model has helped Hims & Hers build a broad consumer-facing healthcare brand, but it also leaves the company exposed to regulatory changes and competitive pressures, particularly in the high-profile weight-loss segment.
JPMorgan analyst Brian Smilek had previously rated the shares Overweight before coverage was suspended in June. While he remains constructive on Hims & Hers’ vertical integration and its expansion into new specialties and international markets, he is now taking a more measured view. Smilek said the firm is looking for execution across several key areas: the strategic transition toward branded GLP-1s, durability of growth across newer specialties, deeper international penetration, and durable margin expansion.
JPMorgan also sees peptides as another potential growth opportunity for Hims & Hers. That could provide an additional avenue for expansion if the company can capitalize on it. But until Hims & Hers proves that its transition can support both revenue growth and durable margin expansion, the $32 price target suggests that upside may remain constrained by execution risk.
The Neutral rating captures this balanced view: JPMorgan is not issuing a negative call, but it is also not signaling strong conviction. The firm appears to see the risk/reward as roughly balanced at current levels. The key risk is that regulatory pressure could make the weight-loss business harder to navigate, while the key opportunity is that a successful shift toward branded GLP-1s, combined with expansion into new specialties and international markets, could unlock further growth. Until then, the stock may be judged more by execution milestones than by broad enthusiasm.  Long
Long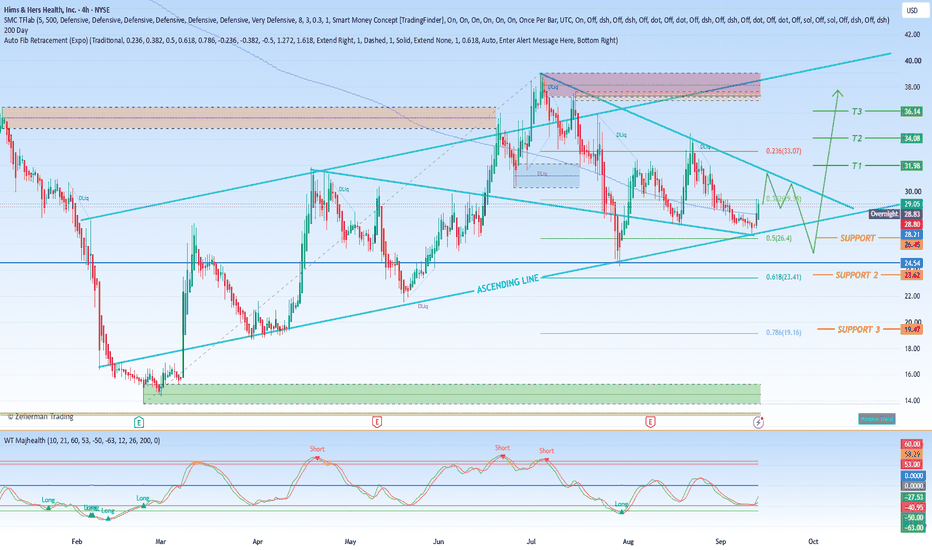
 Short
Short
SoFi Technologies Partners With Payward! SoFi Technologies Inc. (SOFI) announced on Thursday that it will enter into a partnership with Payward, a unified financial infrastructure platform, in a move aimed at strengthening SoFi’s banking, payments, liquidity, and digital asset operations. The collaboration is designed to connect SoFi’s growing digital asset infrastructure with Payward’s broader trading and settlement ecosystem, while also expanding the reach of SoFi’s stablecoin, SoFiUSD.
Under the terms of the partnership, Payward will leverage SoFi’s Big Business Banking capabilities, join the SoFi Exchange Network (SEN), and list SoFiUSD on its multi-asset trading platform. At the same time, SoFi will use Kraken Prime, Payward’s full-service prime brokerage solution, as an additional source of digital asset liquidity. The arrangement is therefore a two-way relationship: Payward gains access to SoFi’s banking and settlement infrastructure, while SoFi gains access to Kraken Prime’s liquidity and Kraken’s broader trading platform.
A key element of the deal is Payward’s access to SEN, SoFi’s real-time settlement network. This gives institutional clients a path to clear and settle U.S. dollar transactions 24 hours a day, seven days a week. Kraken institutional clients will be able to use SEN’s real-time settlement rails to move USD and manage liquidity across both networks at any hour. That kind of around-the-clock settlement capability is especially valuable for institutional crypto participants, who often need to move funds and manage positions outside traditional banking hours.
For SoFi, the partnership offers several potential benefits. Kraken’s decision to list SoFiUSD expands the stablecoin’s reach to millions of users on its multi-asset trading platform. Meanwhile, SoFi’s access to Kraken Prime’s liquidity could potentially improve crypto-trading prices for SoFi members. Because orders placed in the SoFi app will now route through Kraken Prime, customers may enjoy better pricing on crypto transactions. The deal also strengthens SoFi’s Big Business Banking offering, which was launched in April, and could pave the way for deeper collaboration between the two companies in areas such as payments, treasury, lending, and digital assets.
Keefe Bruyette offered its assessment of the announcement, calling it “another positive development” for SoFi. The firm said SoFi stands to benefit from Payward’s operations and its connection to Kraken’s platform. However, Keefe maintained an “Underperform” rating on SoFi Technologies with a $16 price target. That target implies roughly 13% downside from the stock’s last close, indicating that while the analyst views the Kraken partnership as a constructive step, it is not enough to shift a more cautious overall stance on the stock.
In summary, the SoFi-Payward partnership expands SoFiUSD’s distribution, gives Kraken and its institutional clients round-the-clock USD settlement through SEN, and adds Kraken Prime as a new liquidity source for SoFi. It also reinforces SoFi’s business banking push and opens the door to possible deeper collaboration across payments, treasury, lending, and digital assets. The analyst reaction captures the mixed picture: a positive strategic development for SoFi’s digital asset ambitions, but one that still leaves valuation concerns in place.
 Long
Long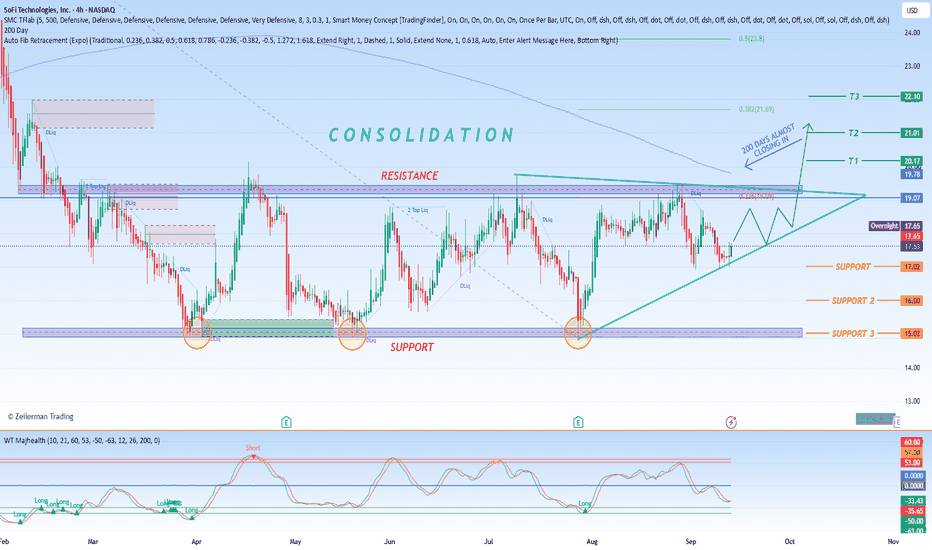
 Long
Long
 Long
Long
 Short
Short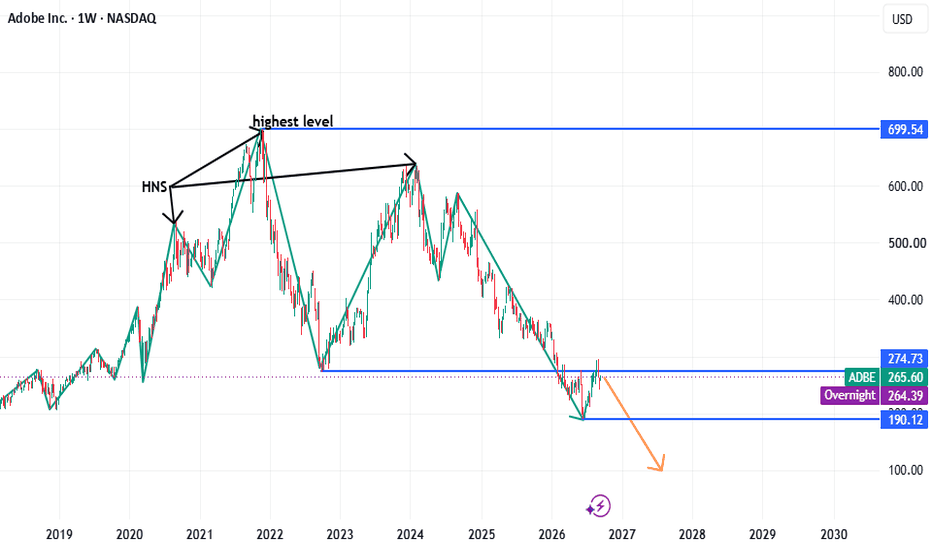
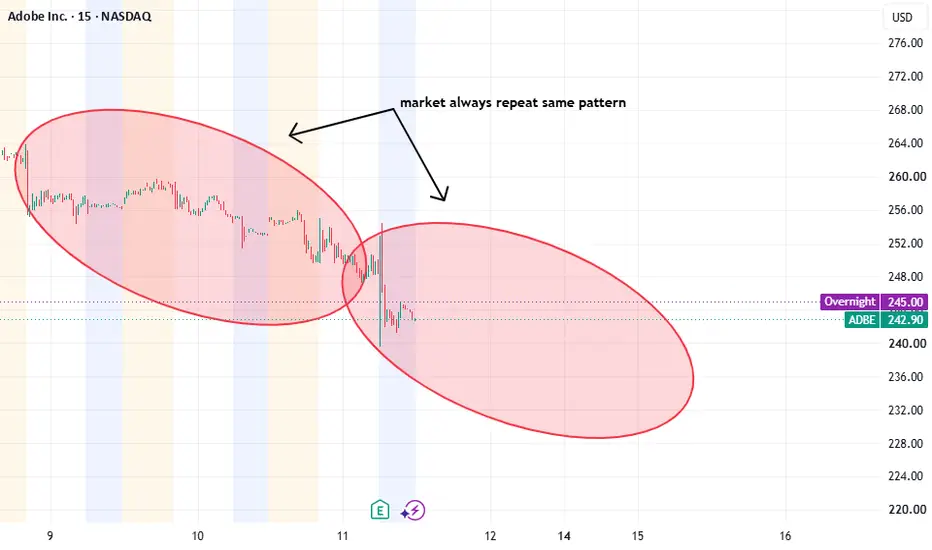
Market Repeat Pattern Market Repeat Pattern
The Market Often Rhymes With History...
The market does not necessarily repeat the exact same price movement, but it frequently repeats the same behavioral patterns. This happens because markets are driven by human psychology, liquidity, fear, greed, positioning, and the continuous battle between buyers and sellers.
When similar conditions appear, traders often react in similar ways. A price may rally into resistance, attract late buyers, create liquidity above previous highs, then reverse sharply. Likewise, after a strong sell-off, price may consolidate, sweep liquidity below previous lows, and recover as selling pressure becomes exhausted.
The important point is that the pattern is not guaranteed to repeat — the underlying market behavior is what tends to repeat.
Historical price action can therefore provide a framework for anticipating potential future scenarios. If the current structure closely resembles a previous market structure, traders can study how price behaved after similar conditions occurred before.
However, a repeated pattern is a probability, not a certainty. Market conditions, news, liquidity, institutional positioning, and overall sentiment can change the outcome. Therefore, the purpose of recognizing recurring patterns is not to predict the future with certainty, but to identify where the market may be more likely to react.
Markets move because people react. And human psychology tends to repeat. That is why price action can sometimes resemble what happened before.
“History may not repeat itself exactly, but market psychology often rhymes.”
The market may change its appearance, but human psychology remains remarkably consistent. When liquidity, sentiment, and price structure align in a similar way, similar market reactions can occur again. Recognize the pattern — but always respect that probability is not certainty.
Short 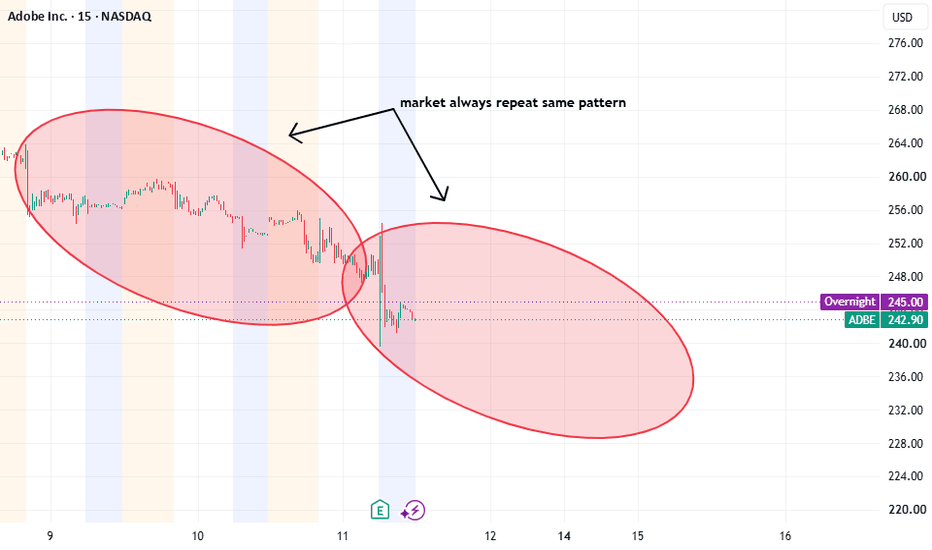
A Downtrend Does Not Always Fall Straight DownA strong downtrend rarely moves in a straight line. Before another major leg lower, price often needs to retracement upward to rebalance the market, attract buyers, mitigate previous selling pressure, and retest an important resistance or supply zone.
This upward movement should not automatically be interpreted as a trend reversal.
In a bearish market structure, the ideal sequence is:
Lower High → Sell-off → Retracement → Lower High → Continuation Lower
The retracement can serve several purposes. It may allow previously trapped buyers to exit, give short sellers a better entry, fill inefficient price areas, or test a broken support level from below. Once the retracement fails to break the previous significant swing high, the bearish structure remains intact.
For ADBE, the area around 259–261 is particularly important on this setup. If price retraces into this zone but fails to reclaim it convincingly, that could create another Lower High (LH) and increase the probability of a continuation toward the downside targets.
The key principle is:
A temporary move upward does not invalidate a downtrend. Sometimes the market needs to move higher first before it can move significantly lower.
Therefore, rather than chasing the initial sell-off, I prefer to watch for a bearish retracement and rejection. The confirmation comes from price action and market structure—not simply from the fact that the company has good fundamentals.
My bias remains bearish as long as the major resistance/swing-high structure remains intact. A decisive break and reclaim above the bearish invalidation level would weaken or invalidate this thesis.
This is my personal technical analysis and opinion, not financial advice. Short 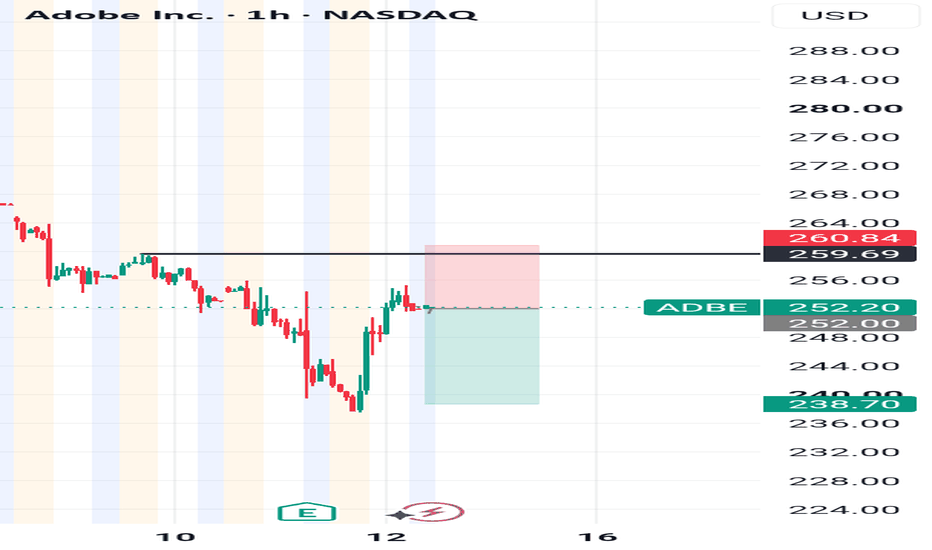
I stand with bearish market for ADOBE📉 ADBE Bearish Structure — Deep Explanation
The major structure remains bearish:
ADBE first experienced a strong decline from the $350+ area toward ~$195, creating a clear impulsive bearish leg. After reaching the ~$195 region, price bounced strongly toward the $285–290 area.
However, this upward movement has not yet proven that the larger bearish trend has reversed.
Instead, it can be viewed as a retracement / corrective rally following the initial selloff.
The important observation is the reaction around $285–290.
Price rallied aggressively, but then encountered selling pressure and failed to establish a sustained breakout above the previous major resistance area. This creates the possibility that the rally was forming a lower high within the broader bearish structure.
🔻 Why the bearish scenario remains valid
A downtrend does not necessarily move straight down.
A typical bearish market structure can look like:
Lower High → Lower Low → Retracement → Lower High → Lower Low
Therefore, the recent upward movement should not automatically be interpreted as a trend reversal.
The move from approximately $195 → $290 may simply represent a retracement designed to:
recover part of the previous decline,
test resistance,
attract buyers,
create liquidity above short-term highs,
and potentially provide the next area for sellers to enter.
If price continues to reject the $285–306 resistance zone, the bearish thesis remains intact.
🎯 Your marked setup
Your chart is essentially expressing this scenario:
Previous decline:
$350+ → ~$195
Retracement:
~$195 → ~$290
Potential rejection:
~$290 → current ~$252
Bearish continuation:
$252 → $220 → $200 → potentially ~$184
The $306.30 level you've marked is particularly important because a strong move above that region would significantly weaken the idea that ~$290 was a lower high.
Your projected $183.87 target is therefore not saying price must reach $184. It represents the next major bearish objective if the market confirms continuation and breaks the lower support zones.
🔥 The important distinction
Bullish movement ≠ bullish trend reversal.
A market can rise substantially while still remaining bearish on the higher timeframe.
For ADBE, the question is not:
"Did price go up?"
It clearly did.
The more important question is:
"Did price break the bearish structure and establish a new higher high?"
Until that happens, the recovery can reasonably be classified as a retracement within the larger bearish structure.
Confirmation to watch
For the bearish scenario to strengthen:
1. Rejection around $285–306
↓
2. Failure to reclaim the previous high
↓
3. Price breaks below ~$240–230
↓
4. Break below ~$200 / previous swing low
↓
5. Potential continuation toward ~$184
If price instead breaks and holds above ~$306, the bearish thesis becomes considerably weaker and the idea of the ~$290 lower high would need to be reassessed.
The recent upward movement from ~$195 toward ~$290 should not automatically be interpreted as a bullish trend reversal. On the higher timeframe, it can be viewed as a retracement following the previous major bearish impulse from the ~$350+ region.
Price rallied into the ~$285–290 resistance area but failed to establish a sustained breakout and subsequently rejected lower. This creates the possibility that the rally was a corrective retracement forming a lower high within the broader bearish structure.
A bearish trend does not need to move straight down. The market can retrace upward before continuing lower. Therefore, the current recovery may simply be a retracement/liquidity-building phase before another bearish leg.
Bearish thesis remains valid while price fails to reclaim the ~$306 resistance/invalidation area.
If sellers regain control and price breaks the lower support zones, the market could continue toward previous lows and potentially the ~$184 area.
Key idea: Retracement ≠ reversal. A sustained break above ~$306 would weaken this bearish thesis; rejection and continuation lower would strengthen it.
Personal technical view only — not financial advice. Short 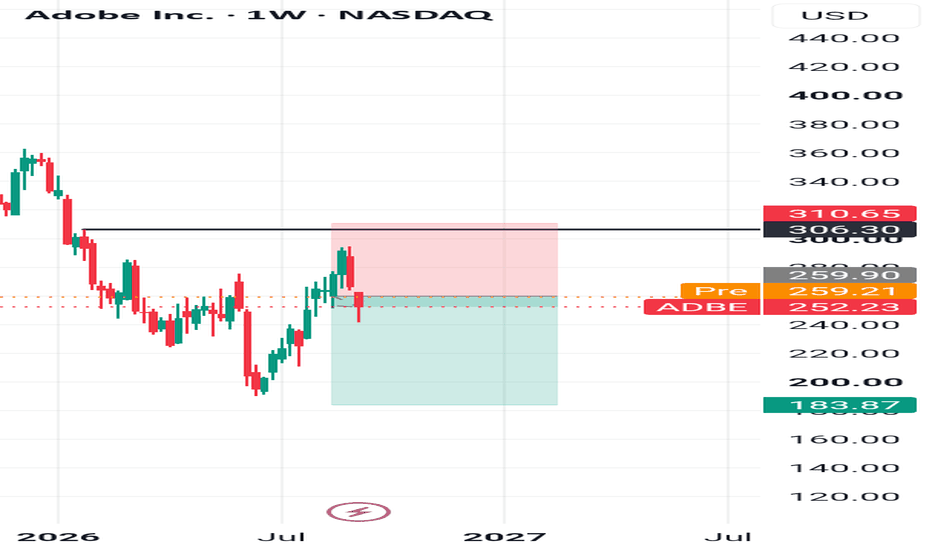
Short 
 Long
Long
 Short
Short

VELO | Flip Zone Holds, Two Pools AboveBy analyzing the #VELO (Velo3D, Inc.) chart on the 2H timeframe, we can see a market that spent June and July grinding lower inside a clean descending channel, broke out of it, and is now pressing back into the first area that decides whether the breakout was real.
2H Timeframe
The June to late July leg was one-directional: four consecutive BOS lower, every swing low taken out, price contained inside the descending channel the entire way down. The turn came in late July with a CHoCH at $10.49 — the first upside break of structure in the whole move — followed by a BOS at $15.00 that confirmed it and carried price to $17.62 .
What followed was the correction, not a new downtrend. From $17.62 price has drifted lower under a descending trendline since mid-August, printing lower highs into the same zone it originally broke out of. That zone is the Flip Zone at $9.65 – $10.49 — old resistance, now the first demand being retested. Price sits at $9.99 , inside it.
Above, the liquidity is stacked: the MSS level at $12.21 sits directly beneath the descending trendline, and the resting liquidity at $17.62 is the origin high that has never been revisited.
The Bias
Bullish while the Flip Zone holds, neutral the moment it does not.
Scenario A — the base case.
Price reacts out of the Flip Zone ($9.65 – $10.49) , reclaims the descending trendline , and the confirmation is a 2H close above $12.21 . That close breaks the MSS level and the trendline in the same move, which is the structural green light. Target is the resting liquidity at $17.62 .
Scenario B — the deeper sweep.
Price wicks beneath the Flip Zone to take the liquidity under $9.65 , then closes back inside. Same destination, better entry — but it still requires the $12.21 close to confirm. Nothing changes about the objective, only the price at which the position gets built.
Invalidation. A 2H close below $9.65 with no reclaim. At that point the Flip Zone has failed as demand and the entire breakout structure from late July is back in question.
And the rule that governs all of it: a break is a candle close, not a wick. The $12.21 level is exactly where a wick through the trendline will look like a breakout and close back beneath it — the MSS level and the descending trendline intersecting in the same area is where stops cluster, and clustered stops are what wicks are built from.
Fundamental Backdrop
The operating numbers have turned. Q2 2026 revenue came in at $20.7M, up 52.3% year over year , with gross margin at 21.5% — up from 7.5% in Q1 2025 . Management raised full-year guidance to $65M – $75M and is guiding gross margin above 30% in H2 2026 alongside positive EBITDA. Debt was cut roughly 70% to about $9M after a $15M debt-to-equity conversion, and the new 289,000 sq ft Livermore Production Campus is built to triple capacity. Inclusion in the Russell 3000 in June added a passive bid.
The other side is real. The company is still unprofitable — net loss of $51.59M on trailing revenue of $57.56M — and cash fell to $16.6M as of March 31, 2026 from $39.0M at year-end, against planned capex of $40M – $50M . That is a funding gap that likely gets closed with dilution, and the stock is up over 400% on market cap, meaning a great deal of the turnaround is already priced.
Which is why the structure matters more than the story here. The fundamentals justify why buyers defend the Flip Zone. They do not justify buying before $12.21 closes.
This analysis will be updated as the market evolves.
Best Regards, BigBeluga 🐳 NVDA Has Printed Its Third Double TopNVDA Has Printed Its Third Double Top
NVDA has made three double tops (yellow) in three years. The first two ended the same way. Price lost the blue activation line, and a drop followed.
Now we have the third one. And this is BIGGER.
A double top is simple. Buyers push price up to a level, they fail, they rest, and they try again at the same level. They fail again. Two attempts, same wall.
That tells you the buyers are getting tired.
One pattern on one stock does not make a market top. Agreed. On its own, this chart means little. So let me show you more.
The divergence
In my last ideas I showed the divergence in the SPCFD:SPX and in Emerging Markets. Price made new highs, but the internals did not follow. Fewer stocks are carrying the index. That is the same tiredness, seen from above.
Where the money goes
When risk gets tired, money does not disappear. It moves.
Today bonds pay a real return, something we had forgotten for years. A calm 4% or 5% looks very good next to a stock that just failed twice at the same price. And bonds have a second gift. If a crisis comes and central banks cut rates, bond prices go up. Money leaves risk and goes to quality.
That is the normal cycle, and it can last a long time.
For a long time, we all forgot about bonds and fixed income, but at zero rates it was useless. Now, with real rates positive and the markets overheated, bonds are becoming the place to be for the smart guys.
The chart
The blue line is the low between the two tops. It is not a target. It is the level where the pattern becomes real. Above it, this is just two failed attempts. Below it, the last two times, the drop was hard. Below that, the dotted line near $155 is the first zone with real volume and the previous tops.
And you?
Serious correction, or just one more pause before the rally continues?
 Short
Short
Tesla May Face ResistanceTesla bounced in August, but some traders may think the EV giant faces resistance.
The first pattern on today’s chart is the weekly low of $368.60 on June 26. TSLA held that level before its July 22 earnings report, but fell through it after the numbers hit. The stock has returned to stall at the same price zone, which could mean that old support is becoming new resistance.
Second, the 50-day simple moving average (SMA) is below the 200-day SMA. That may suggest a longer-term downtrend has begun.
Third, the falling 50-day SMA may be consistent with intermediate-term weakness.
Fourth, stochastics are dipping from an overbought condition.
Next, traders may eye the price zone between TSLA’s 52-week low of $297.38 and its 2025 low of $214.25 for potential probing.
Finally, TSLA is a highly active underlier in the options market. (Its average daily volume of 2.7 million contracts ranks second in the S&P 500 behind Nvidia, according to TradeStation data.) That could help traders take positions with calls and puts.
TradeStation has, for decades, advanced the trading industry, providing access to stocks, options and futures. If you're born to trade, we could be for you. Learn more here about TradingView’s Broker of the Year!
Past performance, whether actual or indicated by historical tests of strategies, is no guarantee of future performance or success. There is a possibility that you may sustain a loss equal to or greater than your entire investment regardless of which asset class you trade (equities, options or futures); therefore, you should not invest or risk money that you cannot afford to lose. Online trading is not suitable for all investors. View the document titled Characteristics and Risks of Standardized Options at www.TradeStation.com . Before trading any asset class, customers must read the relevant risk disclosure statements on www.TradeStation.com . System access and trade placement and execution may be delayed or fail due to market volatility and volume, quote delays, system and software errors, Internet traffic, outages and other factors.
Securities and futures trading is offered to self-directed customers by TradeStation Securities, Inc., a broker-dealer registered with the Securities and Exchange Commission and a futures commission merchant licensed with the Commodity Futures Trading Commission). TradeStation Securities is a member of the Financial Industry Regulatory Authority, the National Futures Association, and a number of exchanges.
Options trading is not suitable for all investors. Your TradeStation Securities’ account application to trade options will be considered and approved or disapproved based on all relevant factors, including your trading experience. See www.TradeStation.com . Visit www.TradeStation.com for full details on the costs and fees associated with options.
Margin trading involves risks, and it is important that you fully understand those risks before trading on margin. The Margin Disclosure Statement outlines many of those risks, including that you can lose more funds than you deposit in your margin account; your brokerage firm can force the sale of securities in your account; your brokerage firm can sell your securities without contacting you; and you are not entitled to an extension of time on a margin call. Review the Margin Disclosure Statement at www.TradeStation.com .
TradeStation Securities, Inc. and TradeStation Technologies, Inc. are each wholly owned subsidiaries of TradeStation Group, Inc., both operating, and providing products and services, under the TradeStation brand and trademark. When applying for, or purchasing, accounts, subscriptions, products and services, it is important that you know which company you will be dealing with. Visit www.TradeStation.com for further important information explaining what this means. Three-Wave Decline Into Accumulation — Major Bottom Developing?Good Afternoon,
Hope all is well. Here is my TA on RPD!
What I’m Seeing
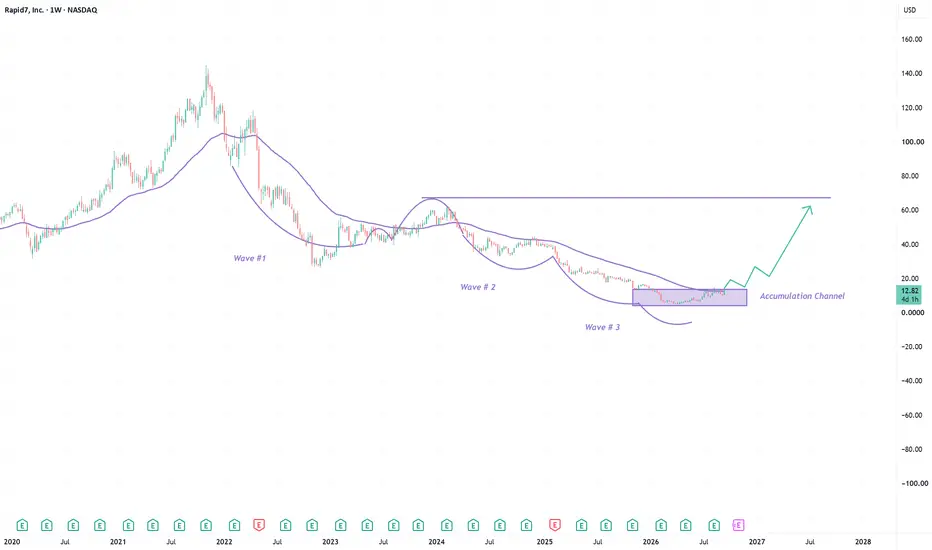
Looking at Rapid7 on the weekly chart, this is one of the cleaner potential bottoming structures you've posted recently.
The long-term trend is still bearish. RPD collapsed from roughly $140 at its 2021 peak to single digits in 2026, so I don't want to mistake one strong week for a completed reversal.
But the character of the decline has changed.
I've essentially got three major waves lower:
Wave #1 → stabilization → Wave #2 → stabilization → Wave #3 → accumulation
Each successive wave has brought price lower, but the third decline appears to have lost much of the momentum seen earlier in the bear market.
Now price has spent months building a base around approximately $5–$13, and this week's move to roughly $12.80 (+24%) is beginning to test the upper boundary.
To me, this could be the transition from:
markdown → capitulation → accumulation → early expansion.
The accumulation thesis is interesting. The reversal itself still needs confirmation.
The Three-Wave Structure
The larger structure is what catches my attention first.
Wave #1 took RPD from the $100+ area toward roughly $30.
Wave #2 eventually pushed the stock from around $60 into the $20s.
Wave #3 then took price into the single digits.
What matters to me isn't whether these are textbook Elliott waves. I'm using them primarily to visualize the progressive exhaustion of the downtrend.
The first decline was violent.
The second produced another major markdown.
The third pushed price to its lowest level, but eventually produced a much tighter and more controlled structure near the lows.
That's usually where I start looking for evidence that sellers are losing control.
The Accumulation Channel
The most important area on this chart is the rectangle you've marked from roughly $5–$13.
Rapid7 spent much of 2026 inside this range.
Instead of continuing immediately toward zero, price began moving sideways.
That's important because after a multi-year downtrend, time itself can become part of the bottoming process.
Weak holders exit.
Selling pressure gets absorbed.
Volatility compresses.
Eventually, price reaches a point where additional bad news struggles to create substantially lower prices.
That's the behavior I'm interested in here.
I wouldn't automatically call this institutional accumulation just from the chart, but it is a credible accumulation candidate.
This Week's +24% Move Matters
The current weekly candle is significant.
RPD opened around $10.62 and has traded as high as approximately $12.85, putting price directly against the top of the accumulation range.
This is exactly where I want to see buyers become aggressive.
But I'm not interested in simply chasing a 24% weekly candle.
The important question is:
Can Rapid7 leave the range and stay out of it?
That's the difference between a temporary squeeze and an actual change in market structure.
The First Breakout Area: $13–$15
Approximately $13–$15 is my first important confirmation zone.
RPD has spent months trading underneath this area, and the declining weekly trend/average is also converging nearby.
That creates confluence.
If price can break through this region with expanding participation, I'd consider that the first legitimate evidence that the accumulation phase is ending.
But the pullback afterward would be even more important.
My ideal sequence is:
$5–$13 accumulation → $13–$15 breakout → pullback → former resistance holds → higher low → expansion.
That's what would make me considerably more bullish.
The Weekly Trend Needs to Flip
The declining weekly trend line/average has controlled RPD throughout essentially this entire bear market.
Price has repeatedly rallied into it and failed.
So I don't want to ignore it simply because the stock has had one strong week.
A sustained move above that declining trend would tell me something fundamental about market structure has changed:
sellers are no longer able to defend the trend.
If RPD breaks above it and then successfully uses it as support, I'd start treating the move as an emerging new trend rather than just another bear-market rally.
What I Would Watch Above the Breakout
If $13–$15 breaks, I wouldn't immediately jump to the $60 target you've drawn.
There's a lot of trapped supply between here and there.
I'd think about it in stages.
My rough technical roadmap would be:
$13–$15 → $18–$20 → $25–$30 → $38–$42 → eventually $55–$65.
That final $60–$65 region is particularly important because it represents the major 2023–24 recovery high and a substantial previous supply area.
So I agree with the direction of your projected path, but I'd treat ~$60 as a long-term recovery objective conditional on an actual trend reversal, rather than an immediate price target.
Why $25–$30 Is Especially Important
If RPD eventually reaches the mid/high-$20s, I think that becomes a major test.
That's approximately where the previous breakdown accelerated and where the stock could encounter a large amount of overhead supply.
Getting there would already represent roughly a doubling from today's price.
If price reaches that region and then creates a higher low instead of collapsing back toward the accumulation range, I'd have much stronger evidence that this is a genuine new cycle.
Fundamentals — The Stock Is Bottoming Before the Business Has Returned to Growth
This is where Rapid7 becomes particularly interesting.
The fundamentals are not strong yet.
Q2 2026 revenue was approximately $210.9 million, down 1.5% year over year, while ARR declined 2% to $824 million. Management expects Q3 ARR of roughly $812 million, another 3% year-over-year decline, and full-year revenue of $837–$841 million, down approximately 2–3%.
So I can't build the bullish argument around current revenue growth.
There isn't any.
The market is potentially beginning to price something else:
stabilization and a future turnaround.
The Fundamental Deterioration Has Been Slowing
There's an interesting progression in the numbers.
Rapid7 ended 2025 with $840 million of ARR. That declined to $832 million in Q1 and then $824 million in Q2.
That's still contraction, so I'm not trying to make it sound bullish.
But this gives me a very clear fundamental indicator to watch alongside your technical accumulation channel.
If ARR starts stabilizing around these levels and eventually turns positive while the stock breaks out, the technical and fundamental theses would begin confirming each other.
That's what I'd want to see.
Profitability and Cash Flow Change the Risk Profile
This is probably the strongest part of the fundamental argument.
Rapid7 isn't an unprofitable cybersecurity company burning through its remaining cash while revenue collapses.
In Q2, it produced $3 million of GAAP operating income, $28.9 million of non-GAAP operating income and approximately $31.9 million of free cash flow.
The company also had approximately $702.6 million in cash, cash equivalents and government securities at quarter-end.
Management expects around $130 million of free cash flow for full-year 2026.
That matters enormously to me.
A company going through a revenue reset has much more time to repair itself when it's generating cash rather than consuming it.
Management Is Restructuring the Business
There's also been a major change in leadership and strategy.
Wael Mohamed became CEO in June, while longtime CEO Corey Thomas moved into the Executive Chairman role. Mohamed previously held senior leadership positions at Forescout and Trend Micro and was brought in with an explicit focus on operational execution.
Then in Q2, Rapid7 announced a restructuring affecting approximately 12% of its workforce.
Management is concentrating investment around two primary areas:
Detection & Response + Exposure Management, connected through its AI platform.
Fundamentally, that's important.
Rapid7 is essentially acknowledging that trying to do everything wasn't producing adequate growth.
The new strategy is about focus.
Now I need to see whether that focus actually improves execution.
AI Could Be a Catalyst — But I Want Revenue Proof
Rapid7 has also been aggressively repositioning itself around AI-powered security operations.
The company acquired Kenzo Security in March, bringing agentic AI technology into its security platform. Kenzo's technology is designed to automate security investigations and increase the percentage of alerts security teams can actually investigate.
Rapid7 has also expanded its Command Platform and launched Cyber GRC, connecting governance, risk and compliance workflows with live security-operations data.
The opportunity is real.
Cyber threats aren't disappearing. Rapid7's own recent research found a sharp increase in newly exploited vulnerabilities and much faster weaponization of vulnerabilities.
But I don't want to buy the stock simply because management says "AI."
I want to see:
product improvement → customer wins → ARR stabilization → ARR growth → operating leverage.
That's the fundamental sequence that would validate the story.
Customer Retention Is Important
Rapid7 still serves more than 11,500 customers, with approximately $70,000 of ARR per customer.
That existing customer base gives management something valuable to work with.
They don't need to rebuild the company from zero.
If the new leadership team can increase adoption across Detection & Response, Exposure Management, GRC and AI-driven security operations within that installed base, the revenue trajectory could improve without requiring an entirely new customer ecosystem.
That's why I see this more as a turnaround than a distressed-company survival trade.
Why This Setup Interests Me
The technical and fundamental pictures are beginning to line up in an interesting way.
Fundamentally:
Revenue contracting → ARR declining → restructuring → new CEO → strategic focus → strong cash position → positive free cash flow.
Technically:
Wave #1 down → Wave #2 down → Wave #3 down → selling exhaustion → prolonged base → breakout attempt.
That combination is exactly what I look for in a turnaround setup.
The business doesn't have to be perfect at the bottom.
In fact, it usually isn't.
The question is whether the rate of deterioration is beginning to improve before the market recognizes it.
My Bullish Scenario
My preferred sequence from here would be:
$5–$13 accumulation → $13–$15 breakout → controlled retest → higher low → $18–$20 → $25–$30.
If RPD can establish itself above $25–$30, then I think the larger recovery thesis becomes substantially more credible.
From there, $38–$42 would be another important supply zone.
Only after clearing those areas would I start taking the chart's larger $55–$65 objective seriously.
The important thing is that each rally creates a higher floor.
My Bearish Scenario
My invalidation is straightforward.
If this breakout attempt fails and RPD falls back into the accumulation range, I become more cautious.
If it subsequently loses roughly $7–$8, I'd assume the base needs more time.
A decisive breakdown beneath approximately $5–$6, especially with expanding volume and worsening fundamentals, would largely invalidate my current accumulation thesis.
That would tell me the market hasn't finished repricing the company.
My Bias
I'm cautiously bullish on Rapid7 here, but I view it as an early-stage turnaround setup rather than a confirmed long-term uptrend.
What I like is the combination of:
A three-wave multi-year decline
A prolonged base at depressed prices
Price beginning to challenge the top of that base
A declining weekly trend that's now within reach
Positive free cash flow despite declining revenue
More than $700 million of cash and government securities
New leadership and a more focused operating strategy
A large existing cybersecurity customer base
What I don't have yet is the most important confirmation: growth.
So for me, $5–$10 represents the established base, $13–$15 is the breakout test, $18–$20 is the first meaningful expansion zone, and $25–$30 is where I'd start believing the larger reversal has real strength.
If the chart breaks out while ARR simultaneously begins stabilizing, that's where this setup becomes much more compelling.
Until then, I'm treating the current +24% weekly move as the beginning of a possible change in character—not proof that the entire bear market is over.
Trade Safely
Enjoy  Long
Long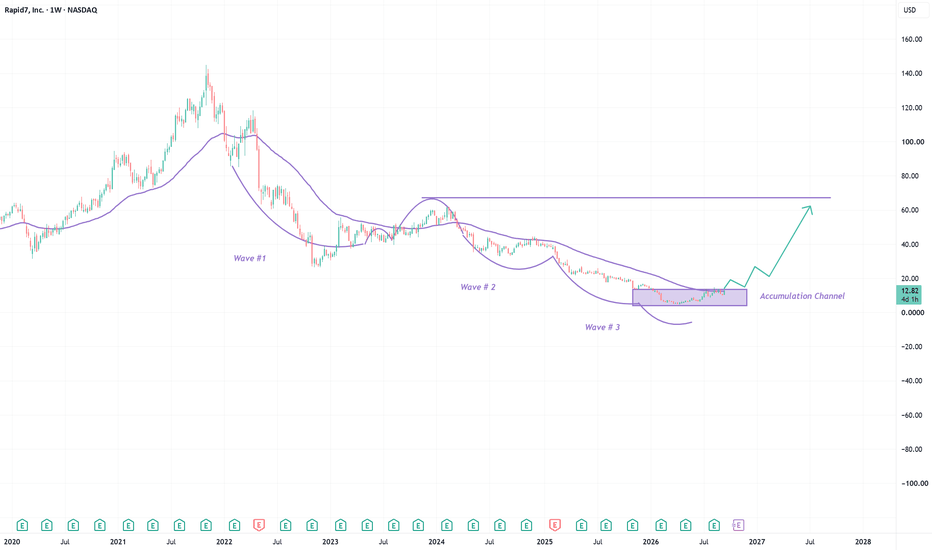
Long 
 Short
Short