Cheniere Energy: Next Structural Move? — 3M | 1M | 1W | 1D | 4HCheniere Energy: Decoding the Multi-Degree Structural Architecture on the Threshold of the Next Major Move
Integrated Structural, Time, and Price Analysis Across the 3M, 1M, 1W, 1D, and 4H Timeframes
────────────────────────────────────────────────
1. Structural Hypothesis
Cheniere Energy is currently at a sensitive stage of its long-term structural development. Price has moved toward the upper regions of the broader structure, while the final identity of the higher-degree structure remains unresolved.
At the Cycle degree, only the initial point, , can currently be regarded as structurally confirmed. The opposing endpoint, , has not yet been determined, and therefore the final endpoint of the current long-term structure remains an open structural variable.
As a result, the current condition cannot be reduced to a predetermined price target or reversal point. Instead, the market is moving toward a Time–Price decision zone; an area in which several plausible structural scenarios remain active.
In the 3M timeframe, the primary time windows are 2.618, 3.618, and 5.0, measured relative to .
Along the price axis, the structure has so far moved through the 75%, 78.6%, and 100% levels, while the 127.2%, 150%, 161.8%, 200%, and 261.8% levels may still act as potential areas for continued structural extension or completion.
Therefore, the primary question is not simply whether Cheniere Energy will continue its upward movement; rather, the central question is:
To which structural degree does the current upward movement ultimately belong?
At the higher degree, two primary possibilities remain: Is the market completing (N.1), or is it developing toward ?
At the monthly degree, the question is whether the current sequence completes as a five-phase structure or extends into a seven-phase development.
The 1W, 1D, and 4H structures are used not as independent forecasts, but as evidence from lower degrees to progressively clarify the unresolved structure at the higher degree.
Accordingly, Cheniere Energy should currently be regarded as a conditional structural transition; meaning that the market itself must determine which of the higher-degree scenarios ultimately remains valid.
Figure 1 — Long-Term Structural Origin in the 3M Timeframe
────────────────────────────────────────────────
2. Structural Hierarchy
The analysis progresses through a hierarchical sequence:
3M | 4 | Cycle | ➔
1M | 3 | Primary | → → → →
1W | 2 | Intermediate | (N.1) ➔ (L.1) ➔ (N.2)
1D | 1 | Minor | α ➔ β ➔ γ ➔ δ ➔ ω
4H | 0 | Minute | P.a ➔ v.β ➔ P/Pc.c
The purpose of moving across these degrees is not to treat every movement in a lower timeframe as an independent confirmation.
A movement at a lower degree can provide evidence for the development of a higher-degree structure, but completion of a lower-degree structure alone cannot prove completion of the higher-degree structure. This distinction is particularly important in the current market condition because the higher-degree structure remains only partially resolved.
────────────────────────────────────────────────
3. Long-Term Structural Architecture — 3M Timeframe
The 3M timeframe defines the primary long-term framework of the current model.
The model begins from the historical reference identified as , recorded at April 1979 / $85.50, and the corresponding Alpha point identified at October 2002 / $0.40.
This reference serves as the time and price origin for measuring the current structure at the Cycle degree. Following this, the upward movement developed into a broad and multi-phase extension.
However, this point is not regarded merely as an ordinary price low; rather, it establishes the reference against which the subsequent long-term development is evaluated.
At the current stage, at the Cycle degree, only this initial structural point is regarded as confirmed. Its opposing point, , remains unresolved.
Therefore, two possibilities at the higher degree remain open:
(N.1)?
or
?
The question mark does not merely indicate uncertainty regarding the direction of movement. Rather, it indicates uncertainty regarding the structural identity of the future endpoint of the movement.
Therefore, this distinction is highly important. The current rise may represent the completion of a (N.1) structure at the Primary degree, or it may represent the continued development of Degree 4, namely .
Thus, the existing ambiguity is structural, rather than merely directional.
────────────────────────────────────────────────
4. Structural Boundaries and Time–Price Zones in the 3M Timeframe
The long-term price structure remains within a broad upward structural channel, while Fibonacci extension levels define the primary price boundaries.
Price levels already surpassed: 75% ← 78.6% ← 100%
The remaining extension levels are: 127.2% ← 150% ← 161.8% ← 200% ← 261.8%
These levels define the remaining price range within which the current structure may continue its extension or ultimately reach completion.
The time dimension creates a second set of structural boundaries:
2.618 → 3.618 → 5.0
Both dimensions, time and price, are measured relative to the origin .
The significance of this is that the completion of a structure in time becomes more analytically meaningful when time and price converge within a common zone, rather than when price merely reaches an individual Fibonacci level.
Therefore, the current condition in the 3M timeframe remains a multi-scenario Time–Price field, rather than a predetermined endpoint.
Figure 2 — 3M Time–Price Scenario Map for
────────────────────────────────────────────────
5. — Current Scenario Field
Three primary time windows remain active for the potential development or completion of :
Window 1 — 2.618 Window 2 — 3.618 Window 3 — 5.0
These time windows interact with the remaining price boundaries:
127.20% 150% 161.80% 200% 261.80%
The resulting structure is better regarded as a Time–Price search field within which the future may reach maturity.
As the market approaches one of these time and price zones, the corresponding structural scenario gains or loses significance according to price behavior within that zone. The market itself must gradually eliminate or reinforce the competing probabilities.
Therefore, the analysis intentionally preserves multiple scenarios until the interaction between price and time becomes sufficiently constraining to allow the identification of the endpoint of the higher-degree structure.
────────────────────────────────────────────────
6. Monthly Structural Decomposition — 1M Timeframe
The monthly timeframe decomposes the long-term upward movement into its internal structure at the Primary degree:
→ → → →
At the current position, two primary structural paths remain open.
Scenario A —
In this scenario, the current five-phase structure terminates with .
This completion raises the question of whether this movement simultaneously completes the higher-degree structure, namely (N.1), or whether it functions as an endpoint associated with .
Scenario B —
In this scenario, the current structure moves beyond and enters the following sequence:
← ←
After that, the remaining final phase also develops eventually.
This condition indicates that the structure at the Primary degree remains incomplete and requires further development before the endpoint at the higher degree can be determined.
This distinction makes the monthly structure one of the principal decision-making layers in the entire model.
The distinction between these two scenarios cannot be resolved solely through the monthly structure. The purpose of the monthly structure is to identify the competing structural paths that the lower degrees must subsequently decompose and resolve.
Figure 3 — Monthly Five-Phase Structure
────────────────────────────────────────────────
7. Monthly Seven-Phase Scenario
To examine the extension hypothesis, a secondary seven-phase scenario is retained in the monthly timeframe.
The purpose of this scenario is not to impose a seven-phase interpretation on the market, but to examine whether the current movement requires development beyond the standard five-phase completion.
Under this scenario, the continuation of the movement would proceed through the following sequence:
→ →
Under this scenario, each phase develops within its own approximate Time–Price range.
The most important temporal implication of this scenario is that, if the seven-phase structure remains valid, its completion could approach the 3.618 time boundary.
In such a case, the endpoint of the higher degree, , could also occur within the same time zone.
This convergence is analytically important because it connects the seven-phase scenario at the lower degree to a potential completion window at the higher degree.
Therefore, the seven-phase interpretation remains a conditional structural branch that becomes active only if the market fails to complete the current five-phase scenario and continues to develop further.
Figure 4 — Monthly Seven-Phase Scenario
────────────────────────────────────────────────
8. Continuous Double Corrective Structure — 1W Timeframe
In this section, the 1W timeframe examines Degree 2 of the structural hierarchy, and the analysis focuses on the current final branch, which begins from the completion of .
itself is the fourth phase of either a five-phase neutral structure or a seven-phase symmetrical structure previously identified and examined in the monthly timeframe.
Therefore, in the 1W timeframe, the analysis focuses on the fifth branch in order to determine what this branch is, how far it has developed, and whether the structure has reached completion or remains incomplete.
The identification and evaluation of the structural status of this branch constitute the primary focus of the analysis in this timeframe.
The active weekly sequence is identified as follows:
(N.1) → (L.1) → (N.2)
This configuration forms a continuous double corrective structure, in which (N.1) forms the initial component of the structure and has a seven-phase symmetrical character; (L.1) functions as the connecting structure and itself forms a five-phase neutral structure; and (N.2) is the current active branch, extending toward higher price levels.
This branch is currently incomplete and will be examined in greater detail through a zoomed analysis in the daily timeframe.
As shown in the chart inserted below, the potential area of further expansion and development in both time and price has been marked hypothetically.
At the current stage, from a price perspective, (N.2) is positioned at the 0.5 Fibonacci ratio, measured relative to (N.1).
More precisely, the current price is positioned at 50% of the price of (N.1).
Figure 5 — Weekly Continuous Double Corrective Structure
────────────────────────────────────────────────
9. Daily Structural Development — 1D Timeframe
In this section, the 1D timeframe examines Degree 1 of the structural hierarchy, with the analysis focused on the third component of the corrective double structure, namely (N.2).
The current sequence of this structure is identified as:
α → β → γ → δ → ω
The primary focus of the analysis is the active structure (N.2).
Within this branch, the market is developing a standard five-phase neutral structure and is currently still in phase γ, meaning the third phase of a five-phase structure.
Since γ has not yet been completed, the daily structure has not yet reached its terminal sequence.
To complete this structure, following the completion of γ, the next two phases, δ and ω, must develop sequentially.
Consequently, the continued development of γ, followed by the formation of δ and ω, is important for resolving the weekly structure (N.2) and may ultimately contribute to the identification and evaluation of structural scenarios at the monthly timeframe.
In the image below, hypothetical Time–Price zones for γ, δ, and ω have been drawn.
These zones are by no means certain or predetermined, nor have they been drawn randomly. Rather, they have been designed on the basis of structural proportions and the potential relationships that a standard five-phase structure may produce under its structural rules and principles, so that the potential development ranges of each branch can be visualized in both the time and price dimensions.
Accordingly, the current purpose of this image is simply to serve as a roadmap. The actual path of structural development must be confirmed or rejected on the basis of future market behavior and structural evidence.
In the next timeframe, the analysis will focus on this same branch ω. Its internal structure will then be examined in greater detail to determine what structural form it has, how far it may potentially develop, and whether it has reached completion or remains incomplete.
Figure 6 — Daily Five-Phase Structural Development
────────────────────────────────────────────────
10. Decomposition of the Third Branch of the Daily Structure — 4H Timeframe
In this section, the 4H timeframe provides the nearest structural decomposition relative to the current market price, with the analysis focused on the third branch of the daily structure.
This branch, identified as γ in the daily timeframe, is decomposed at this degree in greater detail to determine its internal architecture and degree of development.
The current sequence in the 4H timeframe is identified as:
P.a → v.β → P/Pc.c
Within this structure, the active branch is divided into three primary components:
First branch: a structure consistent with a standard impulse structure, forming the initial component of the sequence.
Second branch: a corrective structure displaying the characteristics of a standard five-phase neutral structure.
Third branch: the current active and developing component, which at present represents the last unresolved portion of the structure.
Based on this configuration, the primary question at this degree is whether these three components, taken together, can form a larger corrective structure of the zigzag type.
This interpretation is currently conditional and is not accepted merely on the basis of visual similarity. Rather, its validity must be determined through the internal development of the third branch and its interaction with the defined price, structural, and time boundaries.
Therefore, the third branch is the determining component of this structure.
Its completion will determine whether the entire three-part sequence can ultimately be classified as a valid zigzag, or whether, as new evidence emerges, the structure will require reassessment and reclassification.
Figure 7 — Four-Hour Three-Branch Structural Architecture
In the current condition, the 4H structure provides a conditional zigzag scenario whose validity has not yet been finalized.
The determination of this scenario depends on the development of the third branch and the extent to which it conforms to the constraints defined by price, structure, and time.
Consequently, the continuation of this structure will be determined through the development of the third branch and the testing of its validation conditions, which are examined independently in the following section.
Figure 8 — Conditional 4H Zigzag Scenario
────────────────────────────────────────────────
11. Zigzag Validation Conditions — 4H Timeframe
The validity of the zigzag structure at this degree is directly dependent on the development of the third branch.
This branch can remain structurally valid within the current scenario only if it simultaneously respects the defined price constraints, structural boundaries, and time range.
Price Condition:
The defined price threshold for the third branch is:
$250.77
The third branch must develop above $250.77 while at the same time remaining below the primary resistance boundary identified on the chart.
If price reaches or breaks through the prohibited resistance before reaching the corresponding time boundary, the current zigzag scenario becomes invalid and the structure must be reassessed and, if necessary, reclassified.
Time Condition:
From a temporal perspective, the third branch has two structural constraints.
The minimum time required for its development is defined by the 1.0 time ratio, corresponding to the duration of the first branch.
In contrast, the maximum permitted duration is determined by the combined duration of the previous two branches.
Therefore, the third branch not only requires a minimum amount of time to reach structural maturity, but must also determine its structural outcome before crossing the maximum temporal boundary.
As a result, the validation framework for the zigzag at this degree rests on four primary components:
Price condition + Structural boundary + Minimum time + Maximum time
Only when these conditions remain simultaneously satisfied will the current interpretation be maintained as a valid zigzag.
Otherwise, if market behavior changes or any of the defined boundaries is violated, the validity of the scenario will be called into question and the structure must be reassessed.
Figure 9 — 4H Zigzag Validation
────────────────────────────────────────────────
12. Integrated Structural Assessment
The current multi-degree structure, from the 3M timeframe through the 4H timeframe, presents a continuous and interconnected structural hierarchy in which, at each degree, the higher-degree structure is decomposed and constrained in greater detail.
At the Cycle degree, the identity of the opposing endpoint, namely , remains unresolved. Therefore, the 3M structure remains within a Time–Price scenario field, with the time windows 2.618, 3.618, and 5.0 and the price range from 127.20% to 261.80% serving as the principal boundaries for potential development.
At the Primary degree, this broader field is reduced to two principal structural paths: completion of the five-phase structure or continued development in the form of a seven-phase structure.
The weekly structure transfers this ambiguity one degree lower and connects the current movement to (N.2) within a continuous double corrective structure.
The daily timeframe then decomposes this same branch into a standard five-phase neutral structure, which is currently at γ and has not yet reached its terminal sequence.
At the lowest degree examined, the 4H timeframe decomposes the γ structure into a three-part sequence which, based on its current architecture, allows a conditional interpretation as a zigzag.
However, this classification will only be maintained if the third branch can simultaneously satisfy the requirements of price, structure, and time.
Therefore, the validity of this interpretation remains dependent on the future behavior of this same branch and its passage through the defined boundaries.
Overall, the evidence obtained from the lower degrees does not yet prove completion of the higher-degree structure. Rather, by progressively constraining the probabilistic space, it enables a more precise assessment of the remaining scenarios.
From this perspective, the model does not provide a fixed price target or predetermined endpoint. Instead, it follows a process of structural identification, validation, and, when necessary, reclassification, in which each degree provides the information required to progressively resolve the higher degree.
────────────────────────────────────────────────
13. Forward Structural Roadmap
The current structural roadmap can be viewed as a hierarchical sequence that begins at the Cycle degree and, by moving toward the lower degrees, progressively decomposes and constrains the unresolved structure:
3M
→ Endpoint of the higher-degree structure remains unresolved
↓
1M
→ or continued development toward →
↓
1W
(N.1) → (L.1) → (N.2)
↓
1D
α → β → γ → δ → ω
↓
4H
Three-branch development → Conditional zigzag scenario
↓
Validation
$250.77 + Resistance boundary + Minimum and maximum time
This roadmap does not represent a predetermined path for future market movement. Rather, it illustrates the current sequence through which the structure is being resolved across the different degrees.
At each stage, the lower-degree structure must provide the evidence required to evaluate the higher-degree structure, without completion of a lower-degree structure alone implying completion of the higher-degree structure.
Therefore, the significance of the current market condition cannot be reduced to a simple directional forecast.
The central question is whether structural development across the lower degrees can, while preserving the constraints of time, price, and structure, progressively narrow the space of competing scenarios and provide sufficient evidence to identify and validate the higher-degree structure or not.
Within this framework, each new movement is evaluated not merely as a continuation or reversal in price, but as evidence for maintaining, strengthening, weakening, or reclassifying the structural scenario.
────────────────────────────────────────────────
14. Final Structural Conclusion
Cheniere Energy is currently approaching a structural decision point; a point at which time, price, and the internal development of structures must interact with one another so that the identity of the higher-degree structure can be established with greater confidence.
In the 3M timeframe, remains unconstrained to a single final location, and multiple Time–Price zones remain as potential areas for structural development or completion.
In the monthly timeframe, two primary paths remain valid: completion of the five-phase structure or continued development in the form of a seven-phase structure.
In the weekly timeframe, this ambiguity is transferred into a continuous double corrective structure and linked to (N.2).
In the daily timeframe, this same branch is developing as a standard five-phase neutral structure and remains in phase γ.
Finally, the 4H timeframe represents the nearest structural layer to the current market price and provides the opportunity to directly examine the internal architecture of the third branch and test the conditional zigzag hypothesis.
Accordingly, the current condition cannot be classified as a confirmed completion of the higher-degree structure.
What is currently developing is a conditional structural transition, in which evidence from the lower degrees must progressively constrain the space of competing scenarios.
At the lowest degree examined, the validity of the zigzag scenario depends on the development of the third branch and its simultaneous adherence to the price condition, structural boundary, and temporal constraints.
A move above $250.77, provided that price remains below the defined resistance boundary and respects the required time range, may strengthen this interpretation. Conversely, violation of any of these conditions at any degree reduces the validity of the scenario at the corresponding degree and creates the need for reassessment or reclassification of the structure at the degree in which the violation occurs.
The same principle applies at the higher degrees.
Evidence obtained from the lower timeframes must not predetermine the endpoint of the structure; rather, it must determine whether the current movement ultimately leads to the completion of (N.1), forms , or requires further structural development before its final identity can be established.
Therefore, the final conclusion of this analysis is not a fixed price target or predetermined reversal point. Rather, it is a progressive process of structural identification, validation, and, when necessary, reclassification.
Within this framework, each timeframe provides part of the evidence required to resolve the higher degree, and the final structural identity can only be approached when time, price, and structural behavior converge sufficiently within a common area.
────────────────────────────────────────────────
 Long
Long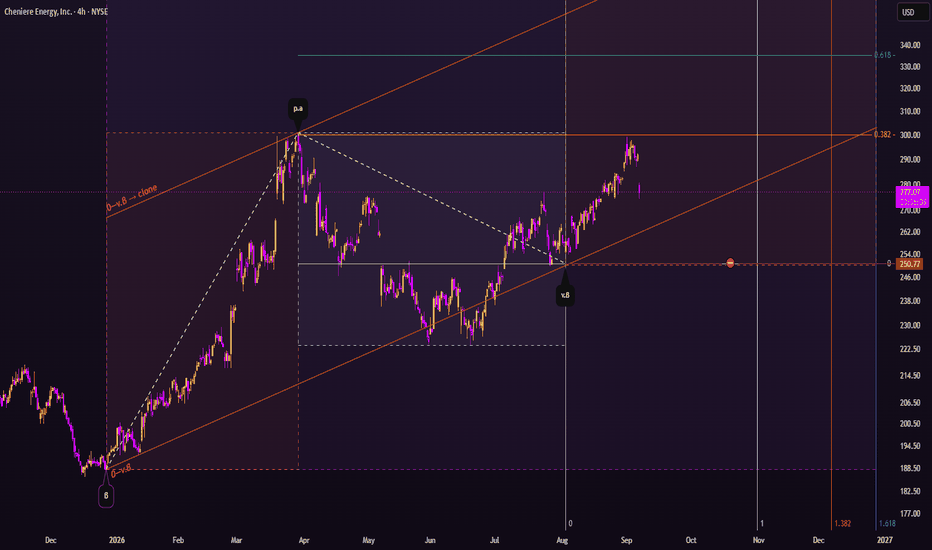
 Long
Long
SMCI: Super Micro Computer Potential 872% long-term investmentMarket Overview
SMCI is trading around $40.93 after a prolonged correction from the 2024 high.
The weekly chart places price inside a larger Wave (iv) structure, while the 4H chart shows a smaller corrective sequence developing within it.
Fundamental / News Catalyst
The AI infrastructure backdrop remains strong. Supermicro reported $11.1B in Q4 FY2026 revenue, up from $5.8B a year earlier, and said it entered FY2027 with record backlog and more than $60B in new orders during Q4.
In June, Supermicro also announced financing to support roughly $39B of AI-server orders from more than 20 customers.
The broader AI-server market remains strong, with Dell recently raising its outlook on surging AI infrastructure demand.
Technical Analysis
The weekly structure shows SMCI developing a large Wave (iv) triangle following the major advance into 2024.
The key level above is $122.57. A sustained break would confirm further upside within the larger impulse.
On the 4H chart, price is developing another corrective sequence. The projected path allows for a move toward $51.34, followed by another pullback before a larger advance.
The shorter-term bullish count is invalidated below $23.31.
The larger weekly triangle is invalidated below $17.38.
Key Levels
$122.57 — Weekly bullish confirmation
$51.34 — 4H structural reference
$40.93 — Current price
$23.31 — 4H invalidation
$17.38 — Weekly triangle invalidation
Bullish Scenario
SMCI completes the current 4H correction, pushes through $51.34, and eventually breaks $122.57, confirming continuation of the larger bullish structure.
Bearish Scenario
A break below $23.31 invalidates the current 4H impulse count. A move below $17.38 would invalidate the larger weekly triangle.
Kap Waves Outlook
SMCI's fundamentals are strong, but the chart is still corrective.
The 4H structure needs to develop first. $23.31 protects the near-term count; $122.57 confirms the larger bullish structure.  Long
Long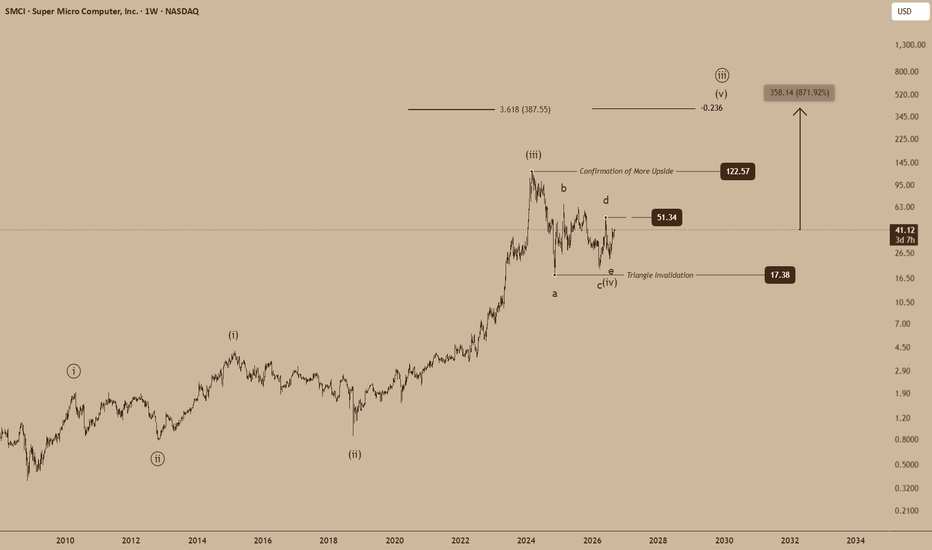
 Long
Long
 Long
Long
 Long
Long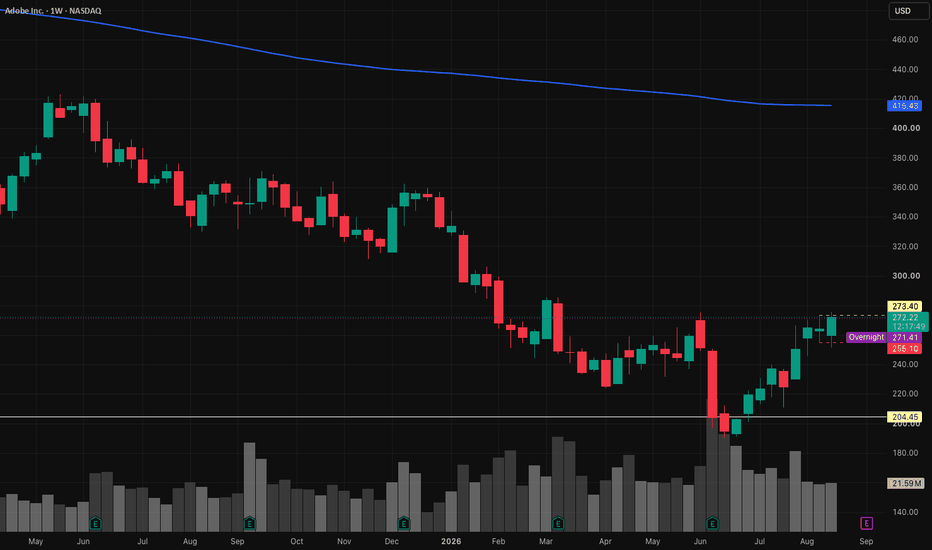
As expected, the price is still showing strong bearish momentum As expected, the price is still showing strong bearish momentum and continues to drop sharply. The selling pressure remains strong, and there is still no clear sign of a strong reversal. Buyers should be cautious, as buying while the bearish momentum is still strong carries significant risk. Don’t rely solely on strong fundamentals—price action still plays an important role in short-term market movements.
In my opinion, the price could drop much lower than we imagine.
Despite Adobe having strong fundamentals and continued revenue growth, its stock is struggling to move higher because the market is focused more on future risks than current financial performance.
1. AI competition is increasing
Investors are concerned that AI-powered creative tools could weaken Adobe's traditional competitive advantage. Competitors such as Canva and Figma, along with rapidly developing generative-AI tools, are creating more pressure on Adobe's core business. �
MarketWatch +1
2. Concerns about AI monetization
Adobe is investing heavily in AI through products such as Firefly, but investors still want clearer evidence that AI can generate substantial long-term revenue without damaging Adobe's existing subscription business. �
S&P Global +1
3. Growth expectations have changed
Adobe is still growing, and its Q2 fiscal 2026 revenue reached $6.62 billion, up 13% year over year. However, strong results alone are not always enough when investors expect future growth to slow or become more difficult. �
Adobe Newsroom +1
4. Leadership uncertainty
Recent executive changes have added another layer of uncertainty. Leadership transitions can make investors cautious, especially when the company is already navigating major technological disruption. �
Barron's +1
The Bottom Line
Adobe may have strong fundamentals, but strong fundamentals do not automatically mean the stock price will rise. The market is currently pricing in concerns about AI disruption, intensifying competition, future growth, and leadership uncertainty.
That is why ADBE can continue struggling despite the company remaining fundamentally profitable and financially strong.
Disclaimer: This is my personal opinion only and not financial advice. Short 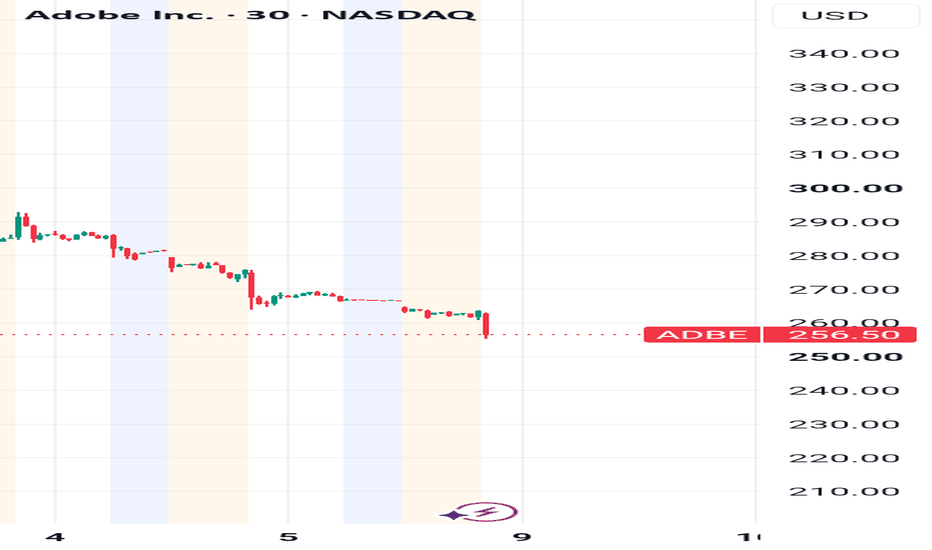
 Long
Long
 Long
Long
 Long
Long
DPRO Bullish Setup - Defense Drone Catalyst, Call Activity and $DPRO is showing an interesting bullish setup following a series of positive developments in its defense and drone business.
The latest catalyst is Draganfly's selection as a qualified supplier across all five capability streams of Canada's new Defense Drone Initiative Marketplace. This does not guarantee a contract, but it positions Draganfly to compete for future testing, prototype development, acquisitions, and potential production opportunities.
This follows another important development involving the company's Heavy Lift drone platform and its FAA Section 44807 exemption. Together, these developments could expand Draganfly's opportunities in defense, logistics, emergency response, and other heavy payload applications.
The 1-hour chart is also developing an interesting technical setup. DPRO is trading near $6.05, with an important confluence support area between $5.82 and $5.95.
As long as this support holds, I am watching $6.26 as the first upside level, followed by the important $6.49-$6.57 resistance zone. A breakout above this resistance area could open the door to approximately $6.62, then $6.93, and the $7.02 area. The alternative scenario also needs to be considered. A sustained move below $5.82 would weaken the bullish setup and could expose $5.64, followed by the $5.40-$5.30 area.
Options activity adds another interesting component to the setup. DPRO has recently experienced significant call activity, including interest in the October $6 and $7.50 calls. The option chain also shows substantial open interest around the October $6 strike.
My thesis is that traders may be beginning to assign greater value to DPRO's expanding defense drone opportunity. The combination of recent catalysts, unusual call activity, and improving technical structure makes this stock worth watching.
Key support: $5.82 to $5.95
First resistance: $6.26
Major resistance: $6.49 to $6.57
Upside levels: $6.62, $6.93, and $7.02
The setup becomes more compelling if DPRO can hold support and break through the $6.49-$6.57 resistance zone on increasing volume.
This is a speculative, higher-volatility trade idea. The price levels shown represent potential technical scenarios and are not guaranteed future price targets.  Long
Long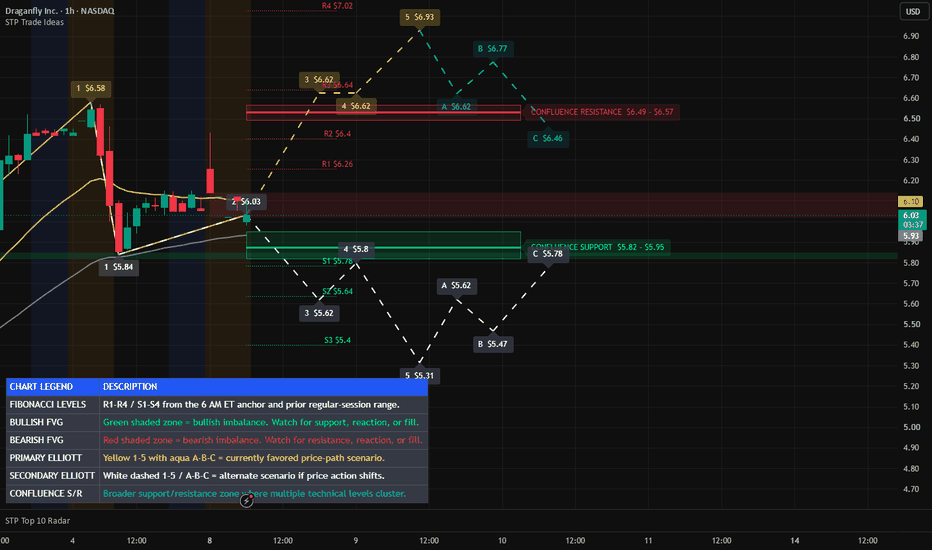
Tesla’s Robotaxi Era Is Picking Up SpeedAuto Manufacturers
Ticker: TSLA
Recommendation: Buy
Share price as of September 4, 2026: $354.08
Target Price: $425.00
Stop-Loss: $337.40
Key arguments supporting the idea:
A potential acceleration in the expansion of the robotaxi fleet and the launch of the new Cybercab
model on public roads may attract additional demand for the company’s shares.
The company’s electric vehicle deliveries for Q3 2026 may come in significantly above the
consensus forecast.
Investment Thesis
Tesla, Inc. (TSLA) is the largest manufacturer of battery electric vehicles (BEVs) in North America and a notable player in the renewable energy market, actively developing new technology areas such as Autopilot, humanoid robots, and robotaxis.
Tesla is bringing the new Cybercab model onto U.S. roads, while the company’s robotaxi fleet is expanding at an accelerating pace. In June, 69 Tesla robotaxis were registered in Texas; by early September, this figure had increased to more than 400 autonomous vehicles. At the end of August, the number of these vehicles on Texas roads began to increase sharply. The next major development is the appearance of Cybercab on U.S. roads this month. This model has no conventional controls (steering wheel or pedals) and is fully autonomous. On September 3, Tesla officially launched Cybercab in Texas, and these vehicles already account for 10% of the company’s total robotaxi fleet and may soon replace driverless Model Y vehicles.
Tesla also plans to introduce the Cybercab model in China in the middle of the month. In the second quarter, there were only a few dozen Tesla robotaxis on U.S. roads, and we saw no growth in the fleet. The company explained this by the need to conduct additional service testing to avoid safety risks for road users. However, we are now seeing signs that the company appears to have gained sufficient confidence in its technology to begin rapidly scaling the new service.
We believe that the launch of Cybercab on public roads and the growth of the overall
robotaxi fleet will attract new interest in Tesla shares in the coming months.
Tesla’s electric vehicle deliveries in key markets have remained strong in recent months.
Deliveries of Tesla electric vehicles manufactured in China in July and August 2026 increased by
19% YoY to 179 thousand vehicles, according to data from the China Passenger Car Association
(CPCA). Typically, the company’s China-made electric vehicles account for around half of total
deliveries. Most are sold in China, but a significant portion is also exported, mainly to Europe.
Preliminary data also indicate strong growth in electric vehicle sales in Europe. According to data from the European Alternative Fuels Observatory (EAFO), total battery electric vehicle (BEV) sales in Europe increased by 41.8% YoY in July. In August, trends across countries in the region were mixed, although several-fold year-over-year growth was observed in France and Denmark.
Tesla holds a significant market share in the EU. In the U.S., Tesla sales remain weak compared
with last year, but the month-over-month recovery may continue.
Current conditions could result in Tesla’s total Q3 deliveries reaching 480 thousand vehicles. The current consensus forecast stands at 461 thousand vehicles, according to FactSet. On October 2, Tesla will release operating data on total vehicle sales for the quarter.
We believe that TSLA shares may continue to rise over the next two months. The target price over a two-month horizon is $425; we recommend setting the stop-loss at $337.4.  Long
Long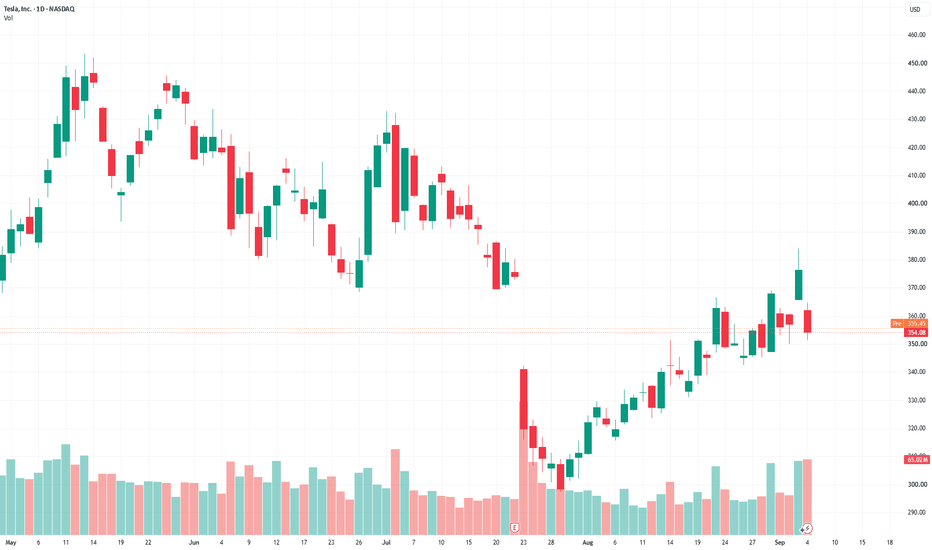
Micron Has Been SqueezingMicron Technology has consolidated for two months, and some traders may see potential for the longer-term uptrend to continue.
The first pattern on today’s chart is the narrowing range that began in late July. Bollinger Bandwidth has shrunk to the tightest level since late March. That compression may create potential for movement to resume.
Second, the memory-chip giant ended last week at its highest weekly close since late June. Prices also pushed above the 50-day simple moving average. Both signals may reflect intermediate-term bullishness.
Next, the 8-day exponential moving average (EMA) crossed above the 21-day EMA. MACD is also rising. Those signals may reflect short-term bullishness.
Finally, MU is a highly active underlier in the options market. (Its average daily volume of 921,000 contracts ranks fourth in the S&P 500, according to TradeStation data.) That could help traders take positions with calls and puts.
TradeStation has, for decades, advanced the trading industry, providing access to stocks, options and futures. If you're born to trade, we could be for you. Learn more here about TradingView’s Broker of the Year!
Past performance, whether actual or indicated by historical tests of strategies, is no guarantee of future performance or success. There is a possibility that you may sustain a loss equal to or greater than your entire investment regardless of which asset class you trade (equities, options or futures); therefore, you should not invest or risk money that you cannot afford to lose. Online trading is not suitable for all investors. View the document titled Characteristics and Risks of Standardized Options at www.TradeStation.com . Before trading any asset class, customers must read the relevant risk disclosure statements on www.TradeStation.com . System access and trade placement and execution may be delayed or fail due to market volatility and volume, quote delays, system and software errors, Internet traffic, outages and other factors.
Securities and futures trading is offered to self-directed customers by TradeStation Securities, Inc., a broker-dealer registered with the Securities and Exchange Commission and a futures commission merchant licensed with the Commodity Futures Trading Commission). TradeStation Securities is a member of the Financial Industry Regulatory Authority, the National Futures Association, and a number of exchanges.
Options trading is not suitable for all investors. Your TradeStation Securities’ account application to trade options will be considered and approved or disapproved based on all relevant factors, including your trading experience. See www.TradeStation.com . Visit www.TradeStation.com for full details on the costs and fees associated with options.
Margin trading involves risks, and it is important that you fully understand those risks before trading on margin. The Margin Disclosure Statement outlines many of those risks, including that you can lose more funds than you deposit in your margin account; your brokerage firm can force the sale of securities in your account; your brokerage firm can sell your securities without contacting you; and you are not entitled to an extension of time on a margin call. Review the Margin Disclosure Statement at www.TradeStation.com .
TradeStation Securities, Inc. and TradeStation Technologies, Inc. are each wholly owned subsidiaries of TradeStation Group, Inc., both operating, and providing products and services, under the TradeStation brand and trademark. When applying for, or purchasing, accounts, subscriptions, products and services, it is important that you know which company you will be dealing with. Visit www.TradeStation.com for further important information explaining what this means. What Is a Short Locate?Imagine this.
You wake up early, spot a small-cap stock gapping up 50% on premarket news, and decide it looks like a great short. You request a locate, accept the quoted fee, and wait for the opening bell.
The setup never comes.
Maybe the stock keeps squeezing higher. Maybe you simply decide the risk isn't worth it.
So you don't place the trade.
Later that day, you check your account and notice you've still been charged for the locate.
If you've never shorted stocks before, that charge can seem confusing.
"I never even entered the position. Why did I pay?"
The answer comes down to what a short locate actually is.
Many traders assume a locate fee is part of the short trade itself. It isn't. The fee is charged when you accept the locate, not when your short order fills. Whether you end up selling a single share or never place the trade at all doesn't change that.
Every short sale on a U.S. exchange starts the same way. Before your broker can even accept a short order, they first need to confirm that shares are actually available to borrow. That's what the locate does.
Knowing when you are charged is as important as knowing how much you're charged.
A short locate follows a simple sequence:
you request shares, your broker quotes a borrow fee, you decide whether to accept it, and you may receive a credit if those borrowed shares aren't fully used.
Once you understand that sequence, the charges on your account make a lot more sense.
📌 Why Does a Locate Exist?
When you buy a stock, the process is straightforward. You purchase shares and become their owner.
Short selling works differently.
You're selling shares you don't own yet. Those shares first have to be borrowed from someone else, with the intention of buying them back later and returning them.
Naturally, that raises an important question.
How does the broker know those shares are actually available?
That's exactly why the locate exists.
Before a broker can accept your short order, U.S. regulations require them to make a reasonable determination that the shares can be borrowed and delivered when the trade settles. That confirmation is known as a locate .
One point that often confuses newer traders is the difference between a locate and margin.
A locate is the broker's confirmation that shares are available to borrow before opening a short position. Margin, on the other hand, is financing that's applied after a position exists. They may both appear as costs on your account, but they're solving two completely different problems.
If you're an active short seller, you'll often request locates before the market even opens. Many brokers start accepting locate requests as early as 4:00 AM ET , giving traders time to secure borrow before reacting to overnight news or premarket price moves.
Think of it this way: a locate doesn't put you into a trade. It simply makes the trade possible.
📌 What a Short Locate Actually Is
A short locate is simply your broker confirming one thing:
"Yes, we can borrow these shares for you."
That confirmation happens before your short order is even allowed into the market.
Think of it as a reservation.
Your broker checks its network of lenders, finds shares that are available to borrow, and offers to reserve them for you at a quoted price. If you accept, those shares are set aside so they're available when you decide to enter the short trade.
That's why every locate has three parts:
Confirmed borrow availability: the broker has found shares that can be borrowed.
A quoted per-share fee: the cost of reserving those shares.
Same-day validity: if you don't use the locate that day, it expires and you'll need a new one for the next trading session.
That confirmation is what satisfies U.S. short-selling regulations. The fee is simply what you pay to reserve that borrow, if applicable.
📌 ETB vs HTB Stocks
Not every stock is equally easy to borrow.
Big, liquid companies are usually easy to borrow (ETB) . There are plenty of shares available, so the locate is often instant. In many cases, it costs very little, or nothing at all.
Hard-to-borrow (HTB) stocks are different.
Lots of traders want to short them, but only a limited number of shares are available to borrow. That shortage pushes locate fees higher, especially in fast-moving small-cap stocks.
One important thing to remember is that locate pricing isn't fixed.
It's driven by supply and demand in the securities lending market. A locate that costs just a few cents today could cost several times more tomorrow if more traders suddenly rush to short the same stock.
📌 The Four Stages of Every Short Locate
No matter which broker you use, every locate follows the same basic sequence.
Step 1: Request
Everything starts with a request.
You enter the ticker, choose how many shares you'd like to short, and submit the locate request.
Nothing has been reserved yet.
More importantly, nothing has been charged.
At this stage, you're simply asking your broker to see what's available.
Step 2: Offer
The broker then searches its network of securities lenders and comes back with an offer.
That offer usually includes two things:
the number of shares available
the per-share locate fee
Think of this as receiving a quote.
You're still under no obligation to proceed.
If the price looks too expensive, you can simply decline it and move on without paying anything.
Step 3: Accept the Offer
This is the step that catches many new traders off guard.
The moment you click accept , the locate fee becomes payable.
That's because you're paying to reserve access to those borrowed shares, whether you ultimately use them or not.
Step 4: Credit-Back or Expiry
Once the trading session ends, one of two things usually happens.
If your broker supports unused-locate credits, and the borrowed shares can be returned to the lending pool, you may receive a partial credit back.
If not, the locate simply expires.
Most brokers don't carry unused locates into the next trading day. If you still want to short that stock tomorrow, you'll need to request a completely new locate.*
Let's take a simple example.
Suppose you request a locate for 500 shares of a hard-to-borrow stock before the opening bell.
Your broker quotes $0.08 per share .
You accept the quote.
At that moment, you've committed to a $40 locate fee (500 × $0.08).
A few minutes later, the stock becomes too volatile, so you decide not to short it after all.
Even though no trade was placed, the $40 locate fee still applies because the borrow was already reserved when you accepted the quote.
📌 Short Locate vs. Hard-to-Borrow
These two terms are closely related, but they aren't interchangeable.
A hard-to-borrow (HTB) designation describes the stock .
It simply means borrowable shares are relatively scarce compared to current demand.
A short locate describes the process .
It's the request your broker performs before any short sale, whether the stock is easy to borrow or hard to borrow.
With an easy-to-borrow stock, the entire process often happens so quickly that you barely notice it.
With an HTB stock, the exact same process takes place, but the quoted fee is usually much higher, and there may not be enough shares available to satisfy every request.
Interestingly, that status can change surprisingly quickly. A stock that's easy to borrow today can become hard to borrow tomorrow if short interest spikes or available inventory dries up.
📌 Why This Matters Before You Click "Accept"
Once you understand how short locates work, that "accept" button means a lot more.
You're not just agreeing to a fee but deciding if the trade is worth paying for.
Before accepting a locate, experienced short sellers usually pause for a few seconds and ask themselves:
Am I actually going to trade this stock?
Is this setup good enough to justify the locate fee?
If I never take the trade, am I okay losing this money?
These questions can save you from a common beginner mistake i.e. paying for a locate and never using it.
📌 Final Thoughts
A short locate may seem like a small step but understanding it can save you money.
Remember the process: Request → Offer → Accept → Expiry.
The locate fee isn't the cost of opening a short trade, but the cost of reserving the opportunity to enter one.
Have a question about short locates we haven’t covered?
Drop it in the comments.
– Team TradeZero
*Refund eligibility for unused locates is subject to applicable terms, conditions, and operational requirement.
📌 Disclosure:
This communication is for informational and educational purposes only. It does not constitute investment advice, an offer to sell or a solicitation to buy any security or financial instrument mentioned, or a recommendation to follow any particular trading strategy.
Trading involves risk. Trading on margin is intended for experienced investors only, as losses may exceed the initial investment. Short selling is extremely risky and can potentially result in unlimited losses. Availability of locates is not guaranteed and may vary based on market conditions and security availability. Please refer to TradeZero's current pricing and locate terms for additional information.
TradeZero provides self-directed brokerage accounts to customers through its operating affiliates: TradeZero America, Inc. a United States broker dealer, registered with the Securities and Exchange Commission (SEC) and member of the Financial Industry Regulatory Authority (FINRA) and the Securities Investor Protection Corporation (SIPC); TradeZero, Inc., a Bahamian broker dealer, registered with the Securities Commission of the Bahamas; and TradeZero Canada Securities ULC, a Canadian broker dealer, member firm of the Canadian Investment Regulatory Organization (CIRO) and member of the Canadian Investor Protection Fund (CIPF); and TradeZero Europe B.V., a Dutch broker dealer, authorized and regulated by the Netherlands Authority for the Financial Markets (AFM) and subject to the regulatory framework of the European Securities and Markets Authority (ESMA) under MiFID II (collectively, the "TradeZero Broker Dealers").
This article was provided by TradeZero to TradingView for publication pursuant to a commercial agreement.  Education
NVDA Is Back Above 231.39 After The 234.76 High Failed.NVDA Is Back Above 231.39 After The 234.76 High Failed.
NVDA is trading at 231.47, back above the 231.39 line it closed under on Friday, after printing a new high at 234.76 and giving the entire move back in one session. The 229.14 shelf held through that fade, so the structure under price is intact. Conviction is not confirming the recovery - both timeframes read neutral with live readings in the mid-40s, participation and extension conditions are empty on both, volume sits in the 1st percentile on the 4H, and the 4H still carries a high-swept flag from the failed high. Neutral.
Resistance: 232.48 - the level cleared Friday before the fade
Key resistance: 234.76 - the new high that did not hold
Current price: 231.47
Support: 229.14 - the shelf that held the fade
Key support: 227.11 - then 226.52 under it
Structural floor: 222.43 - deeper support
Two paths from here:
It holds 231.39 and works back toward the high. Clearing 232.48 and holding it reopens 234.76 and makes Friday's fade a one-session digestion. The shelf at 229.14 is the floor under that attempt.
It loses 229.14 and the failed high becomes the story. A close below the shelf opens 227.11 and 226.52, and the 234.76 print reads as an extension that could not hold. Below 229.14 the whole late-week push is given back.
The high is made and unheld, the shelf is intact, and conviction is flat on both timeframes with no volume behind the recovery. 232.48 to resume it, 229.14 to lose it.
Built with SYNTHESIS v3.3 | SOM / ACE / IMP / SYNTHESIS
Study, not financial advice. TSM: news flow leaning bullish — the net read
TSM did not get one story today, it got several, and they do not all point the same way. Weighed against each other — new against old, and tracking which ones have already faded:
++ ASML and TSMC plan bigger masks that could lower chipmaking costs - Stock Titan
++ Taiwan's TSMC building 25 chip and packaging plants this year as AI demand outruns supply - IntelliNews
+ ASML Wins Over TSMC, Samsung for New EUV Machines as AI Demand Surges - Bloomberg.com
14 stories were weighed in this window; the 3 carrying the most weight are listed.
Net read: +++ leaning bullish — top of our scale.
What this is: a measure of which way the *news* is leaning right now — not a promise about price. A read being right and a read still being worth taking are two different things: once price has travelled a long way from where the read was published, it is stretched, and a lean that is stretched is a no-chase rather than an invitation.
Weight is not fixed either. A fresh headline lands, the balance tips, and the net read can flip inside an hour — that shift is the part worth watching, not the first print.
I will post an update under this idea once the market has had time to speak, either way.
(Informational only — not financial advice, not a signal.)  Long
Long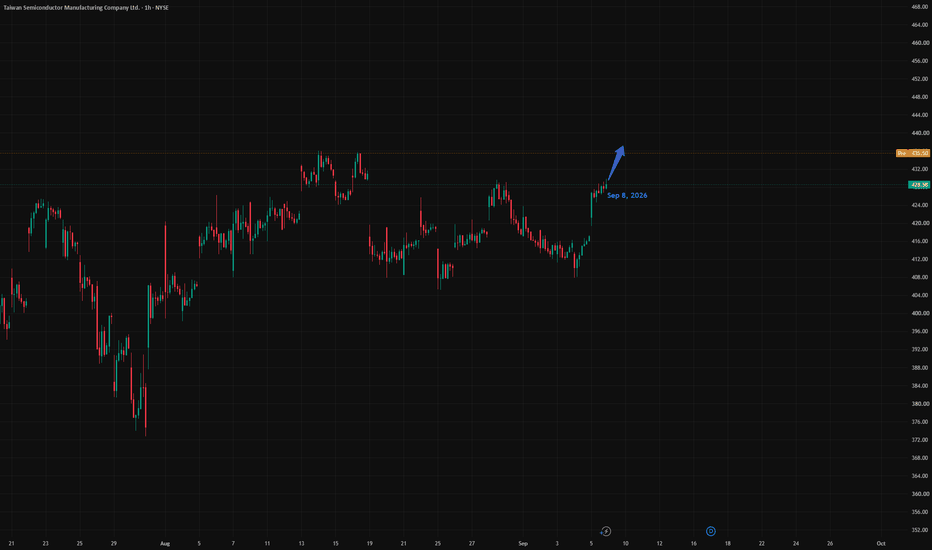
INTC TRADE IDEA 9/8/2026 BRADROC TRADING LLC INTC Trade Idea – September 8, 2026
INTC has been steadily climbing since September 1, including an $8+ move since Friday's trading session. She's showing strong momentum, but after a run like this I don't want to chase her. Let her prove she has more to give.
CALL IDEA
I'm waiting on a close above 100.35.
If buyers can break and hold above this level, look for possible TP levels:
101.61 → 102.80 → 103.61 → 104.17
If momentum stays strong, I wouldn't rule out a possible extension toward 105.
RANGE IDEA
After this run, it's not unlikely that INTC could run out of steam and spend some time between 95.90–100.35.
That's more than a $4 range, which could offer some clean scalp and day trade opportunities. Don't assume she has to break out today.
PUT IDEA
For puts, I'm watching 97–95.90 closely. This area could act as a strong support wall, so I'm not interested in getting overly aggressive while buyers are still defending it.
If sellers can break and hold below 95.90, look for a possible move toward 91.87.
I expect buyers to try and defend 91.87. If sellers win that battle and maintain momentum, possible TP levels become:
89.52 → 87.75 → 85.65
QUICK REFERENCE
CALL: Above 100.35 → 101.61 → 102.80 → 103.61 → 104.17 → possible 105
RANGE: 95.90–100.35
PUT: Below 95.90 → 91.87 → 89.52 → 87.75 → 85.65
:warning: Disclaimer
My goal is to keep these trade ideas simple for newer traders. Compare these levels with your own chart before entering any trade. This is not financial advice—it's simply how I see the market. Trading involves risk, so manage your risk, take profits along the way and trade responsibly.  Long
Long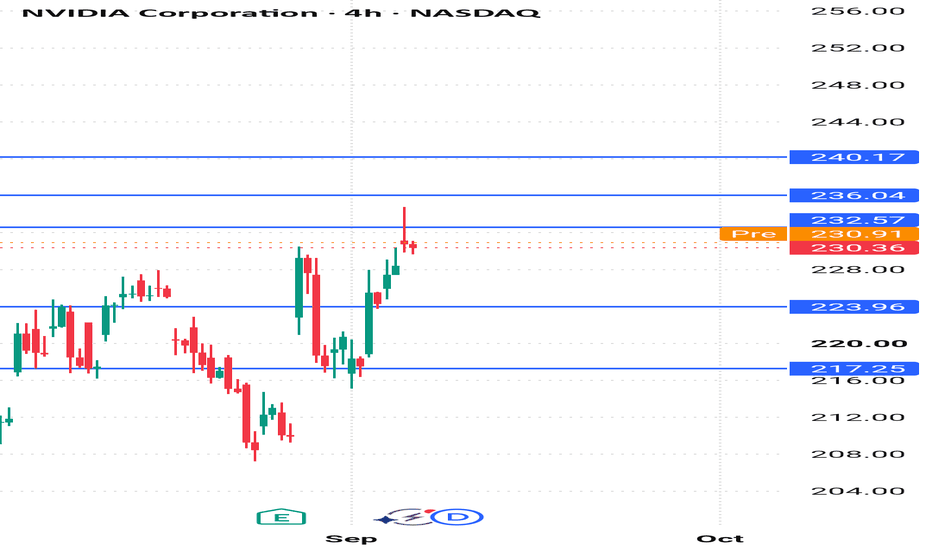
Long 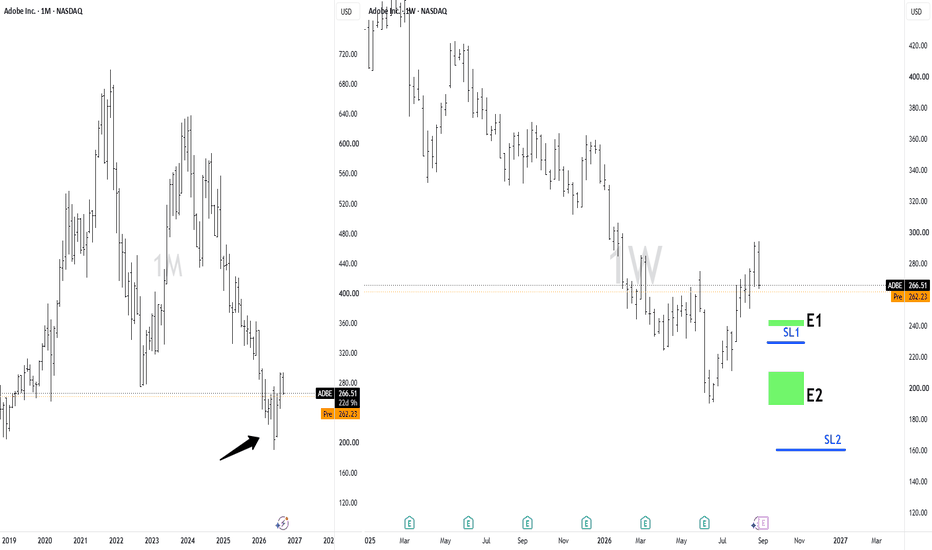
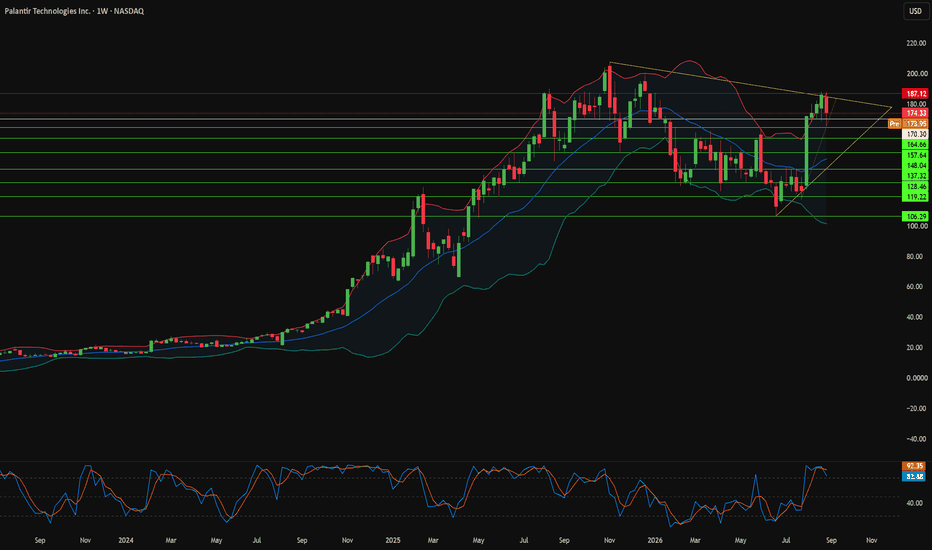
Is Palantir a Software Empire or a Consulting Firm?Palantir's market capitalization has surpassed $ 400 billion, with investors pricing in growth through 2032. The article argues that this multiple rests on narrative momentum rather than defensible economics. Elevated bond yields and persistent inflation compress speculative multiples, while higher discount rates erode the present value of distant cash flows. Michael Burry called the company an AI FOMO consultant and warned the valuation could fall below 100 billion dollars. The operating data supports the structural case. Palantir reports a deferred revenue-to-revenue ratio near 32%, compared with 80% to 207% among enterprise SaaS peers, and almost exactly matching Accenture's 31%.
The intellectual property analysis exposes the sharpest gap in the AI story. GreyB catalogs more than 3,800 global filings, with over 72% covering data analysis technologies and 62% covering digital data processing. Those patents protect database structures, user interfaces, and authorization controls, not foundational model architecture. Google DeepMind, by contrast, owns core patents in deep reinforcement learning, actor-critic networks, continuous control and neural compression. Palantir connects third-party foundation models to customer databases. It does not invent the algorithmic science that powers them.
Two recent developments attack the moat directly. Technologist Bilawal Sidhu built WorldView, a browser-based spy satellite simulator, in a matter of days using Google 3D Tiles, WebGPU rendering, and open-source intelligence feeds. A single engineer replicated the geospatial interface that Palantir long treated as untouchable. On the government side, Google launched Gemini 3.8 Flash Cyber for defense cybersecurity through its restricted Fairwind Program, claiming stronger performance at materially lower cost. Palantir shares fell 7% on the news, and institutional traders bought millions of dollars in protective puts.
Balance sheet detail reinforces the consulting profile. Accounts receivable climbed to 1.49 billion dollars, and one commercial customer holds 27% of that balance while contributing under 10% of recognized revenue. That imbalance hands the customer real leverage in any contract renegotiation. Nine billion dollars in net operating loss carryforwards shield federal cash taxes only temporarily, and heavy stock-based compensation dilutes holders over time. Morgan Stanley has downgraded the stock, and Alex Karp himself conceded that roughly 95% of enterprise AI pilots fail. As AI budgets rationalize, buyers will reprice expensive bespoke engineering work.  Short
Short