

NVIDIA — Are Bulls Ready to Challenge Resistance Again?Market Structure
NVIDIA remains in a bullish market structure on the 4-hour chart. After a sharp pullback from the recent high, buyers stepped back in around support, and price has formed another higher low. The current recovery suggests the broader uptrend remains intact.
Market Sentiment - Moderately Bullish
Buying momentum has improved following the recent correction. Although sellers remain active near resistance, the overall structure still favors the bulls as long as higher lows continue to hold.
Bullish Scenario
If price breaks above the 223 resistance area and establishes acceptance above it, bullish momentum could extend toward 228, with 232 becoming the next upside objective.
Bearish Scenario
If price fails to hold above 218, selling pressure could increase and push price back toward 212. A break below 212 would weaken the current bullish structure and suggest a deeper correction.
────────────────────
Market View
NVIDIA has recovered well after its recent pullback and is once again approaching an important resistance zone. The current price action reflects improving buyer confidence, but a confirmed breakout is still needed before expecting another leg higher.
────────────────────
Key Levels
First Resistance: 223
Second Resistance: 228
First Support: 218
Second Support: 212
────────────────────
Outlook
A sustained move above 223 would reinforce the bullish outlook and could open the door toward 228–232.
However, if price loses 218, a deeper pullback toward 212 may develop before buyers attempt another recovery.
────────────────────
Event Risk
NVIDIA may remain sensitive to broader Nasdaq performance, U.S. economic data, Treasury yields, AI-related developments, semiconductor sector news, and company-specific announcements. These factors could increase short-term volatility.
────────────────────
Please share your view below:
Do you think NVIDIA is ready to break above 223 and resume its uptrend, or will sellers trigger another pullback from resistance?
I'll continue sharing more Market Structure and Key Level updates.


Long ROADI have been researching this stock for a bit and wanted in but then it pushed to 120$ in short order. I’ve had a buy alert set to 95$. Looks like a double bottom on the weekly here.
Fundamental assumptions: 18% operating cash flow growth , 15 multiple, over five years = 110% upside from here as a pessimistic baseline. This is how I build models. Their operating cash flow since 2022 is 59% with an average multiple of 26.
 Long
Long
Alphabet Approaches a Major Resistance ZoneMarket Structure
Alphabet is recovering from its recent correction and has established a sequence of higher lows on the 4-hour chart. Price is now approaching a key resistance area around 350, where buyers and sellers are likely to compete for short-term control.
Market Sentiment - Moderately Bullish
Momentum has improved following the recent rebound, but price remains below a major resistance zone. Buyers currently have a slight advantage, although confirmation is still needed before a sustained breakout can be expected.
Bullish Scenario
If price breaks above the 350 resistance and holds above it, bullish momentum could accelerate toward 358, with 365 becoming the next upside target.
Bearish Scenario
If price fails to break above 350 and falls below the 342 support, selling pressure could increase and push price toward the 335 area. A break below 335 would weaken the current recovery structure.
────────────────────
Market View
Alphabet has recovered steadily from its recent lows and is once again testing an important resistance level. The current consolidation suggests the market is preparing for its next move. Whether buyers can clear resistance or sellers defend this area will likely determine the short-term direction.
────────────────────
Key Levels
First Resistance: 350
Second Resistance: 358
First Support: 342
Second Support: 335
────────────────────
Outlook
A confirmed breakout above 350 would strengthen the bullish outlook and could open the door toward 358–365.
However, if buyers lose momentum below 342, the recovery may pause and a deeper pullback toward 335 could develop.
────────────────────
Event Risk
Alphabet may remain sensitive to broader Nasdaq performance, U.S. economic data, Treasury yields, AI-related developments, and company-specific news. These events could drive short-term volatility.
────────────────────
Please share your view below:
Do you think Alphabet is ready to break above 350, or will resistance trigger another rejection?
I'll continue sharing more Market Structure and Key Level updates.


Microsoft — Is the Next Breakout Just Around the Corner?Market Structure
Microsoft remains in a bullish market structure on the 4-hour chart despite recent consolidation. Price continues to hold above higher lows after a strong rally, suggesting buyers remain in control while the market builds energy beneath resistance.
Market Sentiment - Moderately Bullish
Momentum has cooled after the recent advance, but the overall structure remains constructive. As long as key support levels continue to hold, buyers retain a slight advantage.
Bullish Scenario
If price breaks above the 500 resistance area and establishes acceptance above that level, bullish momentum could accelerate toward 510, with the previous high near 516 becoming the next upside objective.
Bearish Scenario
If price loses support around 488, short-term selling pressure could increase and expose the 480 area. A break below 480 would weaken the current bullish structure and suggest a deeper pullback.
────────────────────
Market View
Microsoft is trading within a healthy consolidation after a strong rally. Rather than signaling weakness, the current price action appears to be a pause as buyers and sellers battle near resistance. The next breakout from this range is likely to determine the market's short-term direction.
────────────────────
Key Levels
First Resistance: 500
Second Resistance: 510
First Support: 488
Second Support: 480
────────────────────
Outlook
A decisive break above 500 would reinforce the bullish trend and could open the door toward 510–516.
On the downside, a break below 488 may trigger a deeper correction toward 480 before buyers attempt to regain control.
────────────────────
Event Risk
Microsoft may remain sensitive to broader Nasdaq performance, U.S. economic data, Treasury yields, and AI-related news. These events could increase short-term volatility and influence the next directional move.
────────────────────
Please share your view below:
Do you think Microsoft is preparing for another breakout above 500, or will sellers force a deeper pullback first?
I'll continue sharing more Market Structure and Key Level updates.


Apple Extends Its Rally — Can Bulls Break Above the Recent High?Market Structure
Apple remains in a clear bullish market structure on the 4-hour chart, with higher highs and higher lows continuing to develop. Price has recovered strongly from the early September pullback and is now testing the previous swing high, placing the market at an important decision zone.
Market Sentiment - Bullish
Momentum continues to favor buyers as price trades near recent highs. While short-term profit-taking could occur around resistance, the overall trend remains constructive as long as higher lows are preserved.
Bullish Scenario
If price breaks above the recent high around 338 and holds above that level, bullish momentum could accelerate toward the 342–345 area, confirming continuation of the broader uptrend.
Bearish Scenario
If price fails to break higher and falls below the 330 support area, selling pressure may increase, exposing 323 as the next downside support. A break below that level would weaken the current bullish structure.
────────────────────
Market View
Apple continues to outperform with buyers maintaining control after a strong recovery. The recent consolidation beneath resistance suggests the market is preparing for its next directional move. A confirmed breakout would strengthen the bullish outlook, while rejection at resistance could trigger a healthy pullback.
────────────────────
Key Levels
First Resistance: 338
Second Resistance: 342
First Support: 330
Second Support: 323
────────────────────
Outlook
A sustained move above 338 could open the door toward 342–345 as buyers attempt to extend the rally.
On the downside, losing 330 would likely trigger a deeper correction toward 323 before buyers attempt to regain control.
────────────────────
Event Risk
Apple may remain sensitive to broader Nasdaq performance, U.S. economic data, Treasury yields, and upcoming company-related news. Increased volatility around these events could influence short-term price action.
────────────────────
Please share your view below:
Do you think Apple is ready to break into new highs, or will resistance trigger another pullback first?
I'll continue sharing more Market Structure and Key Level updates.


NVDA — Bearish setupMarket view: Bearish below the $223–224 area.
NVDA recovered sharply after trading near $209 earlier in the week, but Friday’s price action pushed back into a clear double-top / FVG resistance zone around $223–224. At the same time, the broader market was dealing with the BOJ rate hike, elevated Treasury yields and triple-witching expiry, which can create exaggerated moves around major levels.
There is also a fundamental tug-of-war: Nvidia's outlook remains strong, but AI-development concerns recently triggered a temporary chip-sector selloff before the rebound.
Trade plan from the chart:
* Entry: $222.50–$223.80 on bearish confirmation
* Invalidation: Sustained break/close above $224
* TP1: $218
* TP2: $214
* Main target: $203.50–204
* Risk: Avoid chasing if price breaks above the FVG and starts accepting above $224.
The key reaction I'm looking for is simple: does $223–224 reject price again, or does NVDA finally reclaim that area? A clean rejection followed by a break of the rising intraday trendline would strengthen the short scenario. If buyers reclaim the FVG and hold above it, I'd abandon the bearish idea rather than force it.
Today's drivers
The BOJ raised rates on Friday, pushing Japanese borrowing costs higher, while U.S. markets simultaneously dealt with quarterly triple-witching, which can increase short-term trading activity and volatility.
NVDA itself also has fresh fundamental attention: CEO Jensen Huang said Nvidia expects to double chip sales next year, while the company continues to sit at the center of the AI-infrastructure trade.
So I wouldn't treat this as a pure technical short. The catalyst environment can easily produce a liquidity sweep above $223 before the real direction appears.
This is where the setup becomes particularly useful with clear price action ( ). NVDAUSDT stock futures trade 24/7, so the setup doesn't simply disappear when Nasdaq closes.
rNVDA is also supported, a tokenized NVIDIA exposure, with selected stock tokens available as margin; eligible rTokens can also receive dividend distributions where applicable.
For the weekend, I'd keep two scenarios marked:
🔴 Bearish: rejection from $223–224 → lose $218 → $214 → potentially $203.5.
🟢 Bullish invalidation: reclaim $224 and hold it → the double-top thesis weakens and I'd watch for continuation toward the next higher liquidity area rather than forcing the short.
Short
NVDA Breaks the Mid-Range — Is $230 Next?Last time, I marked $212–215 as the key middle zone between NVDA’s broader $190–230 range .
Friday changed the picture.
NVDA pushed through that zone and closed around $222, putting the upper end of the range back on the radar.
What makes the move more interesting is the timing: Friday was triple witching, while the market was also digesting the latest BOJ decision and renewed AI-infrastructure catalysts. With so much potential noise, I’m more interested in whether the breakout survives than in the initial move itself.
My levels are simple:
$225 → first test
$230 → range high
$236 → previous high
The key remains $212–215 . If this area holds as new support, the range structure starts to look very different. If NVDA falls back below $212, Friday’s breakout becomes much less convincing.
I’m not chasing the candle. I’m watching the retest.
For traders following this setup, having a way to monitor and trade supported U.S. stocks beyond regular market hours can be useful when these levels are tested overnight.
The range gave us the map. Now NVDA has to prove the breakout.
Long
Bullish potential detected for TXNEntry conditions:
(i) higher share price for NASDAQ:TXN along with swing up of indicators such as DMI/RSI.
Depending on risk tolerance, the stop loss for the trade would be:
(i) below the rising yearly VWAP (currently $254.84), or
(ii) below the recent swing low of $248.13 from 3rd September.
 Long
Long
COIN | Weekly Structure | $160-$170 Add Zone Held PerfectlyThesis:
In my previous COIN idea, published at the end of August, I identified the $160-$170 area as my preferred add zone.
This week, COIN traded down to $160.50, almost exactly into that area, before bouncing strongly. I used that pullback to add to my existing position. My copiers can now benefit from the bottom of the range.
The setup has therefore developed almost exactly as expected.
The focus now shifts from accumulation back to confirmation, with the 200-week MA around $185 and the 50-week MA around $210 becoming the next important levels.
My larger targets remain unchanged.
Context
- Weekly timeframe
- This is a direct follow-up to my previous COIN analysis
- The previous idea identified $160-$170 as my preferred add zone
- This week's low was approximately $161.18
- I used that move to increase my existing position
- My current average is approximately $158
- The overall position is currently around 23% in profit
- The addition made this week is already around 17% in profit
- COIN remains part of my broader long-term exposure to digital assets and the tokenization of financial markets
What I see
- The larger ABC correction appears to have completed around the major support structure
- Price reached the $160-$170 accumulation area almost perfectly
- The reaction from that zone has been strong
- COIN is now back around the 200-week MA near $185
- The next important dynamic resistance is the 50-week MA around $210
- The long-term structure remains consistent with the larger Elliott Wave count shown on the chart
- Nothing in the current price action changes my higher-degree targets
What matters now
- The $160-$170 area has done its job as an accumulation zone
- Approximately $185 is the first important level to hold
- The 50-week MA around $210 is the next major technical test
- A clean reclaim and hold above that area would strengthen the case that the next impulsive phase is developing
- Major structural support remains much lower around $139
- As long as the larger structure remains intact, I continue to treat weakness as part of the accumulation process rather than a change in the long-term thesis
Buy / Accumulation zone
- My preferred add zone was $160-$170
- COIN traded down to approximately $161 this week
- I added to the position in that area
- My current average is approximately $158
- I prefer adding during technically defined pullbacks rather than chasing strength
- After the current rebound, I am not looking to chase the move
- The opportunity I was waiting for was the pullback into the previously identified zone, and the market delivered it
Targets
- 200-week MA: approximately $185
- 50-week MA: approximately $210
- Primary Wave I target: approximately $400-$411
- Major ATH resistance is also located around this area
- A later Wave II retracement would be expected after completion of that move
- Primary Wave III target: approximately $800-$825
- Ultimate long-term target remains approximately $950
Portfolio note
This is exactly why I want to keep a public record of these analyses.
At the end of August, I identified the $160-$170 area before price reached it.
This week, COIN traded down to approximately $160 and gave me the opportunity to add to a position that was already profitable.
The broader position is currently around 23% in profit, while the latest addition is already around 17% in profit.
The important point is not that every level will always work this cleanly.
The process is what matters: define the area in advance, wait for price to come to you, and act when the technical structure and the long-term thesis remain aligned.
The accumulation zone has now been tested.
From here, I am watching the 200-week MA around $185 and then the 50-week MA around $210.
If those levels are reclaimed and held, my larger targets remain approximately $400, $800 and ultimately $950.
 Long
Long
ZS: W-Bottom Breakout — Zero Trust the Pop, Wait for RetestStory:
📊 The Pattern
Zscaler carved out a textbook W-bottom after the brutal drop from its high of $336, down to ~$120 during the 2026 selloff. The neckline lines up almost exactly with the weekly 200EMA (~$188-191) — the same average that flipped from support to resistance on the way down.
⚡ The Breakout
This week's candle reclaimed the 200EMA and closed decisively above the neckline, ~20% on the week, and volume stepped up on the move — real participation, not a low-volume spike.
⚠️ Why Wait
Strong overhead resistance sits at $217-218 , just above the breakout close — the ceiling of the 2024-2025 base. Chasing this candle means buying into resistance with a wider stop. A pullback/retest of the reclaimed neckline (~$190-191) offers a tighter stop and meaningfully better risk/reward than buying strength here.
🎯 Levels to Watch
🟢 Neckline / add zone: ~$190-191 (old resistance, now potential support)
🛑 Invalidation: below $159 (why this deep) because it left a gap near 165 that it might revist and provide an even better entry.
🔴 Resistance 1: $217
🔴 Resistance 2: $249
🏔️ Eventual target if the pattern completes: retest of the ~$335 high
🧠 The Plan: No chase — waiting for the market to come back and prove the neckline holds before adding. Patience over FOMO.
Chart study, not financial advice.
 Long
Long
AMSC: Bullish Candle at Weekly EMA200 Confluence🧱 The Structure
AMSC has been building a base right on top of the rising trendline and weekly EMA200 confluence — the same zone that's absorbed pullbacks since the 2025. Price is now pressing back up off it, keeping the higher-low sequence intact.
⚡ The Setup
This is the tactical trigger for the bigger picture: on the monthly chart, AMSC is coiling under a trendline that's capped every major rally since 2008. This weekly base is the mechanism that could carry price into that historic confluence zone — long as long as the $27 floor holds.
🎯 Trade Plan
🟢 Entry / current zone: ~$30
🛑 Stop / invalidation: below $27.00
🔹 Target 1: $35.00
🔹 Target 2: $45.4
🔺 Eventual target: retest of the descending multi-year trendline (moving target — see monthly idea)
📐 Risk/Reward
Risk to stop: ~$3.19 (≈10.6% from current price)
Reward to Target 1: ~$4.81 → R:R ≈ 1.6 : 1
Reward to Target 2: ~$15.30 → R:R ≈ 4.8 : 1
If goes all the way to 45, it will be a decent ~49% move.
⚠️ Invalidation: A weekly close below $27 breaks the structure and points to another leg lower inside the range rather than continuation.
Chart study, not financial advice. Position size for the $27 stop, not for the optimistic target.
 Long
Long
AMSC: The 15-Year Ceiling Is Finally Being TestedLong Term Story:
📈 The Setup
American Superconductor peaked at ~$480 in 2008, made a lower high near $440 in 2010 (double-top distribution 🔻🔻), then collapsed over 95% into a dead, 13-year sideways base that most traders forgot existed.
🔋 The Wake-Up
Since 2023, volume has come back to life for the first time in over a decade 📊, and price has been grinding higher off that long base — something this stock hasn't done since the bubble years.
⚠️ The Squeeze
Here's the real story: the descending trendline connecting the 2008 and 2010 highs is now converging with the top of the 2011-2026 consolidation range. Two attempts to break through (🔻 marked on the chart) have already failed. The gap between falling trendline resistance and the range ceiling is shrinking — a coil that's been over a decade in the making.
👀 Levels to Watch
🔺 Resistance / breakout trigger: the trendline + range-top confluence zone (confirm exact value on the chart — it's tightening month to month as the trendline descends)
🔻 Structure support: the recent higher-low base built since 2023-2024
✅ Confirmation: a monthly close above the confluence zone, ideally on expanding volume
❌ Invalidation: a third rejection here keeps this a 15+ year range, not a breakout
🧠 Why it matters: A clean break above this level would be the first time since the 2008 bubble that AMSC has closed above the trendline that capped every major top since. That's not a minor technical event for a stock this dormant.
I will be posting a closeup weekly view, why I think AMSC is going to make another breakout attempt.

TSM | Continued stock growth- Timeframe: Weekly
- Trade type: Buy stop order
- Price: 434.82
- Take Profit: Open
- Stop Loss: 412.55 (-5.10 %)
Idea: Long on a breakout above last week's high - bullish momentum continuation.
Entry: Buy stop above last week’s high.
Stop-loss: Below the low of the same candle.
If the weekly candle closes below this level, the trade is invalidated.
 Long
Long
KTOS | Continued stock growth- Timeframe: Weekly
- Trade type: Buy stop order
- Price: 49.46
- Take Profit: Open
- Stop Loss: 45.72 (-7.60 %)
Idea: Long on a breakout above last week's high - bullish momentum continuation.
Entry: Buy stop above last week’s high.
Stop-loss: Below the low of the same candle.
If the weekly candle closes below this level, the trade is invalidated.
 Long
Long
RTX | Continued stock growth- Timeframe: Weekly
- Trade type: Buy stop order
- Price: 197.67
- Take Profit: Open
- Stop Loss: 191.18 (-3.30 %)
Idea: Long on a breakout above last week's high - bullish momentum continuation.
Entry: Buy stop above last week’s high.
Stop-loss: Below the low of the same candle.
If the weekly candle closes below this level, the trade is invalidated.
 Long
Long
LMT | Continued stock growth- Timeframe: Weekly
- Trade type: Buy stop order
- Price: 542.61
- Take Profit: Open
- Stop Loss: 520.42 (-4.10 %)
Idea: Long on a breakout above last week's high - bullish momentum continuation.
Entry: Buy stop above last week’s high.
Stop-loss: Below the low of the same candle.
If the weekly candle closes below this level, the trade is invalidated.
 Long
Long
ORCL | Continued stock growth- Timeframe: Weekly
- Trade type: Buy stop order
- Price: 152.00
- Take Profit: Open
- Stop Loss: 139.00 (-8.60 %)
Idea: Long on a breakout above last week's high - bullish momentum continuation.
Entry: Buy stop above last week’s high.
Stop-loss: Below the low of the same candle.
If the weekly candle closes below this level, the trade is invalidated.
 Long
Long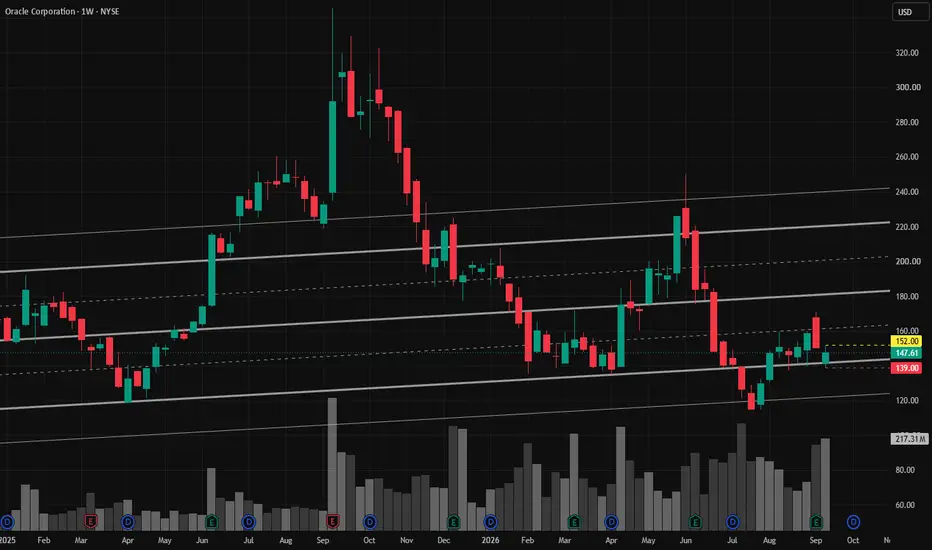
NXT | Continued stock growth- Timeframe: Weekly
- Trade type: Buy stop order
- Price: 84.23
- Take Profit: Open
- Stop Loss: 76.72 (-8.90 %)
Idea: Long on a breakout above last week's high - bullish momentum continuation.
Entry: Buy stop above last week’s high.
Stop-loss: Below the low of the same candle.
If the weekly candle closes below this level, the trade is invalidated.
 Long
Long
TTMI | Continued stock growth- Timeframe: Weekly
- Trade type: Buy stop order
- Price: 120.70
- Take Profit: Open
- Stop Loss: 109.94 (-8.90 %)
Idea: Long on a breakout above last week's high - bullish momentum continuation.
Entry: Buy stop above last week’s high.
Stop-loss: Below the low of the same candle.
If the weekly candle closes below this level, the trade is invalidated.
 Long
Long
Drones & AI | Why Is UMAC Becoming a Major Drone Warfare Stock ?Most people have a Hollywood scenario in their minds about WW3, countries using nukes on each other, while some billionaire like Peter Thiel buys remote islands and prepares for doomsday!
But the truth is, we are already seeing what many describe as a new era of global conflict, involving the U.S., Israel and European countries on one side and Russia, China and Iran on the other. Yet nukes are not the super weapon most people think they are. Drones are.
Drones are one of the most advanced technologies of modern warfare, working hand in hand with AI, and in many situations they can be far more practical and effective than nuclear weapons.
That is why investors should be paying closer attention to the companies building the drone supply chain, and UMAC is one of the names worth watching
Unusual Machines is starting to look less like a small hobby drone company and more like a developing U.S. drone supply chain play. The company’s latest second quarter 2026 earnings report showed just how quickly that transition is happening. Revenue jumped 687% year over year to $16.7 million, while sales more than doubled from Q1, marking 106% sequential growth. The biggest shift was in customer mix, with enterprise customers generating about 95% of Q2 revenue
📈 Revenue Is Moving Much Faster Than Profits
The strongest part of the earnings report was clearly the top line, but profitability is the metric investors still need to watch. UMAC posted a GAAP net loss of $7.8 million, or $0.16 per share, although that was an improvement from the $0.32 loss per share a year earlier..
More importantly, adjusted EBITDA loss narrowed sharply to around $400,000 from $1.6 million in Q1, suggesting the business is getting closer to operating leverage as revenue scales. Gross margin was 34.7%, down from 37.4% a year earlier as the company ramps domestic manufacturing, shifts toward enterprise sales and absorbs near term infrastructure costs
🛡️ Defense Demand Could Be the Bigger Catalyst
UMAC’s opportunity goes beyond selling components to hobbyists. In April, the company announced a $5 million-plus order from Powerus for U.S made components used in counter-UAS interceptor systems and 10 inch class drones. The company also says multiple products are U.S.-made and NDAA compliant, with products approved for the Blue UAS Framework. In its August investor presentation, UMAC highlighted the Pentagon’s Drone Dominance initiative and increasing demand for domestic drone supply chains as major potential catalysts. Management said it expects the market to remain so strong that the company may not be demand-limited through 2027
🏭 Cash Gives UMAC Room to Scale
Another important point from the quarter is that UMAC is aggressively building capacity before demand fully arrives. Headcount increased from 141 employees at the end of Q1 to 240 at the end of Q2, with more than 255 employees by August. The company ended June with roughly $229.6 million in cash, and it raised another $60 million at $30 per share through its ATM facility during Q2
UMAC is also moving to acquire Upgrade Energy, a battery and power-systems business for unmanned aerial systems, in a transaction valued at approximately $52 million. That could broaden UMAC from drone components into batteries and power systems, although the integration and additional operating costs will need to be monitored
⚠️ The Opportunity Comes With Real Risks
The numbers are impressive, but UMAC is still a highly speculative growth stock. The company remains unprofitable, gross margins are under pressure during the manufacturing ramp, and operating expenses are rising as it expands rapidly. Customer concentration is another factor to watch because its largest customer represented about 42% of Q2 revenue. There is also dilution risk from equity financing and stock based compensation. Management believes it can reach cash flow positivity by the end of Q1 2027, but that remains a forward-looking target rather than an achieved result.
For investors, the next earnings reports will be about whether UMAC can turn this extraordinary revenue growth into sustainable margins and eventually consistent profitability.
 Long
Long
HON | Continued stock growth- Timeframe: Weekly
- Trade type: Buy stop order
- Price: 210.59
- Take Profit: Open
- Stop Loss: 196.98 (-6.50 %)
Idea: Long on a breakout above last week's high - bullish momentum continuation.
Entry: Buy stop above last week’s high.
Stop-loss: Below the low of the same candle.
If the weekly candle closes below this level, the trade is invalidated.
HLong

CORZ | Continued stock growth- Timeframe: Weekly
- Trade type: Buy stop order
- Price: 18.03
- Take Profit: Open
- Stop Loss: 16.01 (-11.20 %)
Idea: Long on a breakout above last week's high - bullish momentum continuation.
Entry: Buy stop above last week’s high.
Stop-loss: Below the low of the same candle.
If the weekly candle closes below this level, the trade is invalidated.
 Long
Long