• Products
  • Community
  • Markets
  • Brokers
  • More
Get started
  • Markets
  • /USA
  • /Stocks
  • /Ideas
Could this be E-Lie Lilly? Institutions Just Showed Their Hand!There's an old saying we have in the South..."A lie doesn't care who tells it." That just simply means that when a lie wants to get out and be believed as truth, it doesn't care what method is used to accomplish that. Over the years, I've made my own addition to that..."A lie doesn't care who tell it, but it has its favorites". By that, I mean that some people (or institutions, systems, etc.) seem to be the chosen favorites to spread a lie. And I've come to learn in the trading world, that Market Makers are the #1 favorite choice of the Father of Lies. Right now, I think that's exactly where a lot of traders find themselves with Eli Lilly. The story being told is "don't worry, this is just another pullback." Well...that's not what the chart has been telling us. A couple of weeks ago, we pointed out the first major clue when Eli Lilly broke structure on the H1 chart. At the time, we expected price to work its way down into the H1/H4 Fair Value Gap around $1,145-$1,150, eventually reaching the H4 Demand Zone between $1,127 and $1,133. That's exactly what happened. And, now the conversation has changed. Why? Because this is no longer just an H1 setup anymore. The H4 has now produced its own Break of Structure, and more importantly, the Daily chart has joined the party. That's a much bigger deal! On the Daily chart, the market broke its Demand Zone on July 13, and since then we've watched price begin working its way back into that broken structure. That's exactly what I expect to see when institutions are rebalancing positions before making their next decision. Now comes the question you should be asking when these seemingly bullish bounces. Is this really a recovery... or is it simply a Return to the Source to confirm the bearish Break of Structure. Those are two very different things. This Return to the Source could push LLY back into this Daily Demand Zone or even back as high as the BOS Supply Source, BUT, If sellers defend this retest, the fall will likely continue. The next area I'm watching is the Daily Fair Value Gap, which sits around $965-$975. There is also an internal area around 1080 - 1100 that could temporarily hold this up until Earnings. I have that marked as possible, but not likely. If that imbalance is compromised, then the larger institutional objective becomes the Daily Demand Source between approximately $850 and $870. Wow! That's a long way from where we are today, and a Big Fat Whopping Lie away from where the market wants us to think it is going. Now, am I saying the market has to go there? Absolutely not. Markets don't owe us anything. What I am saying, though, is that the structure has changed, and when structure changes, my expectations change with it. So, could buyers prove me wrong? Of course...but it has to be structural, and not hopeful expectations. If bulls can reclaim the broken Daily Demand Zone (get a daily close back up above ~$1215) and eventually push back into the Daily BOS Supply Source with convincing closes, then I'll gladly reassess the bearish outlook. But until then, every rally has to be viewed through a different lens. Not as proof that the bulls are back...But as a possible institutional retest before another leg lower. I would expect for this coming week to show us some twists and turns inside of these already identified areas, mostly with the purpose of trapping over-anxious buyers and option chasers who don't understand that the trap has been set. One of the biggest mistakes traders make is confusing a bounce with a reversal. Those aren't the same thing. Price doesn't move because we hope it will. Price moves because institutions reposition capital. Our job is simply to recognize when they're leaving footprints and act on it. Reading those footprints are never a guarantee of course, but most of the time, they tell enough of the story to expose the Lie, and get you out of trouble! What do you think? Is Eli Lilly building a base for another run higher... Or is this simply a pause before the next move down? If this helped you in any way, please give us a like or boost and leave your comments. Follow @AkeelahTraders here on TradingView if you'd like to continue following this analysis as the story unfolds. And check out our other posts for more market insights.
NYSE:LLYShort
by AkeelahTraders
DPZ | Domino's Pizza Inc | Q3 2026 - Day Chart Domino's Pizza Inc - Engages in Pizza ---------------------------------- MARKET-BEATING SCORE = 2/10 Earnings coming in hot tomorrow. ----------------------------------- Multiple Time-Frame Analysis; Color Code | Strength favors the higher timeframe. Yearly timeframe = black Monthly timeframe = pink weekly = grey daily = red 4hr = orange 1hr = yellow 15min = blue 5min = green if they are shown. (Level visibility on intervals is set to timeframe the level was found on and below to keep chart view organized.) ** Candle Science explained ** A Range = two or more consecutive color candles. There are two types of ranges - accumulation and distribution. DISTRIBUTION RANGES DEFINED: When price is above a distribution range, these candles/levels act as support. (BS) BACKSIDE Candle - First distribution candle in a distribution range. Expectation = strong reaction to price. long wicks reaching to or away from level. (FS) FrontSide Candle - Last distribution candle in a distribution range. Expectation = reversal, create a trend in the opposite direction. Distribution candles are used as support. ACCUMULATION RANGES DEFINED: When price is below an accumulation range, these candles/levels act as resistance. INVERSE BACKSIDE (Inv.BS) - First Accumulation candle in an accumulation range. Expectation. = strong reaction to price. long wicks reaching to or away from level. INVERSE FRONTSIDE (Inv.FS) - Last accumulation candle in an accumulation range. Expectation = reversal, create a trend in the opposite direction. Accumulation candles are used as resistance.
NASDAQ:DPZ
by StudyGuideTA
$TSLA Time to BounceNASDAQ:TSLA time to bounce again... 3 gap downs in a row now printing a doji. Also tons of 380 puts being sold. $18 million 380P 10/16.
NASDAQ:TSLALong
by TJ01
Updated
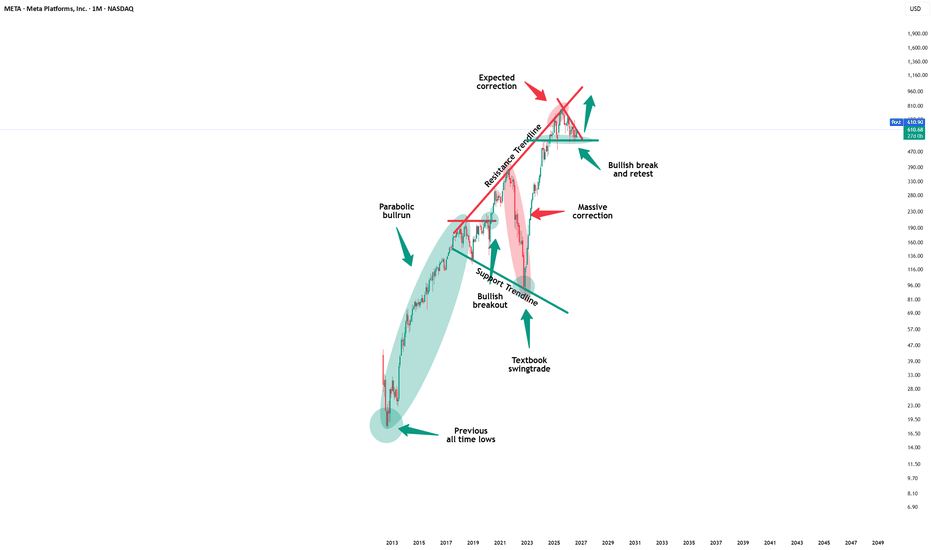
$META Filled the GapNASDAQ:META filled the downside gap at 637. Now it's printing a second doji in a row on the daily. Also calls just came in $3.5 million 700C for 3/19/27 in 2 orders 456 cons. Monthly BX finally flipped bullish as well.
NASDAQ:METALong
by TJ01
$SECZ , Idea SetupENTRY : CMP TP1 : ** TP2 : ** TP3 : ** TP4 : ** SL : If you wish ** FULL SETUP AVAILABLE** My SL is never a SELL, just an alarm to stop adding money and wait for better dca Follow, Boost, Join, Thank You ! ⚠️ Financial Disclaimer: This post is not financial advice. I am not your financial advisor, your life coach, or your legally responsible adult. Always do your own research and never trade based solely on internet comedy
SLong
by evolutionqc
Updated
AAPL Premarket Game Plan: Trap or Confirmation?AAPL is sitting below my PD-15 range premarket. Today's setup is all about whether buyers can reclaim control — or sellers keep pressing lower. PD-15 range = the previous day's final 15-minute candle. I use that high/low as a clean decision box for the next session. Today's PD-15 Levels: 334.40 = High 333.43 = Low Price is currently under the box, so buyers don't have clean control yet. I'm not forcing calls unless AAPL reclaims the range with strength. Bullish Plan: Reclaim 334.40 → break Opening Range High → retest → confirm with volume → watching 338.87, then 342.04. Bearish Plan: Lose 331.30 → watching 328.61, then 325.44. Key Levels: 334.40 — PD-15 High / reclaim level 333.43 — PD-15 Low 331.30 — breakdown level 338.87 — Call TP1 342.04 — Call TP2 328.61 — Put TP1 325.44 — Put TP2 Above 334.40, buyers have a chance. Below 331.30, sellers take control. Between the two, I'm staying patient. I'm not predicting. I'm waiting for agreement. YGO — Study the Levels. Wait for Agreement. Trade with Discipline. Full breakdown coming soon — this one's a fast one for the community to trade off of today. ⚠️ Educational purposes only, not financial advice. Do your own research and manage your own risk.
NASDAQ:AAPLShort
by tmac1914
MONDAY MAIN WATCH: $TSLANASDAQ:TSLA The short of it: B+H ⬆ 385.73 for calls B+H ⬇ 377.02 for puts The long of it: On one hand, we do have ER coming up on Wednesday fter the close so it is possible that we see chop/limited price action into that Wednesday session. On the other hand, though TSLA movement has been less volatile than usual the overall trend has been downward whether that be a slow grind down during the session or a gap down after hours/pre-market. With that being the case, I'm leaning more short than anything else here and really a clean break of the 377 level (even 380 with volume) could send us much lower today which would set us up really interesting ahead of earnings.
NASDAQ:TSLAShort
by itsfrankcobbs
LLY | Continued stock growth- Timeframe: Weekly - Trade type: Buy stop order - Price: 1,196.29 - Take Profit: Open - Stop Loss: 1,134.40 (-5.20 %) Idea: Long on a breakout above last week's high - bullish momentum continuation. Entry: Buy stop above last week’s high. Stop-loss: Below the low of the same candle. If the weekly candle closes below this level, the trade is invalidated. Take Profit: Trailing stop following the lows of new weekly candles.
NYSE:LLYLong
by Tired-Wolf
Is AI's Thirst About to Reprice the World's Water Stocks?The United Nations warns that the world has entered an era of global water bankruptcy. Four billion people already live under water stress, and AI data centers are projected to consume 9.3 trillion liters of water annually by 2030. That volume could cover the basic household needs of 1.3 billion people. Against this backdrop, Essential Utilities (NYSE: WTRG) trades at 20.1 times earnings, a clear premium to the global water utility average of 14.9. The company plans 1.4 billion dollars in infrastructure spending while PFAS cleanup mandates and regulatory pressure threaten that premium. Is the market underpricing the scarcest asset of the AI age, or overpaying for it? The technology layer is shifting just as fast. Conventional air cooling cannot handle heat fluxes above one kilowatt per chip, pushing operators toward liquid and immersion cooling in a market set to reach 27.1 billion dollars by 2035. The expiration of Asetek's seminal Pump-on-Block patent has unleashed royalty-free manufacturing of compact cold plates worldwide, reshuffling the competitive deck among Munters, IBM, and CoolIT. Meanwhile, water networks have become an active cyber battlefield. CISA and the FBI warned in April 2026 of Iranian-affiliated groups exploiting internet-facing utility controllers, China's Volt Typhoon maintains persistence inside US critical infrastructure, and May 2026 brought the first documented AI-assisted attack on a water utility, targeting Monterrey's network in Mexico. The geopolitical stakes may be highest of all. Ethiopia's completed Grand Renaissance Dam threatens to cut Nile flows to Egypt by up to 25%, and both nations are preparing militarily while rival Red Sea alliance blocs crystallize around them. The full analysis, with all data tables and sources, breaks down what this collision of compute, water, and geopolitics means for utility valuations.
NYSE:WTRGLong
by UDIS_View
Darvas Box Breakout?The market has been in a Darvas box pattern for some time. Based on Friday's candle, it appears we are at the bottom of this range. If buyers enter the market at the start of trading, there is potential for a 20% move to the top. This would be an interesting development, especially considering the upcoming CPI and PPI reports which could lead to a positive period for the market. The reasoning behind this setup is the potential for a breakout from the current range, which could indicate a shift in market sentiment. Not financial advice.
NASDAQ:OPENLong
by Stockguruvip
NEE | June, 2026 | Continued stock growth- Timeframe: Weekly - Trade type: Buy stop order - Price: 86.30 - Take Profit: Open - Stop Loss: 83.57 (-3.20 %) Idea: Long on a breakout above last week's high — bullish momentum continuation. Entry: Buy stop above last week’s high. Stop-loss: Below the low of the same candle. If the weekly candle closes below this level, the trade is invalidated. Take Profit: Trailing stop following the lows of new weekly candles. Feel free to like and share your thoughts in the comments! ❤️
NYSE:NEELong
by Tired-Wolf
Updated
EG (Everest Group) — Q1 2026 Underwriting Beat + $331M Buybacks **💡 EG (Everest Group) — Q1 2026 Underwriting Beat + $331M Buybacks in Reinsurance Powerhouse at Attractive 6.5x P/E** **SECTION 1 — Executive Summary** 💼 Everest Group delivered a strong Q1 2026 beat with adjusted operating EPS of $16.08 (well above consensus) and a disciplined 91.2% combined ratio despite lower gross written premiums from selective underwriting. As a leading global reinsurer it benefits from strong investment income $567M and share repurchases while trading at a compelling valuation amid industry tailwinds. **Overall rating: Strong Buy** **12-month price target: $385** (analyst consensus average from Yahoo Finance and Marketscreener as of June 5 2026) **Biggest reason to own:** Robust underwriting discipline record investment income and aggressive capital return at only 6.5x P/E with book value support. **Biggest risk:** Catastrophe losses or prolonged soft reinsurance pricing cycle. **SECTION 2 — Business Overview** 🏢 Everest Group is a global reinsurance and insurance provider delivering property casualty life and specialty solutions to clients worldwide. **Revenue breakdown (Q1 2026):** Reinsurance ~majority with diversification across property casualty and specialty lines (exact segment percentages not publicly broken out in Q1 release). **Business model:** Earns premiums on reinsurance contracts invests float for high net investment income and returns capital via buybacks and dividends with disciplined risk selection driving underwriting profit. **Competitive moat:** Scale global diversification strong balance sheet and proven underwriting track record that allows it to navigate cycles better than smaller peers. **SECTION 3 — Financial Deep Dive** 📈 **Key metrics (Q1 2026 cited from company release April 29 2026 and Yahoo Finance June 5 2026):** Revenue $4.07B (down YoY) Net income $653M ($16.21 diluted) Adjusted operating income $648M ($16.08 EPS beat) **Year-over-year growth:** EPS strong beat combined ratio improved but gross written premium -18.5%. **Balance sheet health:** Shareholders equity ~$15.5B (year-end 2025 updated) debt-to-capital 14.3% very healthy. **Cash flow quality:** Strong with positive underwriting income and investment returns. **Capital allocation:** Repurchased $331M shares in Q1 declared $2.00 quarterly dividend (payable June 26 2026). **SECTION 4 — Growth Analysis** 🚀 **Total addressable market (TAM):** Global reinsurance market remains large and resilient with pricing firming in select lines (industry data 2026). **Current market share and trajectory:** Leading global player with focus on selective growth and risk management. **Key growth drivers next 3–5 years:** Improved reinsurance pricing investment income and capital deployment in a normalizing cat environment. **Management guidance vs. analyst consensus:** No formal full-year guidance provided but Q1 beat supports positive outlook. **Growth organic:** Primarily organic with disciplined underwriting rather than aggressive premium chase. **SECTION 5 — Valuation** 📊 **DCF analysis :** Conservative assumptions on premium growth and investment yields support $385+ fair value aligned with consensus. **Comparable company analysis:** Trades at attractive discount to reinsurance peers on P/E and P/B. **Historical valuation range (5-year):** Currently near lower end offering value. **Bull / Base / Bear price targets:** Bull $470 (strong pricing and low cats) Base $385 (consensus) Bear $300 (higher cat losses or soft market) **Current price (~$320–$334) vs. each target:** 15–20%+ upside to base. **SECTION 6 — Risk Analysis** ⚠️ 1. **Catastrophe losses (medium probability high impact):** Major events trigger watch quarterly results. 2. **Reinsurance pricing softness (medium medium):** Competitive pressure on rates. 3. **Investment portfolio volatility (medium low):** Interest rate or credit risk. 4. **Macro economic slowdown (low medium):** Impacts client demand. 5. **Regulatory or reserve development (low low):** Watch reserve releases. Short interest low. No accounting quality flags. **SECTION 7 — Catalyst Calendar** 📅 **Next earnings:** July 29 2026 (Q2 2026). **Upcoming events:** Dividend payment June 26 2026 ongoing share repurchases. **Macro events:** Interest rate environment and insurance industry cat activity. **12-month timeline:** Q2 earnings capital return updates and potential pricing commentary. **SECTION 8 — Technical Analysis** 📈 **Primary Chart: Daily timeframe 1-year view** **Key observations and levels:** Stock has pulled back but holding key support zones. Price action relative to 50-day and 200-day moving averages shows value territory. RSI neutral MACD stable with volume supportive on up days. Major support $300–$310 resistance $360–$370. **Technical implication for the near-term catalyst:** Attractive risk/reward setup ahead of Q2 earnings with room for rebound on continued capital return. **SECTION 9 — The Verdict** 🏆 **Bull case ($470 30% probability):** Favorable pricing low cats and continued buybacks. **Base case ($385 55% probability):** Steady execution and investment income delivery. **Bear case ($300 15% probability):** Higher than expected cats or pricing pressure. **Expected value calculation:** Probability-weighted target ~$395. **Final recommendation with conviction level: Strong Buy with High conviction.** **The 30-second elevator pitch:** Everest Group posted a strong Q1 EPS beat with disciplined underwriting and aggressive buybacks yet trades at only 6.5x P/E — a rare value opportunity in a high-quality global reinsurer with solid capital return and industry tailwinds. **Sources** Everest Group Q1 2026 Earnings Release (April 29 2026) investors.everestglobal.com Yahoo Finance EG quote financials and analyst targets (as of June 5 2026) StockTitan and company press releases (May–June 2026) Marketscreener analyst consensus (June 2026) What are your thoughts on EG? Drop them below 👇 #EG #EverestGroup #Reinsurance #EarningsBeat #ValueInvesting #InsuranceStocks #BuyTheDip #Dividends #ChartOfTheDay
NYSE:EGLong
by DCAlpha
Updated
Netflix And Chill... Until The Buy Zone!Netflix topped in 2022 out of a diagonal — a reversal pattern that appears at the end of a trend. The drop that followed was sharp and fast, which is exactly how diagonals resolve. From that low, price built a clean five-wave impulse into the 2026 high. That impulse is complete, and Netflix is now correcting it. The correction is a simple ABC. Wave (A) dropped, wave (B) retraced into the 0.618, and wave (C) is now driving price lower into the buy zone. The buy zone is where it gets interesting. The 0.382–0.5 retracement of the entire impulse lands directly on the long-term trendline that has held since 2018. Two independent levels pointing at the same area. Once wave (C) completes there, the next impulsive leg higher begins. Targets - Take Profit 1: $134 - Take Profit 2: $236 Plan - Wait for price to reach the buy zone - Watch for wave (C) to complete - Trendline break confirms the entry Goodluck and as always, trade safe!
NASDAQ:NFLX
by WicktatorFX
AAPL | July 20 | Volatility & Entry PointsIn today’s Apple (AAPL) review, I start with the higher timeframes to understand the broader market structure before looking for possible entry points. A major focus of this review is volatility. When price is moving quickly, it can be tempting to chase the market, but increased volatility can also create wider price swings, false breakouts, and less favorable entries. Instead of reacting to every candle, I look for price to reach a meaningful area and provide confirmation. In this video, I cover: Using higher timeframes to establish market context Understanding how volatility affects risk and trade execution Identifying potential entry points around key levels Avoiding entries based on fear of missing out Waiting for price action to confirm the trade idea The goal is not simply to find an entry. It is to find an entry that fits the larger market context and provides a clear level for managing risk. As always, the focus remains on confirmation over prediction. Dad Joke of the Day: Volatility asked me to chase the market, but I told it I don’t run without a good entry point.
NASDAQ:AAPLShort
05:43
by davekclinton76
Cash Secured Puts 90$ Strike Oct 16Right now spacex is in a strong downtrend trying to find a bottom. Put premium are expensive giving an opportunity for cash secured puts. High probability for some time and volatility decay. I expect some short covering or some sideways move in the coming weeks which can erode these high premiums. Will consider taking delivery of shares in case the stocks slips below 90$
NASDAQ:SPCX
by sudeepvjn
NVDA - Eh... Options Trade? Week of July 20NVDA is still chopping around the mid-range after failing to fully reclaim the recent selloff trendline, with price hovering near the 200-202 area. The chart shows a clear pivot zone between 200 and 212, while 192 and 181 remain the more important downside support levels if momentum rolls over. I've mapped out three scenarios for the coming sessions: 🟢 Bullish Scenario If NVDA can hold above 200 and reclaim 212, that opens the door for a move back toward 225 and possibly a retest of the 236.58 ATH. A clean breakout above the descending trendline would confirm that buyers are finally taking control. 🔴 Bearish Scenario If price loses 200 and starts accepting below 192, the next likely magnet is 181. A breakdown through that zone would signal the sideways structure failed and sellers regained control. 🟡 Sideways Scenario (My Lean) This is the scenario that frustrates everyone. NVDA could continue chopping between 192 and 212, with repeated wicks on both sides as the market waits for a real catalyst or clean break of structure. In that kind of range, theta can work against both calls and puts if you’re forcing trades too early. My Outlook If I had to rank the probabilities today: 🟡 Sideways (my current lean) 🟢 Bullish breakout 🔴 Bearish For now, the key is whether NVDA can reclaim 212 or lose 192; until then, the range looks intact and the chop may continue. A decisive break of either level should shift the bias quickly. As always, the Heavy Diligence Options Signals Indicator will be my primary tool for entries and exits. While these scenarios provide the broader roadmap, the indicator is designed primarily for day trading on shorter timeframes, helping identify higher-probability Call and Put opportunities. Combining those signals with key technical levels helps improve risk management instead of simply guessing the next move. Disclaimer: This is only my interpretation of the current chart and is not financial advice. Always do your own research, wait for confirmation, and manage your risk before entering any trade.
NASDAQ:NVDA
by heavydiligence
Long 28.97 targetRsi about to break above 30. Fast stochastic broke above 20 and i got mutiple alerts on my stock screener to buy JD. First target 28.97. Second target 30.33
NASDAQ:JDLong
by ToniEvanu
Updated
KO BLUEPRINT MAPPING FVG / IFVG Testing multiple ways to map sessions. fvg and ifvg seem to work well on gap down or up on weekends and weekdays Asia sessions So if you map a Friday session b4 close you can set your trade ready for the sun 11 uk time . open! and this is the same with my other methods of mapping. most effective on opens and cpi data dumps Data Scientist Turning visions into reality through practical action. Mapping gold charts and many others with pinpoint accuracy. Money isn't the goal—it's a tool. A lifetime of creativity. Anything is possible.
NYSE:KO
by blackwhite121
SpaceX - This stock is literally collapsing!🥊SpaceX ( NASDAQ:SPCX ) is heading for new lows: 🔎Analysis summary: Just three days after the IPO in June, SpaceX already created its previous all time high. And over the past month, SpaceX then corrected about -50%, wiping out over $1 trillion. This chart remains totally bearish and is simply heading for new all time lows pretty soon. 📝Levels to watch: $120 Keep your #LONGTERMVISION🙏 — Phil (@TheTraderPhil)
NASDAQ:SPCXLong
04:17
by TheTraderPhil
LONG SETUP: Ciena corporation (CIEN)I entered this trade, because price formed SFP, touch the VWAP and bounced above VAL. Target: VAL = 530 Invalidation level: 355
NYSE:CIENLong
by StockHunterSimon
lululemon athletica inc. LONG SETUPI took half position because price formed SFP. GO BABY!
NASDAQ:LULULong
by StockHunterSimon
T AT&T Options Ahead of EarningsIf you haven`t bought T before the rally: Now analyzing the options chain and the chart patterns of T AT&T prior to the earnings report this week, I would consider purchasing the 22.5usd strike price Calls with an expiration date of 2026-8-14, for a premium of approximately $0.76. If these options prove to be profitable prior to the earnings release, I would sell at least half of them.
NYSE:TLong
by TopgOptions
PAYCHEX LONGRECLAIM VAL = LONG SETUP I will enter this setup after reclaim VAL = 106$.
NASDAQ:PAYXLong
by StockHunterSimon
112233445566778899101011111212131314141515161617171818191920202121222223232424252526262727282829293030313132323333343435353636373738383939404041414242
…999999

Made by humans

Select market data provided by ICE Data Services. Select reference data provided by FactSet. Copyright © 2026 FactSet Research Systems Inc.Copyright © 2026, American Bankers Association. CUSIP Database provided by FactSet Research Systems Inc. All rights reserved. SEC filings and other documents provided by Quartr.© 2026 TradingView, Inc.

More than a product
  • Supercharts
Screeners
  • Stocks
  • ETFs
  • Bonds
  • Crypto coins
  • CEX pairs
  • DEX pairs
  • Pine
Heatmaps
  • Stocks
  • ETFs
  • Crypto coins
Calendars
  • Economic
  • Earnings
  • Dividends
  • IPOs
More products
  • News Flow
  • Portfolios
  • Fundamental Graphs
  • Yield Curves
  • Options
  • Macro Maps
  • Pine Script®
Apps
  • Mobile
  • Desktop
Community
  • Social network
  • Wall of Love
  • Refer a friend
  • House Rules
  • Moderators
Ideas
  • Trading
  • Education
  • Editors' picks
Pine Script
  • Indicators & strategies
  • Wizards
  • Freelancers
  • Paid Spaces
Tools & subscriptions
  • Features
  • Pricing
  • Market data
  • Gift plans
Trading
  • Overview
  • Brokers
  • Brokers comparison
  • The Leap
Special offers
  • CME Group futures
  • Eurex futures
  • US stocks bundle
About company
  • Who we are
  • Space mission
  • Blog
  • Help Center
  • Careers
  • Media kit
Merch
  • TradingView store
  • Tarot cards for traders
  • The C63 TradeTime
Policies & security
  • Terms of Use
  • Disclaimer
  • Privacy Policy
  • Cookies Policy
  • Accessibility Statement
  • Security tips
  • Bug Bounty program
  • Status page
Business solutions
  • Widgets
  • Charting libraries
  • Lightweight Charts™
  • Advanced Charts
  • Trading Platform
Growth opportunities
  • Advertising
  • Brokerage integration
  • Partner program
  • Education program
Community
  • Social network
  • Wall of Love
  • Refer a friend
  • House Rules
  • Moderators
Ideas
  • Trading
  • Education
  • Editors' picks
Pine Script
  • Indicators & strategies
  • Wizards
  • Freelancers
  • Paid Spaces
Business solutions
  • Widgets
  • Charting libraries
  • Lightweight Charts™
  • Advanced Charts
  • Trading Platform
Growth opportunities
  • Advertising
  • Brokerage integration
  • Partner program
  • Education program
Look FirstLook First