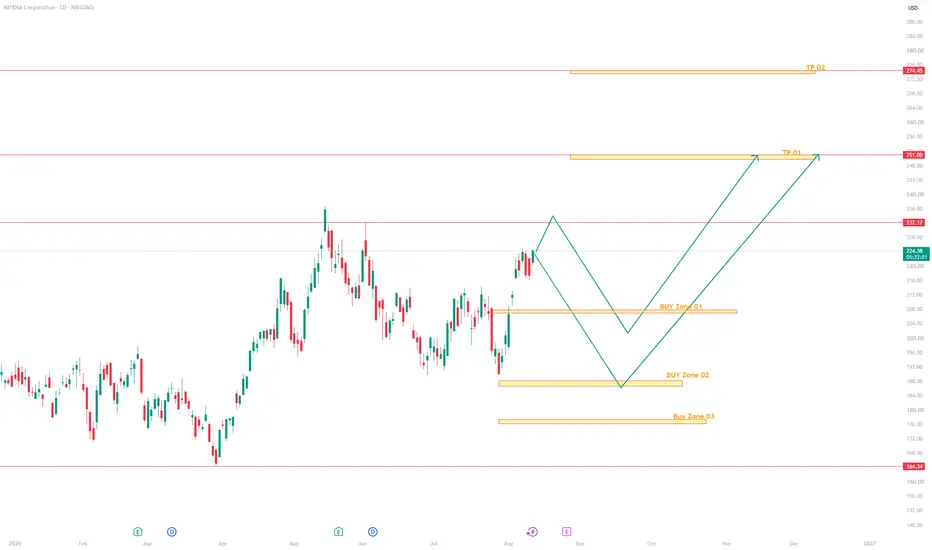
NVDA Sept. 14–18: 215 Support vs. 220 Resistance Sets Up the Next Move
NVDA enters the new week around 218 with an interesting conflict between the larger Daily structure and the shorter-term 1H trend. The Daily chart is still holding an important rising support structure, but the 1H remains weak after a rejection from the 230 area. The GEX map adds another important piece: 215 is the major HVL below price while 220 is the first major call level above it.
For me, that makes 215–220 the key decision range for Sept. 14–18. I don't want to assume the next direction while NVDA remains trapped inside it.
Daily Structure
I start with the Daily because the larger structure has not completely broken down. NVDA made a major low around 190 in late July and then developed a series of higher lows into August and September. The rising trendline from that low is still relevant, and price is currently testing that structure around 218–220.
There is also an important change in the larger pattern. The descending trendline from the May high around 236 has already been broken, which initially improved the Daily setup. NVDA subsequently rallied back into approximately 233–236 but failed to break through that major resistance area. That rejection brought price back toward the rising trendline.
This means NVDA is now testing whether the breakout was the beginning of a larger reversal or simply another failed attempt at the highs. As long as the rising Daily structure survives, I am not ready to call the larger setup bearish. However, losing this trendline and then 210 would weaken the Daily picture considerably.
On the upside, 225 is the first area I want to see recovered, followed by approximately 230 and 233–236. The 233–236 area is the real Daily breakout zone. If NVDA eventually clears that resistance with confirmation, the larger structure becomes much more bullish.
1H Confirmation
The 1H is weaker than the Daily and explains why I'm not immediately bullish.
NVDA was rejected from the 231–235 supply area and has been making lower highs since then. Price subsequently lost 225 and 223 before dropping toward approximately 217.20. A bounce developed from there, but it failed around 220–221 and price has returned to approximately 218.
The short-term moving-average structure is also sitting above price, while RSI is around 36 and below its signal line near 45. That tells me momentum remains weak. Unlike ORCL, however, NVDA's RSI isn't extremely oversold, so there is still room for another move lower if support fails.
The level that changes my short-term view is 220. If NVDA can reclaim 220 and begin holding above it, I would look for 223–225 next. If it cannot reclaim 220 and continues making lower highs underneath it, sellers still have short-term control.
The most important nearby price support is approximately 217–216. Losing that area would put the 215 zone directly in play.
GEX Positioning
The 1H GEX map lines up very well with what the technical charts are showing.
NVDA is around 218.26, almost directly between the 215 HVL and the 220 C1 level. That is why I see 215–220 as the battlefield rather than trying to predict direction from the middle.
The GEX environment is positive on this snapshot. Positive gamma generally tends to suppress volatility and encourage more mean-reverting price action while important gamma levels remain intact. It doesn't mean NVDA automatically goes higher. It means I would be more careful expecting a large directional move until price actually escapes the current gamma structure.
Above price, the GEX map shows 220 as C1, followed by approximately 222.5, 225, 227.5, 230 and 235. The interesting part is how closely those levels line up with resistance already visible on the Daily and 1H charts.
Below price, 215 is the HVL and major immediate downside level, followed by approximately 212.5, 210 and 207.5.
That alignment gives me much more confidence in these areas as reaction levels.
How I Put It Together
The Daily is still trying to maintain a larger bullish recovery structure, but the 1H has not confirmed it. Short-term momentum remains bearish underneath 220, while GEX has price sitting between the 215 HVL and the 220 call level.
So I enter the week neutral inside 215–220.
I become more bullish if NVDA reclaims 220 and begins building above it. I become more bearish if NVDA loses 215 and cannot recover it.
This is one of those situations where I would rather let the market show its hand than guess from the middle of the range.
Bullish Scenario
For the bullish case, the first job is reclaiming 220. I want more than a quick move above it. I want to see buyers establish acceptance above that level.
If that happens, 222.5–225 becomes the next target area. A break through 225 would improve the 1H structure and put approximately 227.5–230 back into play.
The bigger test is still 233–236. That is where the Daily chart previously rejected and where the larger resistance structure sits. If NVDA eventually clears 236 with strong price acceptance, I would consider that a much more important Daily breakout than anything happening around 218 today.
Bearish Scenario
The bearish scenario starts with continued rejection below 220 followed by a loss of the 217–215 support area.
A clean break below 215 would be important because both the technical structure and GEX point toward that level. If 215 fails and cannot be reclaimed, I would watch approximately 212.5 and 210 next.
Below 210, the next GEX level is around 207.5, and the Daily structure would also begin looking considerably weaker.
So 215 isn't just another number on the chart. For me, it separates the current consolidation from a potentially deeper pullback.
Options Outlook
For calls, I prefer confirmation above 220 rather than buying while NVDA remains underneath short-term resistance. A successful reclaim of 220 opens 222.5–225 first. Above 225, the setup becomes more interesting for a continuation toward 227.5–230.
For puts, I would rather see a confirmed loss of 215 or another strong rejection from 220. If 215 breaks, 212.5 and 210 become the next areas I would watch.
Because this GEX snapshot is showing positive gamma, I would also be careful buying expensive short-dated options while NVDA remains trapped between 215 and 220. If price simply chops between the major gamma levels, directional option buyers can be right about the larger idea and still lose from time decay and lack of movement.
Conclusion
NVDA enters Sept. 14–18 at a genuine decision point. The Daily structure has improved from the summer lows but is now retesting rising support after failing near 233–236. The 1H remains weaker with lower highs and price below short-term resistance. Meanwhile, the GEX map places NVDA almost perfectly between the 215 HVL and 220 C1.
For me, 215–220 defines the opening setup for the week. Above 220, I watch 222.5, 225, 227.5 and 230, with 233–236 remaining the major Daily resistance. Below 215, I watch 212.5, 210 and 207.5.
I don't need to guess whether NVDA is going to 230 or 210 before Monday opens. I want to see which side of 215–220 breaks and, more importantly, whether price can hold that break. That confirmation should tell us much more about where NVDA wants to trade next.
Educational analysis only. Not financial advice. ORCL Sept. 14–18Daily Reversal Tested as 150 Becomes the Battleground
Oracle enters the new week at an important technical decision point. The Daily chart has made a meaningful improvement by breaking the longer-term descending trendline, but the 1H chart has turned bearish after a strong rejection from resistance. At the same time, the 1H GEX map has ORCL trading below the important 150 HVL in negative gamma.
For me, this creates a simple question for Sept. 14–18: can ORCL defend the larger Daily recovery and reclaim 150, or will the short-term weakness continue toward 145 and possibly 140?
Daily Structure
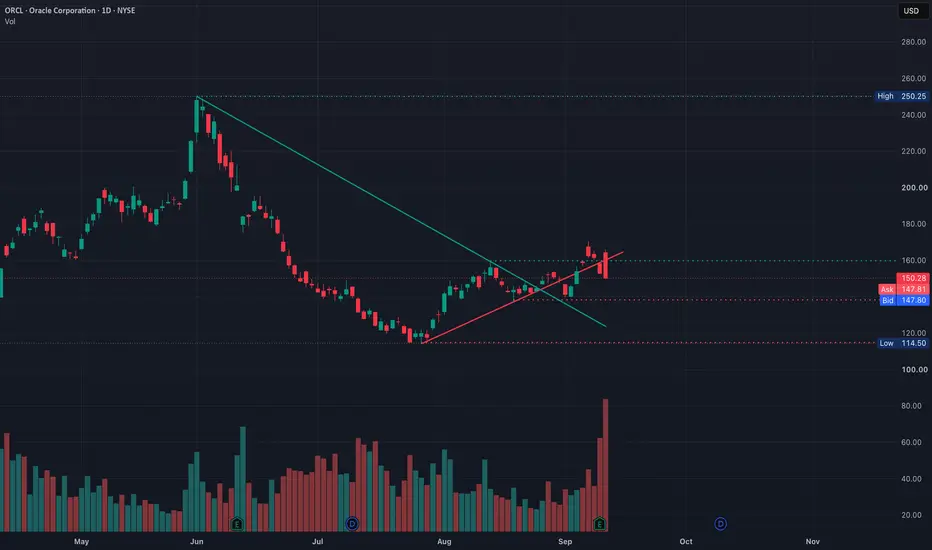
I always start with the Daily because it tells me what the larger structure is doing before I look at the lower timeframe. ORCL peaked around 250.25 in June and then spent several months making lower highs and lower lows. The descending trendline from that high controlled the stock through June, July and into August.
That trendline has now been broken, which is the first meaningful improvement in the larger structure. ORCL established a major low around 114.50 and then recovered through August and early September. However, breaking a bearish trendline does not automatically create a new bullish trend. Buyers still need to establish higher support and successfully break the next major resistance.
The first important Daily resistance is around 160. ORCL recently traded above that area but couldn't hold it and has now pulled back toward 147.80. For me, the broader recovery remains alive while the major support structure around 140 holds. If buyers eventually reclaim 160, I would watch the 166–170 area next, followed by the larger resistance around 184–185.
1H Confirmation
The 1H chart is where I become more cautious. ORCL recently pushed into approximately 166, directly underneath the larger supply area, and sellers rejected the move aggressively. Price subsequently lost 160, 155 and 150 before reaching approximately 147.81.
That gives the 1H a clearly bearish short-term structure. Price is below the short-term trend structure, the chart is showing a support break, and RSI has fallen to approximately 21. This tells me momentum is weak, but it also tells me the stock is already stretched. Because of that, I don't want to chase puts after a large decline.
The first thing I want to see Monday is how ORCL reacts around 150. If a bounce cannot reclaim 150–151, sellers still control the short-term structure. If buyers recover 150 and then push through 153–155, the 1H begins repairing itself. A recovery above 160 would be a much stronger change in character.
GEX Positioning
The 1H GEX map helps confirm why these price levels matter. ORCL is around 147.81 while the HVL sits near 150, meaning price has moved underneath an important gamma pivot. The GEX environment is also negative. I don't interpret negative gamma as automatically bearish; instead, it tells me dealer hedging can amplify movement once an important level breaks.
Below price, 145 is the first important GEX area, followed by approximately 142 and the major put wall/POI around 140. What gets my attention is that the 140 GEX level also lines up with the broader Daily support structure. When the technical chart and options positioning identify approximately the same area, I give that level more importance.
Above price, the GEX map gives us a clear ladder. The first major level is 150, followed by approximately 155 and the stronger C1 around 160. If ORCL can recover through those areas, the next GEX levels sit around 165, 170, 175 and 180.
How I Put It Together
The three charts are not completely aligned, and that's actually what makes this setup interesting. The Daily says the larger downtrend has been challenged and a recovery is developing. The 1H says sellers currently control the short-term move. GEX shows ORCL below the 150 HVL in negative gamma, which could allow the next confirmed break to travel farther.
Because of that, I enter the week with a neutral-to-bearish short-term bias, but I'm not interested in blindly chasing puts. I want price to confirm the next move.
Bullish Scenario
For the bullish case, ORCL first needs to reclaim 150 and prove it can hold that level as support. If that happens, 153–155 becomes the next test. A recovery through 155 would tell me the 1H selloff is beginning to repair itself and put 160 back into play.
A clean reclaim of 160 would be much more important because the lower timeframe would then begin aligning with the improving Daily structure. Above 160, I would watch 165 and 170 as the next major upside areas.
Bearish Scenario
If ORCL attempts to bounce but continues rejecting below 150, sellers maintain the advantage. The next important test becomes 145. A clean break below 145 would make the GEX levels around 142 and 140 increasingly important.
The 140 area is the major downside decision zone for me. If buyers defend it, ORCL could establish a larger Daily higher low and keep the recovery structure alive. If 140 breaks decisively, I would become much more skeptical about the Daily reversal.
Options Outlook
For calls, I prefer confirmation rather than trying to catch the exact bottom. A reclaim and hold above 150 improves the setup, while a move through 155 makes calls more interesting because 160 becomes the next major GEX target.
For puts, I would rather see a failed rebound into 150 or a confirmed break below 145 than chase ORCL after an already extended selloff. Below 145, I would watch 142 and 140. The 1H RSI is already deeply oversold, so risk/reward becomes more important than simply being correct about direction.
Conclusion
ORCL enters Sept. 14–18 with the Daily and short-term charts telling different stories. The Daily is attempting to build a larger reversal, while the 1H has turned bearish and GEX has price below the 150 HVL in negative gamma.
For me, 150 is the main decision level this week. Reclaiming 150 and then 155 would shift my attention back toward 160 and potentially 165–170. Staying below 150 and losing 145 would shift my attention toward 142 and especially 140.
I don't need to predict the entire week before it starts. I want ORCL to show which side controls these levels, and then I can trade with that confirmation instead of guessing.
Educational analysis only. Not financial advice.  Short
Short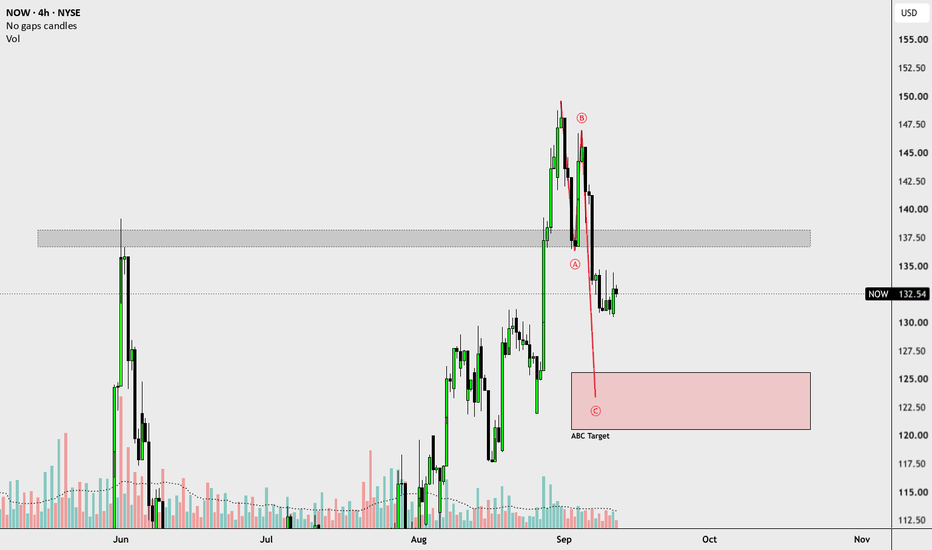
PLAY - Multi-Week Banger or Dud? PLAY reports earnings Monday after the close, and this is one of the more interesting setups on my watchlist this week because I believe the catalyst has the potential to become more than a one-day earnings trade.
Before getting into the thesis, an important point about the chart:
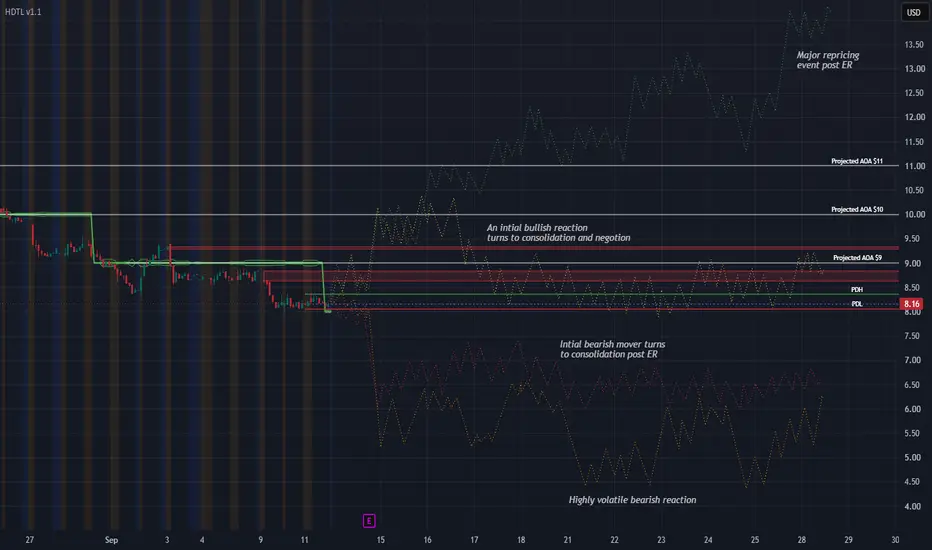
The colored paths are illustrations for visual learners.
They are not predictions of exactly where price will go, when it will get there, or what each individual candle should look like. I’m using them to illustrate the type of behavior and reaction I would expect under several different post-earnings outcomes.
I care about the behavior around the decision areas, not whether price follows one of my squiggly lines perfectly.
Why PLAY has my attention
PLAY has been in a sustained long-term decline and is trading near historically depressed levels.
That alone is not bullish.
A stock being down 80% does not mean it cannot fall another 50%.
What makes this interesting is the combination of an extremely beaten-down equity, a business attempting a turnaround, a major earnings catalyst, and historical evidence that a change in the market’s perception of the company can create an outsized repricing.
We have seen PLAY do this before.
Following a previous earnings event, the stock eventually traveled roughly 118% over the following 87 days.
That does not mean history is about to repeat.
What it tells me is that when expectations become this depressed, a meaningful change in the perceived trajectory of the business can potentially create something much larger than the initial earnings gap.
That is why I deliberately extended this scenario map much farther than I normally would for an earnings setup.
I’m interested in whether Monday’s report can become the beginning of a multi-week repricing event.
🟢 The only scenario I am personally interested in trading
Normally I would explain how I might approach each scenario.
I’m intentionally not doing that here.
The green scenario is the only one that currently fits my trading plan, so it is the only one I am interested in potentially putting money behind.
And even then:
I am not gambling on the earnings print.
I want to see the reaction first.
For me, a bullish earnings headline or a big after-hours candle isn't enough. I want the market to begin proving that investors are actually reassessing the company.
That could include behavior such as:
A meaningful positive earnings reaction.
Holding a substantial portion of that reaction instead of immediately fading it.
Reclaiming the nearby $9 Projected AOA.
Building acceptance rather than producing a one-candle squeeze.
Eventually challenging the $10 and $11 Projected AOAs.
Pullbacks being bought rather than every rally being sold.
New structure beginning to develop above the range PLAY has been trapped in.
If that behavior develops, then I become interested in the possibility that this is no longer simply an earnings pop.
It may be a repricing campaign.
The $11 area would be particularly important to me. A sustained move through that region would represent a much more meaningful departure from the structure PLAY has been living inside.
From there, the question changes from:
“Did PLAY have a good earnings reaction?”
to:
“Has the market materially changed what it believes this company is worth?”
Those are two very different trades.
🟡 Yellow is information — not my trade
The yellow illustration represents something like:
positive initial reaction → failure to develop sustained acceptance → consolidation/negotiation.
PLAY could easily have a decent report, jump initially, and then spend days arguing about what the numbers actually mean.
That might eventually create a trade.
It just isn't the setup I'm looking for right now.
If price remains trapped around the current battlefield and continues negotiating between approximately $8 and $9, I have no reason to force something simply because earnings occurred.
I can wait.
🔴 Red is also information — not my trade
The bearish illustrations represent different degrees of disappointment.
One shows an initial downside reaction eventually stabilizing.
The other represents a much more violent deterioration where the earnings event causes another significant repricing lower.
Both are absolutely possible.
Neither fits what I am looking for.
So I'm not going to manufacture a bearish trade simply because I drew a red line on a chart.
Scenario planning tells me what could happen.
My trading plan determines what I am actually allowed to trade.
Those are not the same thing.
This would require a different risk model
If PLAY develops into the green scenario, I would not treat it like one of my normal intraday options trades.
My normal position can be around $5,000.
For something like this, where I may want to give a multi-day or potentially multi-week thesis room to develop, I would size dramatically smaller.
My maximum position would be approximately $1,000.
And I size it that way for a very specific reason:
I have to be financially and emotionally prepared for that $1,000 to become $0.
That doesn't mean I'm planning to sit there and watch a worthless contract expire.
It means I don't want normal intraday volatility forcing me out of a longer-duration thesis simply because I used an intraday-sized position.
Different trade.
Different timeframe.
Different risk model.
What does not change is the process.
I still want the market to prove the thesis before I participate.
What I’m actually watching Monday night and Tuesday
I don't particularly care whether PLAY simply “beats earnings.”
A beat can gap up and completely fail.
I'm watching for evidence that the market believes the trajectory of the company is changing.
Then Tuesday, regular-hours price action gets the final vote.
I want to see whether buyers defend the repricing once normal liquidity returns.
Does PLAY reclaim important structure?
Does it hold it?
Does VWAP become support instead of a ceiling?
Do sellers immediately crush every rally, or does supply begin getting absorbed?
Does price start spending time in areas it hasn't been able to maintain?
Those questions matter far more to me than whether EPS beat an analyst estimate by a few cents.
The thesis in one sentence
I'm not trying to predict PLAY earnings. I'm looking for evidence after earnings that the market has begun repricing the entire turnaround story.
If that evidence appears, I think this has legitimate multi-week potential.
If it doesn't?
I lose absolutely nothing by watching it happen without me.
Preparation > Prediction.  Long
Long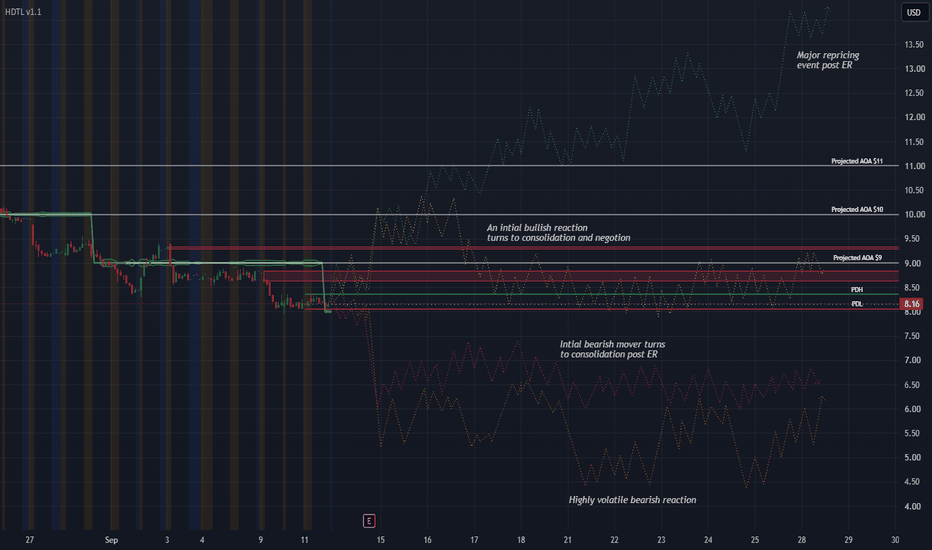
TSLA: Bearish 5-0 Pattern Could Signal a Much Larger Move LowerTesla has reached what I believe could be a long-term top at $498.83. Since that high, the structure has started to change, and the chart is now showing a potential bearish 5-0 harmonic pattern forming alongside Elliott Wave elements.
The interesting part is that the market may still be in the early stages of a much larger correction.
Bearish 5-0 Pattern
The bearish 5-0 pattern is forming near the current area, with price testing the upper portion of the structure.
The key level I am watching is around $367, which is also the 0.5 level marked on the chart.
If TSLA continues to reject this area, the bearish 5-0 could provide the next major leg lower.
Elliott Wave Structure
My bias is that $498.83 marked a major long-term top.
Since that high, TSLA appears to be working through waves 1 and 2 on both higher and lower degrees. In other words, we may still see a series of smaller corrective rallies and declines before the larger structure finally breaks.
The important part comes when this structure snaps and wave 3 begins.
Wave 3 is typically where momentum can accelerate significantly, and that is where I believe the downside could really start to expand.
Trade Setup
Entry: Around $365–$367
Stop Loss: $453.40
Take Profit Targets:
TP1: $259
TP2: $150
TP3: $100
The first target at $259 would be the initial confirmation that sellers are gaining control. If TSLA breaks through that level with momentum, I would be watching $150 and eventually $100.
The Bigger Picture
This is not a call that TSLA has to collapse immediately. The market can continue chopping around while waves 1 and 2 develop on multiple degrees.
But if the bearish 5-0 remains valid and the corrective structure eventually breaks, the move into wave 3 could be much more aggressive than the moves we have seen so far.
For me, the key idea is simple:
$498.83 may have marked the long-term top.
If TSLA continues failing around the current resistance area and the bearish structure confirms, we could eventually see an accelerating wave 3 to the downside.
Entry: $365–$367
Stop: $453.40
Targets: $259 → $150 → $100
This is where the bearish 5-0 gets interesting. The pattern may be forming now, but the real move could come when the larger wave structure finally snaps.  Short
Short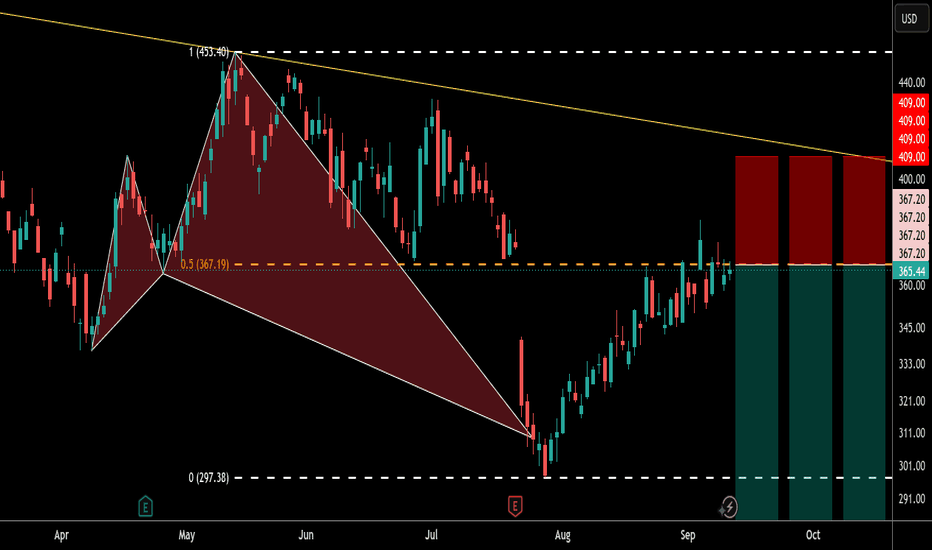
TSLA Weekly — Coiling at the 150 SMA, Still Trapped Under the DoTesla (NASDAQ: TSLA) — Weekly , Log Scale
What's constructive:
- Price bounced cleanly right off the 150-week SMA (~$314), which has stepped in as dynamic support on this pullback.
- There's also a support trendline running from the November 2025 low — it's sloping downward, not rising, but price keeps holding above it on every test. That, combined with the descending line off the December 2025 ATH, looks more like a flag than a wedge — the two lines are running roughly parallel rather than converging — and this kind of consolidation can still resolve into a real directional move.
What's not:
- Price is still inside the downtrend from the December 2025 ATH (~$488) — that trendline hasn't been reclaimed yet.
- The major support trendline going back to April 2024 got broken in July 2026 and hasn't been reclaimed — it's now acting as resistance overhead.
Bottom line: This is a name I'm watching, not one I'm long yet. Until TSLA reclaims either the ATH downtrend line or gets back above the broken April 2024 trendline, I don't consider this a swing long setup — the basing action above the 150 SMA is a good sign, but structure still says "wait for confirmation."
NFA, just TA.  Long
Long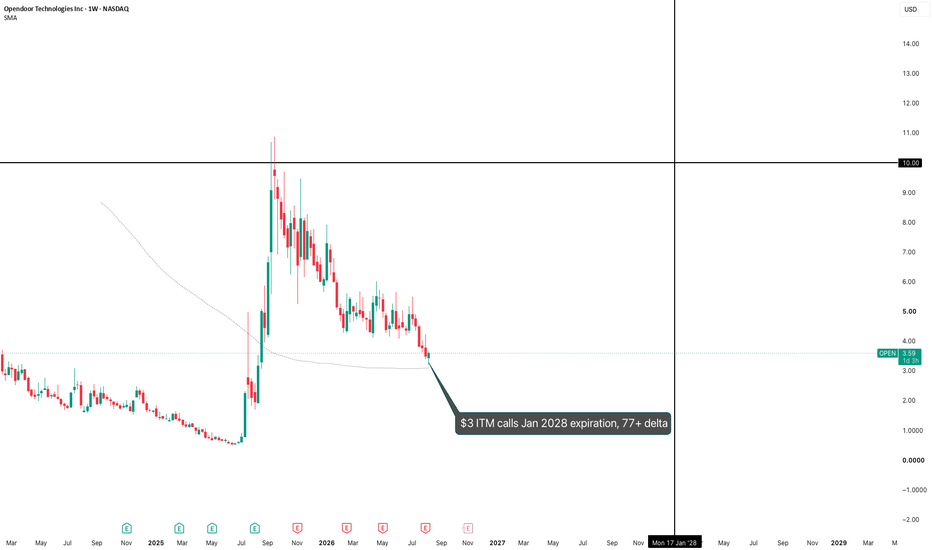
 Long
Long
 Long
Long
ORCL: Record $664B Backlog, Negative FCF — Wait for $138–147ORACLE (ORCL) — HOLD 54/100 · Data as of Sep 11, 2026 close ($150.28)
Record quarter, rejected by the market. Q1 FY27: RPO $664B (+$209B YoY), OCI revenue +121%, total revenue $19.3B (+30%). The stock gapped up 7.5% and reversed 10% intraday. Why: FY27 EPS guidance ($8.10) only matched consensus ($8.05), trailing free cash flow is −$23.7B, and ~$20B of stock was sold through an at-the-market program (~4.5% dilution in one quarter).
THE PLAN
• New position: don't buy today. Conditional buy zone $138–147, only with confirmation (hourly MACD turning up).
• Stop: daily close below $129.50.
• Take-profit 1: $170–184 · Take-profit 2: $200–215.
• My fair-value band: $165–200 (midpoint $182). Risk/reward from the zone: 2.65 : 1.
• Scale-in if triggered: 40% / 35% / 25%.
THREE GATES — 2 of 3 passed
✅ Valuation: forward P/E 18.6x, PEG 0.92.
✅ Thesis: backlog is real; cash conversion is not proven yet.
❌ Entry: price is 10.4% below the 200-day SMA ($167.64); hourly MACD negative.
WHAT ACTUALLY MOVED THE PRICE (12 months, $232.80 → $150.27)
Nine major events add up to −$40.6. The other −$41.9 is drift between events — only half of the decline can be tied to a headline.
Story events were all given back: RPO reveal +$59.4, new AI contracts +$36.9, second peak attempt +$41.7.
Cash events stuck: financing concerns −$24.1, Q2 revenue miss −$27.6, negative FCF revealed −$99.3 (largest single hit).
INSIDERS
• Zero open-market buys in the last 12 months — checked against raw SEC Form 4 XML (49 filings), Alpha Vantage, Massive and Dataroma.
• 30 sales, $140.2M. 14 of them ($45.2M) were NOT under 10b5-1 plans, led by the CEO.
• The last two insider buys (Jul 2025 at $233.87, Feb 2025 at $172.35) are both underwater, and neither buyer averaged down.
• Larry Ellison: the 10-Q disclosed a 10b5-1 plan (adopted Jun 22) to sell up to 50M shares (~$7.5B). On Sep 12 Oracle announced it was cancelled with no shares sold.
ANALYSTS vs PRICE
• 45 analysts: 36 Buy / 8 Hold / 1 Sell, average target $243.97.
• But the MarketBeat consensus target fell from $297 to $256 over 12 months while the stock fell 48.6% — most of the "upside" is stale targets, not new conviction.
• EPS estimates are rising: FY27 $8.04 → $8.13, 3 upward / 0 downward revisions in 30 days. The problem is trust, not earnings.
• Lowest target: CLSA $145 (Hold), below today's price.
SENTIMENT SPLIT
Retail (Stocktwits) 91/100 extremely bullish vs. Danelfin's AI model 3/10. TradingView ideas this week: 4 long / 3 short / 3 neutral.
DECISION TREE
Price reaches $147 → Is the thesis broken (another equity raise, RPO decline)?
• Yes → don't buy, wait for the Dec 9 earnings.
• No → trend check: decline continuing → wait; decline stopped and confirmed → scale in.
KEY DATE: Dec 9, 2026 — Q2 FY27 earnings (EPS guide $1.85–1.93). The next durable move up needs improving free cash flow, not another contract headline.
What would change my view: a daily close below $129.50 (bearish) · positive FCF trend or the ATM program ending (bullish).
Not financial advice. Personal analysis for educational purposes.
HOOD - Start of the Breakout A few weeks ago, I outlined that Robinhood was nearing the start of its bull market. That idea can be found here:
Since then, price has broken out on the weekly and is currently retesting old resistance as new support. What is particularly significant from that last post is the RSI. The weekly RSI has broken above the white trendline I had outlined and is now testing it as a new level of support as well. If HOOD can show strength on the RSI this week, it would be a perfect bounce, and the true breakout would begin.
Why I'm Focusing on the 2-Day Chart
That is what this post is about. I made this idea on the 2-day timeframe, as I believe it provides a clearer view of the current situation.
Price has recently broken the resistance that had been holding it down since October 2025. Now, price has come back down and is testing that same level, where sellers previously dominated the trend, as a new level for buyers to take control. Adding to this, price has created a 2-day reversal doji, which could signal a move back to the upside. This is likely to begin the push back toward the $150 level.
Why the RSI Is the Key Metric
That said, the RSI remains the most important technical metric I am watching right now to confirm this breakout. There has been a clear downward resistance level (red arrows) where strength has repeatedly diminished, along with a clear support trendline (green arrows) where strength has repeatedly recovered.
Because of this, watch for the 2-day RSI to close above the upper white trendline. That would help build the momentum necessary to push price toward the upper target.
On the other hand, if this ends up becoming a failed breakout for whatever reason, it will be important to shift attention to the lower support trendline instead.  Short
Short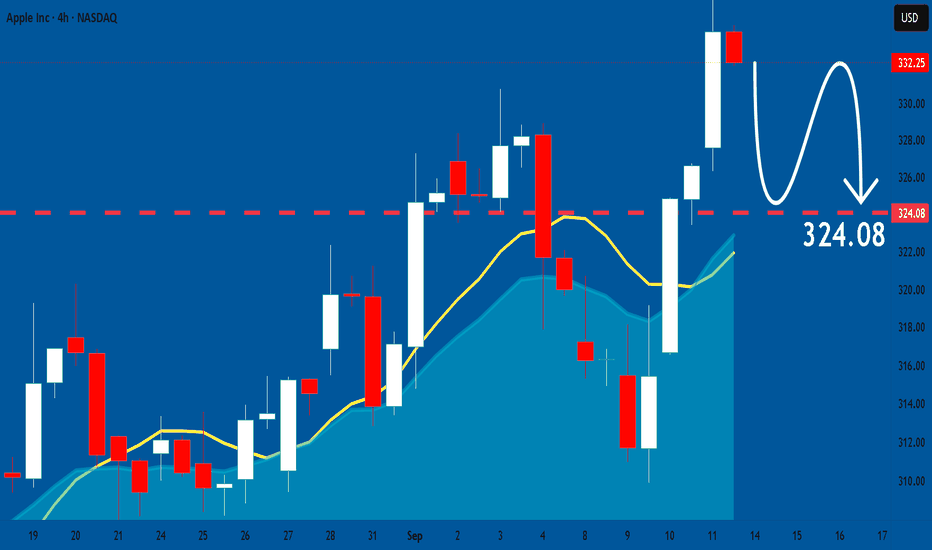
 Long
Long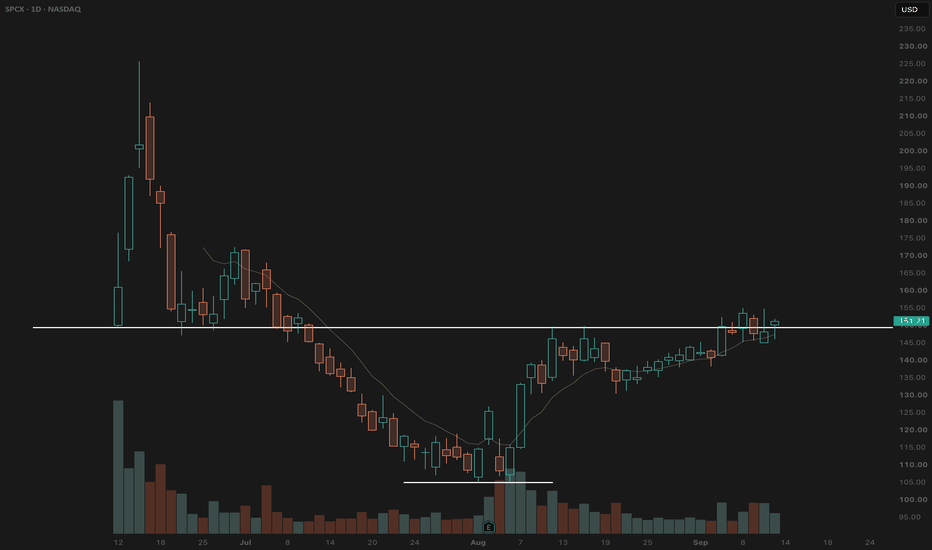
 Long
Long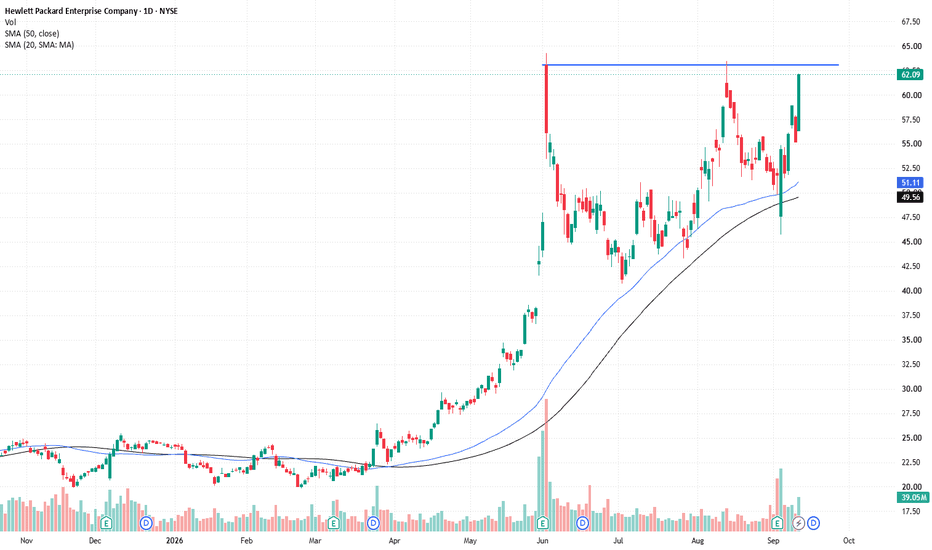
Long 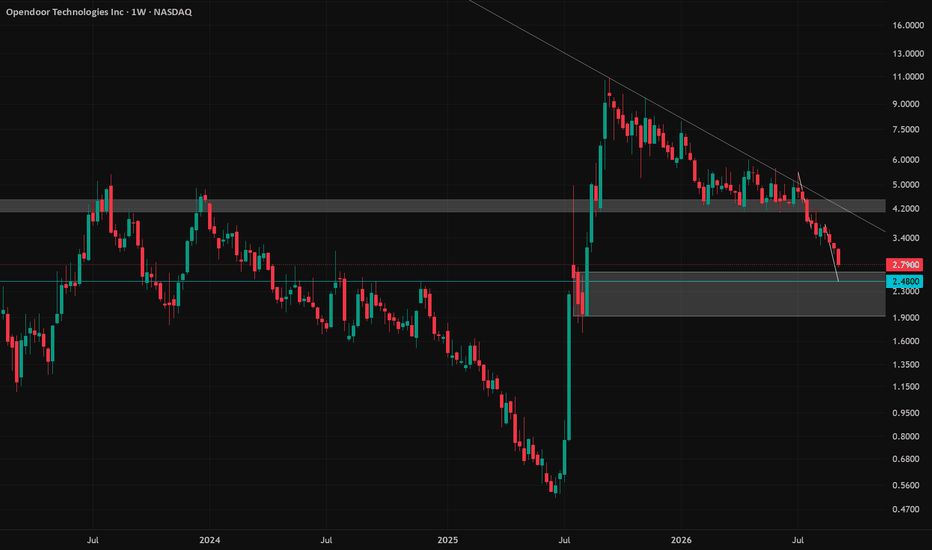
 Long
Long
NOW | Trend Flipped — The Flip Zone Is Where It Gets ProvenBy analyzing the #NOW (ServiceNow) chart on the 1D timeframe, we can see a market that spent a year making lower lows and has now stopped doing so. The structure has flipped, the retracement is happening on top of the level that produced it, and what price does here decides whether this is a reversal or another failed bounce.
1D Timeframe
The context matters, because it explains what the break means.
From March 2025 onward, NOW was in a clean bearish sequence. Price rolled over from above $210 , printed a BOS to the downside in April, another in October, and continued grinding lower all the way to the Protected Low at $89.15 in April 2026. Twelve months of lower lows with no structural response from buyers.
That ended in June. Price broke above the swing high that had capped the range and printed a bullish CHoCH — the first structural break to the upside in the entire move. It followed it with a BOS above the next high, which is the confirmation that matters. A CHoCH says the previous direction is losing control. A BOS after it says the new one has taken it.
The advance since has been contained inside a rising channel, and the region it broke out from is now the Flip zone at $112.08 – $130.95 — the area that capped price through July and early August, and should now act as support on the way back.
Price is currently trading around $132.53 , sitting directly on the upper edge of that zone after pulling back from $150 .
That is the whole setup. Price is testing the level that produced the break, from above, for the first time.
Above, the resting liquidity at $210.12 is untouched and has been since the decline began.
Beneath everything, the Protected Low at $89.15 holds the entire structure together.
The Bias
Bullish while price holds above the Protected Low. But the entry is conditional, and the condition is specific.
Scenario A — the base case.
Price holds the Flip zone ($112.08 – $130.95) and continues. That region overlaps the lower boundary of the rising channel, which gives it two structural reasons to hold rather than one.
What I want before treating this as a position rather than a possibility: confirmation on the daily . An MSS to the upside from within the zone, or a decisive bullish engulfing close. A touch is not a reaction — the reaction is what gets confirmed by the close.
From that confirmation, the draw is the untouched liquidity at $210.12 , with very little structure in between. The decline through that region was fast, which means the way back can be too.
Scenario B — the deeper test.
Price may work further into the zone toward $112.08 before turning. That is still the same trade at a better price — the zone is a range, not a line, and testing its lower half does not break anything. The channel's lower boundary sits in the same area, which makes the deeper test a stronger reference rather than a weaker one.
What is not the trade: buying the touch without the close. This chart has produced a year of failed bounces, and the difference between this one and those is confirmation, not hope.
Invalidation. A decisive close beneath the Flip zone at $112.08 means the region that produced the break failed to hold it, and the structure needs re-reading. Full invalidation is a close below the Protected Low at $89.15 — below that, the CHoCH and BOS were failed breaks and the downtrend was never interrupted.
And the rule that governs all of it: a break is a candle close, not a wick. The lower edge of a flip zone is exactly where price spikes through and reclaims within the same session.
Fundamental Backdrop
The fundamentals here have turned in the same window as the structure, which is worth noting rather than assuming coincidence.
The stock has jumped roughly 25% in three months and around 33% in the past month , with the move partly attributed to strong results from Salesforce reframing how the market reads enterprise software exposure to AI. That was the core bear case for a year — that AI displaces enterprise software rather than needing it — and the sector has pushed back on it.
Analyst positioning has followed hard. BTIG raised its target from $150 to $170 on 8 September. Needham raised from $115 to $155 . BofA went from $130 to $150 in August. Consensus sits at Moderate Buy with an average target around $144.73 . Q2 2026 revenue came in at $3.99 billion , with full-year GAAP subscription revenue guided to $15.74 – $15.78 billion, representing 22% to 22.5% growth.
The honest counterweight. The stock remains roughly 32% below its 52-week high of $194.73 and was down about 25% year to date before this rally — this is a recovery from a deep hole, not a breakout. ServiceNow is cutting nearly 300 jobs across two California offices effective 28 September, part of keeping headcount flat through year-end while shifting toward AI skills. Management has flagged more cuts. A recently patched sandbox escape vulnerability is being actively exploited in the wild. And an insider cashed out in a notable sale in late August, the same week the stock was running.
Put together: a business growing subscription revenue above 20% with analyst targets moving up sharply, in a stock that has already run 33% in a month. That combination usually resolves through a retracement that gets bought rather than one that keeps going — which is exactly what the Flip zone is there to answer.
This analysis will be updated as the market evolves.
Best Regards, BigBeluga 🐳 Long 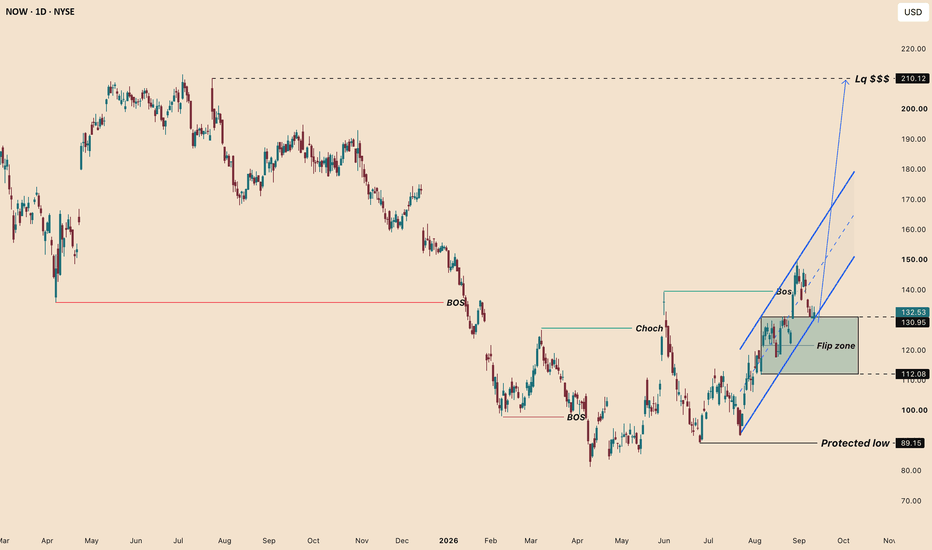
Oracle’s AI Growth Is Real. But Can It Turn Spending Into Cash?Key Points
1. Oracle’s AI cloud business is growing fast, but its spending is growing even faster.
2. Negative free cash flow and rising debt remain the biggest risks for investors.
3. The stock looks cheaper after the selloff, but Oracle still needs to prove its AI spending can turn into real cash.
Oracle has a real AI growth story. The problem is that the company is spending a huge amount of money to build it, and investors are still waiting to see whether that spending will translate into stronger cash flow.
Oracle’s capital spending jumped about 163% to $55.7 billion in fiscal 2026. The company expects to spend another $90 billion to $95 billion in fiscal 2027. That is a massive increase, and it is one of the main reasons investors have become more cautious about the stock.
The AI demand itself is not the problem. Oracle Cloud Infrastructure is growing quickly as companies need more capacity for AI workloads. OCI revenue jumped 121% year over year in the latest quarter, while Oracle also reported more than $30 billion in new AI contracts.
The concern is what happens to the cash. Oracle generated $23.1 billion in operating cash flow, but free cash flow was still negative $5.4 billion because of its heavy infrastructure spending. The company is also taking on more debt to fund the expansion.
Wall Street is split. Morgan Stanley remains cautious with an Equal-weight rating and a $210 price target. Jefferies is more bullish, maintaining a Buy rating with a $290 target. BMO recently lowered its target to $195 while keeping an Outperform rating, pointing to pressure on gross margins and weaker SaaS growth.
Oracle co-founder and executive chairman Larry Ellison has canceled a plan to sell up to 50 million shares, a move that could signal he remains confident in the company’s long-term prospects.
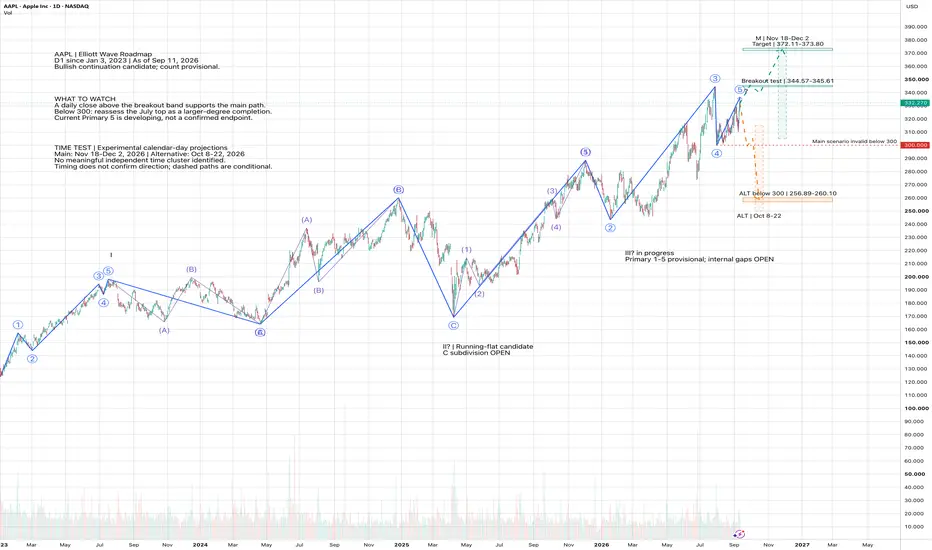
At around $150, Oracle has already fallen 54% from its 52-week high. That makes the stock interesting from a contrarian view, but I would not ignore the cash-flow problem. The bullish case depends on Oracle turning its huge AI backlog into revenue and eventually into cash. Until that happens, ORCL could remain volatile. AAPL: A New High Within Reach?Apple is approaching an interesting moment. The recovery from the summer pullback has brought buyers back within sight of July’s high. The question now is whether they have enough strength to push through—or whether this rebound is setting up another disappointment.
The next test sits at $344.57–$345.61. Until Apple clears that band, the bullish story still has something to prove.
Looking back to January 2023, the chart tells a story of strong advances interrupted by difficult corrections. The first rally can be divided into five waves. What followed was much less straightforward: a long, overlapping stretch that produced a new high before another sharp decline into April 2025.
That messy middle matters. It leaves the larger Elliott interpretation open, even though the advance from April to December 2025 offers a clearer five-wave structure. The chart connects these smaller swings to the broader picture across three wave degrees. It does not turn every uncertain turn into a confirmed label.
The working view is that Apple may still have another upward leg ahead. But the latest recovery contains overlaps, so its final shape remains unresolved. This is a roadmap with conditions—not a claim that the next move has already been decided.
For buyers, a daily close above the breakout band would be an encouraging first step. Holding that area on a subsequent pullback would make the continuation case more convincing. If that happens, $372.11–$373.80 becomes the next projected area of interest. That zone brings together two Fibonacci measurements of earlier swings; it is a destination to watch, not a promised outcome.
The other side of the story starts at $300. Losing that summer low would undermine the immediate bullish setup and put a larger correction back in focus. The first downside reference would be around $277.58, followed by the marked $256.89–$260.10 zone. A local setback would require reassessing the count; it would not automatically erase the entire advance since 2023. Nor is $300 automatically an appropriate stop for every trade.
There is also a timing layer, although it offers less agreement than the price levels. Comparisons with earlier wave durations point to November 18–December 2, 2026 for the continuation scenario and October 8–22, 2026 for the correction alternative. These are experimental calendar-day windows. No convincing independent time cluster emerged, so neither window should be treated as a deadline or an entry signal.
For now, the most useful question is simple: can Apple turn resistance into support? The answer at the breakout band will tell us more than adding another wave label ever could.
Daily chart through September 11, 2026. Prices in USD, without dividend adjustment. Educational scenario analysis; the count remains provisional.  Short
Short
 Long
Long
 Long
Long