• Products
  • Community
  • Markets
  • Brokers
  • More
Get started
  • Markets
  • /USA
  • /Stocks
  • /Ideas
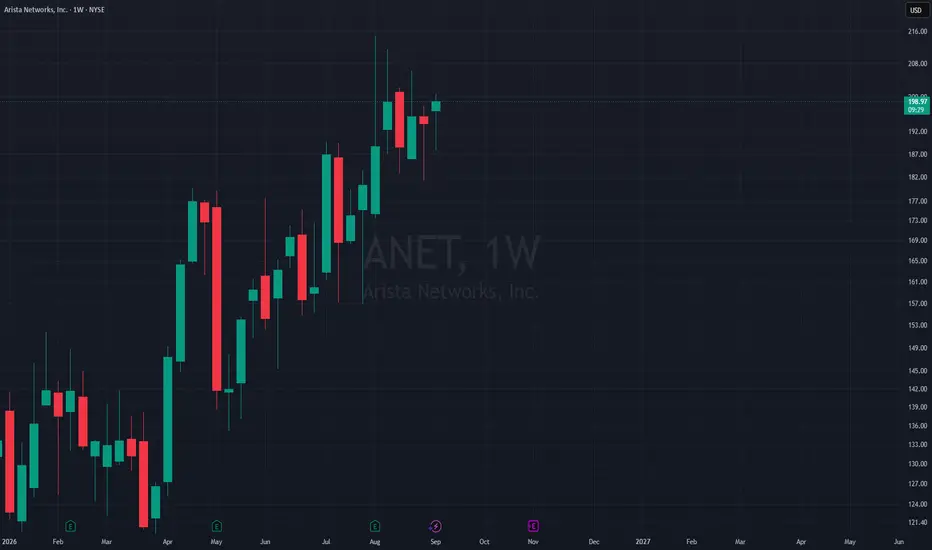
400 in play?I am waiting for a dip to buy this one, may be around 180. I think we may have a dip by this October. Bullish on a dip to 180 and run up towards 400. All the best !!
NYSE:NETLong
by babu_trader
PLTR Soared 3,400%, Then Sank 35%. What Does Its Chart Say Now?Palantir NASDAQ:PLTR has struggled for some nine months now, falling more than 35% after the cybersecurity stock enjoyed a long, nearly parabolic run that saw it gain some 3,400% between December 2022 and November 2025. Can the stock turn its fortunes back around? Let's see what its chart and fundamentals say. Palantir's Fundamental Analysis PLTR will next report quarterly earnings in about four weeks' time, releasing fiscal Q2 results in August. Although management has yet to set an official date for Palantir's earnings release the Street is looking for the company to show $0.35 in adjusted earnings per share on about $1.81 billion of sales. If those numbers are what actually hit the tape, that would represent about 119% of year-over-year profit growth on roughly 80% in y/y revenue gains. Meanwhile, analysts' consensus estimates for the company's full-fiscal-year results call for 97% year-on-year earnings growth and a 73% y/y sales increase. Growth like that doesn't come easily for large-cap stocks. And impressively, 20 of the 23 sell-side analysts that I know of who cover PLTR have increased their earnings estimates since the quarter began. Zero analysts have reduced their estimates, while three have made no changes. Bank of America analyst Mariana Perez Mora (rated at five stars out of a possible five by TipRanks) recently reiterated her "Buy" rating on the stock, although she hasn't set a price target on PLTR for a while. Palantir's Technical Analysis Now let's go to PLTR's chart going back some seven months and running through Wednesday afternoon (July 8): Readers will first see that Palantir developed a falling-wedge pattern of bullish reversal that lasted from late 2026 into May. Marked with tan shading at the chart's left, this set-up didn't really produce much for the stock. Palantir tried to break out of the pattern in late May and rally, but failed to do so. But interestingly, the stock's aborted breakout ended up developing into the first portion of what I think might become an inverse head-and-shoulders pattern (which also predicts bullish reversal). Marked with green shading at the chart's right, this pattern looks like it's close to two-thirds of the way toward completion. I've drawn in what could become the pattern's right shoulder if Palantir falters -- which it seems to be doing at its 50-day Simple Moving Average, or "SMA," marked with a blue line at $133.70 above. (The stock closed Monday at $130.04.) Should Palantir come back, break through and hold the 50-day SMA, then we'll stop looking for an inverse head-and-shoulders pattern. Instead, portfolio managers would likely have to make decisions on their allocation weightings in the stock in preparation for a potential run at Palantir's 200-day SMA (the red line at $157.10 above). Until then, the pivot for what might be a bullish pattern in the making would likely stand at $136. (Again, PLTR ended Monday at $130.04.) Moving on to the other technical indicators above, Palantir's Relative Strength Index (the gray line marked "RSI" at the chart's top) has improved recently, but is struggling to hold above the neutral line. The stock's daily Moving Average Convergence Divergence indicator (or "MACD," denoted by blue bars, a black line and a gold line at the chart's bottom) has improved as well, but needs more to become strongly bullish. On one hand, the histogram of the stock's 9-day Exponential Moving Average (or "EMA," marked with blue bars) has moved into positive territory. That's a short-term bullish signal. Additionally, the 12-day EMA (the black line) is running above the 26-day EMA (the gold line). That's bullish as well. However, that signal's degree of bullishness is somewhat muted by the fact that both of those lines are running below the zero-bound. (Moomoo Technologies Inc. Markets Commentator Stephen "Sarge" Guilfoyle was long PLTR at the time of writing this column.) This article discusses technical analysis, other approaches, including fundamental analysis, may offer very different views. The examples provided are for illustrative purposes only and are not intended to be reflective of the results you can expect to achieve. Specific security charts used are for illustrative purposes only and are not a recommendation, offer to sell, or a solicitation of an offer to buy any security. Past investment performance does not indicate or guarantee future success. Returns will vary, and all investments carry risks, including loss of principal. This content is also not a research report and is not intended to serve as the basis for any investment decision. The information contained in this article does not purport to be a complete description of the securities, markets, or developments referred to in this material. Moomoo and its affiliates make no representation or warranty as to the article's adequacy, completeness, accuracy or timeliness for any particular purpose of the above content. Furthermore, there is no guarantee that any statements, estimates, price targets, opinions or forecasts provided herein will prove to be correct. The Analyst Ratings feature comes from TipRanks, an independent third party. The accuracy, completeness, or reliability cannot be guaranteed and should not be relied upon as a primary basis for any investment decision. The target prices are intended for informational purposes only, not recommendations, and are also not guarantees of future results. Moomoo is a financial information and trading app offered by Moomoo Technologies Inc. In the U.S., investment products and services on Moomoo are offered by Moomoo Financial Inc., Member FINRA/SIPC. TradingView is an independent third party not affiliated with Moomoo Financial Inc., Moomoo Technologies Inc., or its affiliates. Moomoo Financial Inc. and its affiliates do not endorse, represent or warrant the completeness and accuracy of the data and information available on the TradingView platform and are not responsible for any services provided by the third-party platform.
NASDAQ:PLTR
by moomoo
44
metaameta meta meta what can you do today... lets see .. cant wait to see how today encs.. meta at highs or lows?>
NASDAQ:META
by QGotGemz
$IBM , SetupNormally not posting a full setup here. ENTRY : CMP TP1 : ** TP2 : ** TP3 : ** TP4 : ** SL : If you wish ** FULL SETUP AVAILABLE** My SL is never a SELL, just an alarm to stop adding money and wait for better dca Follow, Boost, Join, Thank You ! ⚠️ Financial Disclaimer: This post is not financial advice. I am not your financial advisor, your life coach, or your legally responsible adult. Always do your own research and never trade based solely on internet comedy
NYSE:IBMLong
by evolutionqc
44
SOFI Is Breaking Out Soon… This is my opinion: Once my yellow level completely breaks and holds, price should move higher. I got a couple leap options on SOFI already, let the printing begin! Other reasons: * CEO has been buying large below these levels. * Accumulation zone * SOFI itself has been popping up more lately on social media, and a couple news outlets. * The Company itself has been in growth mode
NASDAQ:SOFILong
by Lalo_333
11
$IBM , IdeaSome charts require interpretation. This one required labels, so we gave the zones their proper names: First Stop, Do or Die, and Panic. The map explains itself. IBM has spent over a year building a wide distribution range, and price is now breaking down from the bottom of it. On a weekly timeframe, that is not noise, that is a decision. What happens next plays out over years, not weeks, and we see three paths. Path 1: The breakdown turns out to be the fakeout. Buyers reclaim the range immediately, the shakeout traps the sellers, and price begins the long climb toward the First Stop zone high above. The strongest version of the bull case, and the least patient one. Path 2: The honest path. The breakdown follows through and price descends into the Do or Die zone, the last major structural support on the chart. The name is not decoration. If buyers show up there with conviction, the entire correction becomes the launchpad, and the destination is the same First Stop, just on a longer road. Path 3: Do or Die, and the answer is die. Support fails, conviction evaporates, and price capitulates into the Panic zone below. That is where forced sellers finish and generational buyers begin. If price ever prints there, fear will be the loudest voice in the room, which is usually the moment it stops being right. Notice the asymmetry: two of the three paths end at the First Stop. Even the ugly one likely resolves higher eventually, it just charges a much steeper emotional toll on the way. We are not predicting which road IBM takes. We are watching how price reacts at each zone, because the reaction is the only signal that pays. EQC follows the reaction. Hidden in plain sight. EQC. Like, Follow, Boost, Join, Thank You! Financial Disclaimer: This post is not financial advice. I am not your financial advisor, your crypto influencer, or your emergency hotline when volatility discovers your stop loss. Always do your own research and never trade solely because colorful arrows suggest a brighter future.
NYSE:IBM
by evolutionqc
T Short — Failed breakout, back below VWAP, and fresh analyst…AT&T is a short-side pullback after a failed breakout and price back below VWAP, with the setup aimed at a retest of nearby support rather than a chase. The fresh analyst pressure gives the fade a catalyst, while the positive 5G headline looks less decisive and has not been broadly corroborated as a sustained driver. 📍 Entry: 21.40 🛑 Stop: 21.92 🎯 Target: 20.62 ⚖️ R:R: 1.50
NYSE:TShort
by mnktrd
J Long — Fresh military-contract flow is fueling a failed-breakdDespite the 4h bearish swing, the 1h failed-breakdown trigger above VWAP targets the resistance retest; fresh military-contract flow supplies the catalyst that justifies fading the pullback from above. 📍 Entry: 125.85 🛑 Stop: 123.24 🎯 Target: 131.76 ⚖️ R:R: 2.26
NYSE:JLong
by mnktrd
NVIDIA (NVDA) | Price Action AnalysisNVIDIA is approaching a key technical decision zone where momentum could accelerate in either direction. With AI optimism, institutional participation, and broader Nasdaq sentiment driving the stock, today's strategy is simple: wait for confirmation before committing to a trade. 🟣 Bullish: Buy only after a confirmed breakout above resistance. 🟣 Bearish: Sell only after a confirmed breakdown below support. 🔑 Market Drivers 🤖 Continued global demand for AI infrastructure and data center expansion. 💻 Semiconductor sector momentum and institutional fund flows. 📊 Nasdaq performance and broader technology sector sentiment. 🏦 U.S. Treasury yields, Federal Reserve expectations, and macroeconomic data releases. Great trades come from patience, confirmation, and disciplined risk management—not prediction. Educational analysis only. Not financial or investment advice.
NASDAQ:NVDA
by globuscapitas
22
INCT: downside retracement, but first an 8% correction upNASDAQ:INTC > Intel move this pre-market is trapping buyers imho. > in my last post i predict this going to the $80 range, while that is still a possibility, i see from the latest order flow that the $90's range might be where it finds strong support. i would ideally be looking for a liquidly sweep from there to identify a viable SL to go long afterwards. > liquidity levels (based of market structure & Fibonacci retracement) suggests that it will retrace a good 8-10-12 percent back up on a mild correction towards to 113 - 120 levels before continuing its downside move to the aforesaid PT's. > you could trade the lower conviction correction, or simply wait for it to put its top and go short from there, thus putting your trade alongside the current trend and the overall ominous market sentiment. > wishing you successful trading. > Authors Notes My approach to technical analysis is built on Fibonacci retracements, pivot zones, price action, smart money concepts, and classic chart patterns. I also use supporting tools and indicators—such as oscillators and moving averages—to refine my view. The chart itself reflects a simplified version of my process, as I prefer to keep visuals clean while incorporating additional analysis behind the scenes.
NASDAQ:INTCShort
by Wis_
11
Tesla (TSLA) | Day Trading Idea | Tuesday, July 14, 2026Tesla (TSLA) | Tuesday Intraday Outlook Tesla is approaching a critical technical zone where momentum is likely to expand. With AI optimism, broader Nasdaq sentiment, and macroeconomic developments driving volatility, today's focus is on confirmation—not anticipation. 🟣 Bullish : Buy only after a confirmed breakout above Supply Zone. 🟣 Bearish : Sell only after a confirmed breakdown below Demand Zone. 🔑 Market Drivers 🤖 AI, Full Self-Driving (FSD), and robotics developments. 📊 Nasdaq strength and institutional fund positioning. 🏦 U.S. Treasury yields and Federal Reserve expectations. 🌍 Global market sentiment and macroeconomic headlines. Trade the trend. Respect your risk. Let price action lead every decision. Educational analysis only. Not financial or investment advice.
NASDAQ:TSLA
by globuscapitas
JPM | Why JPMorgan Keeps Winning While Other Banks StruggleJPMorgan Chase delivered another record quarter, demonstrating that its competitive advantage increasingly comes not from favorable interest rates alone, but from the breadth of a diversified financial ecosystem that monetizes volatility, wealth creation, payments, and consumer banking simultaneously JPMorgan reported managed revenue of $58.0 billion, up 27% year over year (15% excluding significant items), while reported revenue reached $57.3 billion, increasing 28% from the prior year. Revenue established a new quarterly record across every major business line Growth was broad based across JPMorgan's businesses. Consumer & Community Banking revenue rose 8% to $20.3 billion, driven by higher card balances and wealth management fees. Commercial & Investment Bank revenue increased 27% to $24.9 billion on strong investment banking and trading activity, while Asset & Wealth Management grew 19% to $6.9 billion as assets under management surpassed $5 trillion. The Corporate segment benefited from one-time gains related to Visa shares and equity investments. Overall, the results highlight the strength of JPMorgan's diversified business model The Commercial & Investment Bank remained the largest earnings contributor, generating $9.7 billion of net income, nearly half of firmwide profits Profitability remained exceptional -Net income: $21.2 billion (+41%) -ROE: 24% -ROTCE: 29% -ROTCE excluding significant items: 23% -Reported overhead ratio: 48% Expense growth (+15%) largely reflected revenue linked compensation rather than operating deleverage, suggesting the firm's cost structure remains highly variable in investment banking and markets. Diluted EPS reached $7.70, increasing 47% YoY Excluding one time gains from Visa shares and equity investments, EPS was $6.14, still representing very strong underlying profitability Capital deployment remained aggressive: -$4.0B common dividends -$6.2B share repurchases -73% last twelve month payout ratio JPMorgan's balance sheet remains one of the strongest globally Key metrics include: -$5.0 trillion assets -$375 billion equity -$1.5 trillion cash and marketable securities -CET1 ratio: 14.1% -Average loans +10% YoY -Average deposits +7% YoY Management instead emphasized continued constructive investment banking activity while cautioning about geopolitical risks, sticky inflation, elevated asset prices, and fiscal deficits. What Drove the Quarter? The headline earnings benefited from two distinct forces: extraordinary capital markets activity and continued strength in the core banking franchise The largest contributor was market activity Markets revenue increased 35%, with Equity Markets surging 86%, reflecting elevated client trading activity, financing demand, and strong execution across products and regions. Investment banking also rebounded sharply, with fees climbing 30% to the highest level since 2021 The second driver was balance sheet growth Average loans expanded 10%, while deposits increased 7%, supporting higher net interest income despite lower interest rates. Credit card revolving balances remained healthy, and payments activity continued expanding A third contributor came from wealth management Assets under management surpassed $5 trillion, rising 18%, while long term net inflows totaled $50 billion. Higher market levels combined with inflows generated recurring management fees, creating one of the highest quality revenue streams in the company. Finally approx. $5.6 billion of pre tax gains from Visa shares and certain equity investments materially boosted reported earnings. While economically valuable, these gains are non recurring and should not be extrapolated into future operating performance Management highlighted that every major business line generated record revenue, something few global banks have achieved simultaneously. Investment banking recovered to levels not seen since the post-pandemic capital markets boom, while wealth management crossed the symbolic $5 trillion AUM threshold. Importantly, these records occurred despite lower interest rates than the prior year Earlier in the rate cycle, investors viewed JPMorgan primarily as a beneficiary of expanding net interest margins. Q2 2026 demonstrates that earnings power has become increasingly diversified. Today, the company is generating record profits from: -investment banking -trading -payments -wealth management -consumer banking -commercial lending rather than relying on a single macro factor That diversification fundamentally changes how investors should think about earnings durability JPMorgan Is Building the World's Most Complete Financial Platform The quarter illustrates an important strategic evolution JPMorgan is no longer simply the largest US bank JPMorgan is evolving into a diversified financial platform where consumer banking, payments, lending, investment banking, and wealth management reinforce one another through deep customer relationships. This integrated ecosystem creates cross-selling opportunities, strengthens recurring fee income, and makes earnings less dependent on interest rate cycles. As the platform scales, each business fuels growth in the others, creating a durable competitive advantage that is difficult for rivals to replicate Rather than maximizing quarterly profitability, JPMorgan continues investing aggressively in technology, advisors, payments infrastructure, and front office talent even when those investments pressure expenses. The firm appears willing to sacrifice some short-term operating leverage to strengthen long term competitive positioning. Expense growth this quarter was concentrated in compensation, technology, marketing, and distribution, consistent with that strategy The earnings reinforce that JPMorgan's business model is shifting toward a higher proportion of recurring, fee-based revenue alongside traditional spread income. Wealth management, payments, securities services, and advisory businesses reduce dependence on interest rate cycles. JPMorgan's moat increasingly rests on scale across interconnected businesses Few competitors possess simultaneous leadership in: -consumer banking -investment banking -trading -payments -commercial banking -asset management This breadth creates cross selling opportunities that are difficult to replicate The bullish case is that earnings become structurally more resilient as revenue sources diversify and platform effects deepen The bearish case is that exceptional capital markets conditions and one-time gains inflated reported results. If trading activity normalizes or dealmaking slows, earnings growth could moderate meaningfully. The broader banking industry remains in transition Large universal banks continue benefiting from elevated market volatility, renewed equity issuance, and recovering M&A activity. Meanwhile, regional banks remain more exposed to traditional lending spreads and commercial real estate risks Competition in wealth management is intensifying as firms seek to capture affluent client assets. JPMorgan's continued advisor hiring and strong inflows suggest it is gaining share in this attractive market Payments remains another structural growth area. Corporate clients increasingly demand integrated treasury, cross-border settlement, and securities servicing capabilities. JPMorgan's scale in Payments and Securities Services positions it well as transaction volumes expand.. Macro conditions remain mixed. Management cited supportive factors such as AI driven capital investment, fiscal stimulus, and resilient hiring, but also warned about geopolitical tensions, persistent inflation, elevated asset prices, and large fiscal deficits. Those crosscurrents could influence credit quality, capital markets activity, and client risk appetite in future quarters JPMorgan enters the second half of 2026 from a position of strength Current strengths include: -Industry leading investment banking franchise -Dominant trading platform -Massive low-cost deposit base -Leading payments network -Rapidly growing wealth management platform -Fortress balance sheet with strong capital ratios Emerging threats include: -Slowing capital markets after an unusually strong period -Lower interest rates compressing net interest margins -Rising technology investment requirements -Fintech competition in consumer payments -Regulatory capital changes affecting returns The firm's diversified business mix helps offset many of these risks, but investors should not assume every segment can outperform simultaneously every quarter. What to Watch Next Investment Banking Pipeline A sustained recovery in IPOs, M&A, and debt issuance would support continued fee growth. A slowdown could quickly affect one of the quarter's strongest businesses Markets Revenue Normalization Trading results were exceptional. Investors should watch whether elevated client activity proves durable or fades as market volatility subsides Net Interest Income Loan growth remains healthy, but lower interest rates may continue to pressure net interest income. The balance between volume growth and margin compression will be important Wealth Management Flows Crossing $5 trillion in AUM is significant, but sustained net inflows matter more than market appreciation because they support recurring fee revenue Expense Discipline Technology, marketing, and compensation investments support long-term growth, but investors will monitor whether revenue continues to outpace expense growth Credit Quality Net charge offs and reserve trends remain relatively stable, but any deterioration in consumer or commercial credit could alter the earnings outlook JPMorgan's second quarter was not simply another earnings beat boyz it underscored the firm's evolution into a diversified financial platform whose earnings power extends well beyond interest rate dynamics. Record revenue across every major business, robust loan and deposit growth, a resurgence in investment banking, and continued expansion in wealth management all point to a franchise with multiple engines of value creation.
NYSE:JPMLong
by moonypto
Shoulder Innovations, Inc. (SI) Advances Shoulder ImplantsShoulder Innovations, Inc. (SI) develops advanced shoulder replacement implants and surgical technologies designed to improve outcomes and simplify procedures for surgeons. The company grows by expanding adoption of its implant systems, increasing surgeon training, and benefiting from rising demand for orthopedic procedures as the population ages and stays active longer. On the chart, SI printed a confirmation bar with increasing volume as price moved above the .236 Fibonacci level and into the momentum zone. A trailing stop can be established using Fibonacci levels on the Fibonacci snap tool, helping manage risk while allowing momentum to continue.
NYSE:SILong
by traderspro_charts
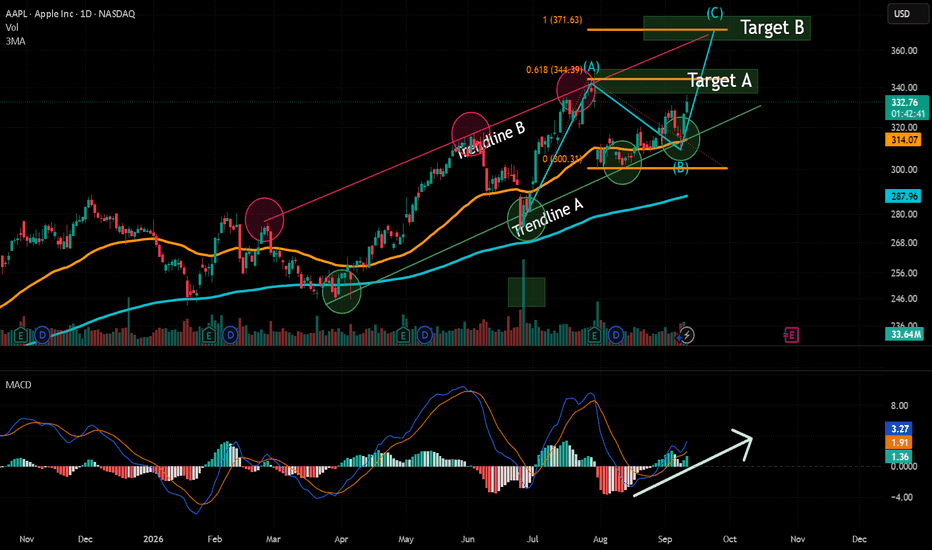
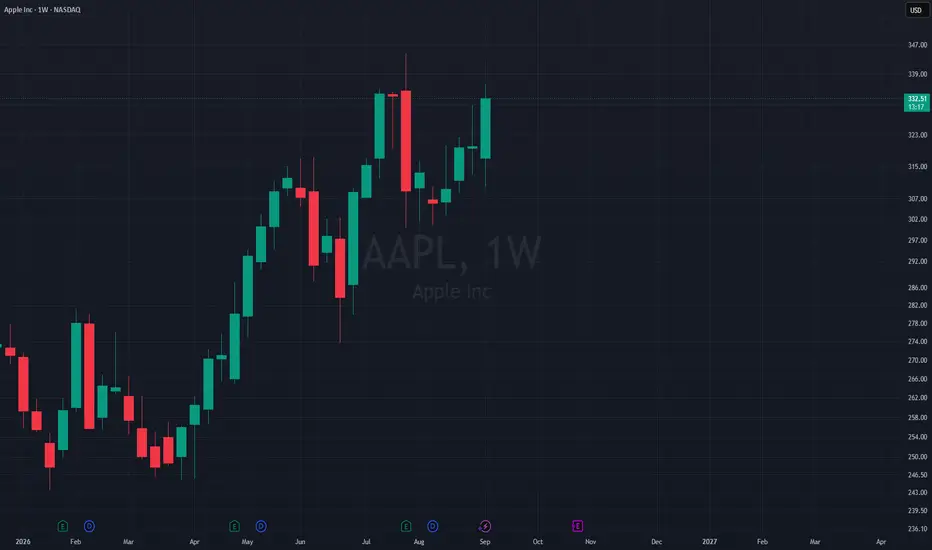
AAPL TRADE IDEA JULY 14 BRADROC TRADING AAPL Trade Idea – July 14, 2026 AAPL looks interesting to me today. After yesterday's price action, I'm going to be watching buying and selling pressure closely. I think there's a good chance we get a nice trending move once one side takes control. The main range I'm watching is 317 down to 312. Inside this $5 window, I wouldn't be surprised to see buyers and sellers battle for control as price chops around. If that happens, there could be some really nice timed scalp opportunities, especially between 315.50 and 313.13.. Put Idea If sellers can break and hold below 313.13-313, the next area to watch is 312-311. I expect buyers to put up a fight there, pay attention to how price reacts. If sellers win that battle and push below 311, I'm looking for a move toward 305. (TP targets 310.34, 309.03, 308, 306-305 Remember, there's nothing wrong with taking profits along the way. How long you stay in the trade should depend on your contract expiration, your risk, and what price is doing—not just your profit target. Call Idea Keep an eye on 317, though. That's still a level I'm watching, and I expect sellers to defend it. If buyers can break through 317 and hold above it, then I'm looking for a $6 move back toward 323. My goal is to keep these trade ideas simple without all the complicated trading terminology that can overwhelm newer traders. This is not financial advice—it's simply how I see the market based on my analysis. Trading involves risk, so always do your own research, manage your risk, and trade responsibly
NASDAQ:AAPL
by Bradroc
PLTR Long-Term BullishPublished a prior chart on PLTR but thought I could do better and add a bit more clarity PLUS include two (2) possible scenarios that may play out. This stock has some solid relationships behind the scenes so expect any pullback to be simply related to a short-term consolidation move.
PLong
by kerdirks
Updated
Netflix earnings will hit my target pinpoint! I have recently discovered what I believe to be a unique ability to map and predict movements in Gold, silver ,Usa 30 , oil . Doller index . And many others across all three trading sessions, and many other charts—despite having had no prior knowledge of the companies or markets involved. I am currently trying to understand and develop this ability further. . GIVE ME SOMETHING TO MAP!!! TEST ME!!! I HAVE NO DEGREE'S, SLEF TAUGHT!
NASDAQ:NFLX
by blackwhite121
NVDA Is Defending 202.20 After The Drop.NVDA Is Defending 202.20 After The Drop. Nvidia lost 207.59 and dropped 3.52 percent into 202.20, the breakout level off the base. It is defending that line so far and has bounced to 205.40, but the hourly just printed an NR7 - the tightest range in seven bars, a compression that resolves into an expansion - and the daily is reading PANIC. A bounce into resistance on shrinking range is not strength yet. The whole story is whether 202.20 holds. Resistance: 207.59 - the level lost on the drop Key resistance: 211.10 - the recent swing high Current price: 205.40 Support: 202.20 - the breakout level, the line in the sand Key support: 200.00 - round-number shelf below Structural floor: 190.60 - the range low Two paths from here: The line holds and NVDA reclaims. If 202.20 defends and price takes back 207.59, the drop reads as a failed breakdown and the base is still intact. The bounce is already underway; a reclaim of 207.59 confirms it and puts 211.10 back in view. The line breaks and the trend cracks. The daily is in PANIC and the NR7 says a bigger move is loading. A loss of 202.20 on a close confirms the breakdown and drops price out of the base toward the next shelf. NR7 tells you the move is coming; 202.20 tells you which way to trust it. A tight coil sitting right on the most important level is the market asking a question, not answering it. 202.20 is the answer, and it comes on a close. Built with SYNTHESIS v3.3 | SOM / ACE / IMP / SYNTHESIS Study, not financial advice.
NASDAQ:NVDA
by virDeStatera
The Music's Not Over: Spotify's Setup for a Breakout RallyNYSE:SPOT Spotify (SPOT): Fundamentals Confirm the Technical Setup - A Wave 5 Rally Ahead? Spotify has been in a well-defined ascending trend since its 2018 IPO, consistently respecting a long-term support and resistance channel. The one major exception was 2022–2024 (Wave 0 on the chart), when the stock lost that support entirely, a drawdown driven by the broader 2022 tech sell-off (rising rates crushing valuations on unprofitable growth names) compounded by Spotify-specific concerns: negative gross margins in the ad-supported segment, decelerating premium subscriber growth, and mounting losses that spooked investors focused on the company's path to profitability. Once the trendline was reclaimed, price rallied through Waves (1)–(2)–(3), testing the resistance of that long-term channel for a third time at the Wave (3) peak in June 2025, before correcting back down toward trendline support in Wave (4). As of now, SPOT is sitting right on the trend's support, which also aligns with the prior all-time high, now acting as support-turned-resistance-turned-support, having tested the 200-week EMA twice on the weekly chart and held both times. The MACD has just confirmed a bullish crossover, signaling building momentum, and we believe Spotify is poised to begin its Wave (5) rally from here. Under Elliott Wave theory, this reading places Spotify at the tail end of a Wave 4 correction, with the final impulsive Wave 5 leg now underway. Multiple signals are lining up here, trendline support, double 200-week EMA confirmation, MACD momentum, and Elliott Wave structure, all pointing to a bullish setup. The fundamentals back up the chart. Spotify's pricing power remains intact, ARPU is guided up 7-7.5% year-over-year, driven by a fresh round of subscription price hikes across the U.S., Estonia, and Latvia in January, following an even broader wave of increases across Europe, Latin America, the Middle East, and Asia-Pacific in late 2025. The advertising business is also inflecting: programmatic ad sales now make up more than a third of total ad revenue and are growing quickly, and management has said the recently completed ad-stack rebuild positions the company to convert rising ad-supported engagement into real gross margin gains going forward. On top of that, new monetization layers are coming online, an AI-powered remix and cover tool launching as a paid premium add-on in partnership with Universal Music, plus continued expansion into audiobooks, podcasting, and fitness content. Wall Street's read reflects this: the analyst consensus sits at Strong Buy, with roughly 34 Buy ratings and zero Sell ratings, and Bank of America named Spotify one of its top Q3 picks, citing improved visibility into continued profit and free-cash-flow growth. We're not chasing yet, though: we want to see price break and hold above the descending resistance line drawn off the Wave (4) before treating this as confirmed. Until that breaks, this remains a setup to watch, not a trade to press.
NYSE:SPOTLong
by Vasileios_Kairaktidis
SPCX short-term TAThere's not much to say about SpaceX as of this moment, they've recently had their IPO and as many other IPOs in the history a few weeks later it's starting to correct. Currently the short-term volume and momentum are both bearish, which technically means the sellers are in control. We have to give it some time to consolidate and find the bottom.
NASDAQ:SPCXShort
by MoxGo_Analytics
SNDKSanDisk has been a monster for a year now.. people have been calling its top for nearly every last month but it continues to grow, and, technically the trend hasn't been broken ever since, yes it's kind of congestion right now but the trend momentum is still there and currently we're having a healthy support test during the correction, this could be a great area to re-load and continue the bullrun. Keep an eye on SNDK.
NASDAQ:SNDKLong
by MoxGo_Analytics
66
CNXU - Bulls Challenge Resistance!Conexeu Sciences continues reporting progress across its regenerative-tissue platform, including recent preclinical, manufacturing, and regulatory-development activities.🧬 📌 From a technical perspective, NASDAQ:CNXU has remained overall bearish, trading within the falling wedge pattern marked in red. However , downside momentum appears to be weakening. While price continued forming lower lows, the MACD recorded two bullish divergence signals by forming higher lows. This divergence indicates that bearish momentum is losing strength and serves as an early alert that a potential bullish reversal may be developing.📈 📊 Volume has also supported this observation. Trading activity increased around the recent lows while the divergences were forming, showing stronger market participation near the lower boundary of the wedge.👀 🎯 What’s Next? For bulls to take control and confirm a broader momentum shift, CNXU needs a decisive breakout and close above the highlighted blue structure around $11.50. Until that confirmation occurs, the falling wedge and the broader bearish structure remain active. If buyers successfully reclaim the blue resistance zone, the first bullish objective would be the current all-time high around $18.50. A confirmed break above that all-time high would move CNXU into price discovery, where no established historical resistance would remain above price.📈 📌From a fundamental perspective, investors will likely continue monitoring the company’s lead CXU™ wound-care program , its planned FDA 510(k) submission process, the completed preclinical P.R.O.O.F. study, and the ongoing development of its investigational B.R.E.A.S.T.™ bioregenerative matrix platform.🔬 In brief, CNXU remains technically bearish below the $11.50 structure. However, the falling wedge, bullish MACD divergences, and increased volume near the recent lows suggest that selling momentum may be weakening. A confirmed breakout above resistance is still required before bulls can claim control.✅ ⚠️Disclaimer: This analysis is provided for informational and educational purposes only. It does not constitute financial advice, investment advice, or a recommendation to buy or sell any security. Technical and fundamental conditions can change, and no outcome is guaranteed. Always conduct your own research and manage risk appropriately. Good luck! All Strategies Are Good; If Managed Properly! ~Richard Nasr
NASDAQ:CNXULong
by TheSignalyst
1414
Walmart (WMT): An Overdone Sell-Off Creates a Buying OpportunityThe recent decline in Walmart shares appears excessive relative to the company’s strong operating performance. The correction has pushed WMT’s valuation multiples back toward their two-year median levels, creating an attractive entry point in a market leader that continues to gain share across all income groups and appears to be moving beyond the peak in margin pressure. Ticker: #WMT Price at the time of analysis: $113.90 Target price: $130.00 Stop-loss: $105.00 Key Arguments Supporting the Investment Idea The recent sell-off appears overdone given Walmart’s strong fundamentals. Walmart remains well positioned to continue gaining market share. The most significant margin pressure from pricing investments appears to have passed, with operating profit growth expected to accelerate in the second half of the year. The technical setup suggests that the stock is oversold, with early signs of a trend reversal emerging. Walmart is the world’s largest retailer by revenue, operating approximately 11,000 stores across 19 countries under the Walmart and Sam’s Club brands. Around 60% of its U.S. sales come from groceries, making the business relatively resilient to fluctuations in consumer spending. In addition to its traditional retail operations, Walmart is actively expanding its higher-margin businesses, including advertising, its online marketplace, the Walmart+ subscription program, and fintech services. Key Investment Theses The Scale of the Sell-Off Is Not Supported by Walmart’s Fundamentals WMT shares have declined 5.5% over the past month and 10.2% over the past quarter. The stock has significantly underperformed both the consumer staples sector and the broader market. Over the same periods, the XLP ETF declined 1.6% over the past month but gained 2.1% over the past quarter. The S&P 500 advanced 4.2% and 11.1%, respectively. The sell-off began after Walmart reported its results for the first quarter of fiscal 2027. Although revenue and comparable sales exceeded consensus expectations, investors were disappointed that the company did not raise its full-year guidance. Management also sounded cautious about sentiment among lower-income consumers amid rising fuel prices. However, management said the pressure was “more about sentiment than behavior.” Walmart reaffirmed its full-year constant-currency revenue growth forecast of 3.5%–4.5% and now expects growth to come in near the upper end of that range. Walmart Is Well Positioned to Continue Gaining Market Share U.S. comparable sales increased 4.1% year over year in the first quarter, while customer traffic growth accelerated to 3.0%. Transaction growth reached its highest level in six quarters, and Walmart’s market-share gains in the general merchandise category were the strongest in five years. The company is gaining share across all customer income groups. Higher-income consumers are a key source of these gains. Historically, this group has been less loyal to discount retailers and more likely to return to traditional retailers as economic conditions normalize. In the current cycle, Walmart’s focus on convenience-including delivery, e-commerce, and Walmart+-is helping the company retain these customers. According to management, new customers are converting into Walmart+ subscribers more quickly, improving retention within Walmart’s ecosystem and supporting its higher-margin businesses. U.S. e-commerce revenue increased 26% year over year, while advertising revenue grew 44%. Advertising and membership fees now account for approximately one-third of Walmart’s operating profit. Management expects the market-share gains achieved in the first quarter to support stronger sales growth in the second half of the year. The normalization of grocery inflation should provide an additional tailwind. The drag from falling egg prices, which reduced first-quarter grocery sales growth by approximately 130 basis points, is gradually fading. The First Quarter Marked the Peak in Margin Pressure Walmart absorbed approximately $175 million in additional fuel-related costs during the first quarter. The company deliberately chose not to pass these costs on to customers in order to strengthen its price leadership. The number of products offered at temporarily reduced prices, known as “rollbacks,” increased by more than 20% year over year. Fuel-related cost pressure is expected to continue in the coming quarters, but its net impact on margins should gradually decline. Beginning in the second quarter, Walmart plans to pass some of these costs on through higher retail prices. At the same time, the impact of last year’s elevated health insurance costs will begin to roll off. Management has indicated that the first quarter should represent the low point for adjusted operating profit growth, which reached 5% year over year in constant currency. The company expects adjusted operating profit growth to accelerate to 6%–8% for the full year, supported by growing contributions from its marketplace business and supply-chain efficiencies. The Technical Setup Suggests the Stock Is Oversold Walmart shares have fallen below both their 50-day and 200-day moving averages. The recent decline also occurred without any significant negative company-specific news. Following the correction, Walmart’s valuation multiples have moved back toward their two-year median levels: NTM P/E: 37.1x versus a two-year median of 35.9x NTM EV/EBITDA: 19.2x versus a two-year median of 18.4x These levels may offer an attractive entry point for long-term investors and make the stock more compelling following the recent decline. Early signs of a trend reversal are already emerging. Walmart shares have rebounded approximately 5% from their eight-month low, suggesting that the recovery may be gaining momentum. Conclusion We expect WMT shares to reach $130 and rate the stock a Buy. We recommend setting a stop-loss at $105. TAGs # - FreedomHolding, FreedomBroker, AnalystBondarets #WMT #Walmart #USStocks #Retail #ConsumerStaples
NASDAQ:WMTLong
by FreedomHolding
Netflix Earnings Preview: A Blockbuster Quarter or a Plot Twist Netflix is one of the key stocks I’m watching this earnings season. The company has already proven that it can generate strong profits and cash flow, so the question is no longer simply whether Netflix can grow. The bigger question is whether it can grow fast enough to meet increasingly high market expectations. For this earnings release, I would pay close attention to revenue growth, the progress of its advertising business, and especially management’s forward guidance. A strong earnings beat combined with better guidance could reinforce the bullish trend, but if growth starts to slow or margins disappoint, the stock could see significant volatility. From a trader’s perspective, I wouldn’t try to predict the earnings result itself. I would rather wait for the market reaction and see whether the post-earnings move confirms continuation or creates a potential reversal opportunity. In the above video recording we combined the technical price action as a confirmation factor to establish our directional bias moving forward post earnings release.
NASDAQ:NFLX
03:57
by Bitget
11
112233445566778899101011111212131314141515161617171818191920202121222223232424252526262727282829293030313132323333343435353636373738383939404041414242
…999999

Made by humans

Select market data provided by ICE Data Services. Select reference data provided by FactSet. Copyright © 2026 FactSet Research Systems Inc.Copyright © 2026, American Bankers Association. CUSIP Database provided by FactSet Research Systems Inc. All rights reserved. SEC filings and other documents provided by Quartr.© 2026 TradingView, Inc.

More than a product
  • Supercharts
Screeners
  • Stocks
  • ETFs
  • Bonds
  • Crypto coins
  • CEX pairs
  • DEX pairs
  • Pine
Heatmaps
  • Stocks
  • ETFs
  • Crypto coins
Calendars
  • Economic
  • Earnings
  • Dividends
  • IPOs
More products
  • News Flow
  • Portfolios
  • Fundamental Graphs
  • Yield Curves
  • Options
  • Macro Maps
  • Pine Script®
Apps
  • Mobile
  • Desktop
Community
  • Social network
  • Wall of Love
  • Refer a friend
  • House Rules
  • Moderators
Ideas
  • Trading
  • Education
  • Editors' picks
Pine Script
  • Indicators & strategies
  • Wizards
  • Freelancers
  • Paid Spaces
Tools & subscriptions
  • Features
  • Pricing
  • Market data
  • Gift plans
Trading
  • Overview
  • Brokers
  • Brokers comparison
  • The Leap
Special offers
  • CME Group futures
  • Eurex futures
  • US stocks bundle
About company
  • Who we are
  • Space mission
  • Blog
  • Help Center
  • Careers
  • Media kit
Merch
  • TradingView store
  • Tarot cards for traders
  • The C63 TradeTime
Policies & security
  • Terms of Use
  • Disclaimer
  • Privacy Policy
  • Cookies Policy
  • Accessibility Statement
  • Security tips
  • Bug Bounty program
  • Status page
Business solutions
  • Widgets
  • Charting libraries
  • Lightweight Charts™
  • Advanced Charts
  • Trading Platform
Growth opportunities
  • Advertising
  • Brokerage integration
  • Partner program
  • Education program
Community
  • Social network
  • Wall of Love
  • Refer a friend
  • House Rules
  • Moderators
Ideas
  • Trading
  • Education
  • Editors' picks
Pine Script
  • Indicators & strategies
  • Wizards
  • Freelancers
  • Paid Spaces
Business solutions
  • Widgets
  • Charting libraries
  • Lightweight Charts™
  • Advanced Charts
  • Trading Platform
Growth opportunities
  • Advertising
  • Brokerage integration
  • Partner program
  • Education program
Look FirstLook First