Long
Long
 Short
Short
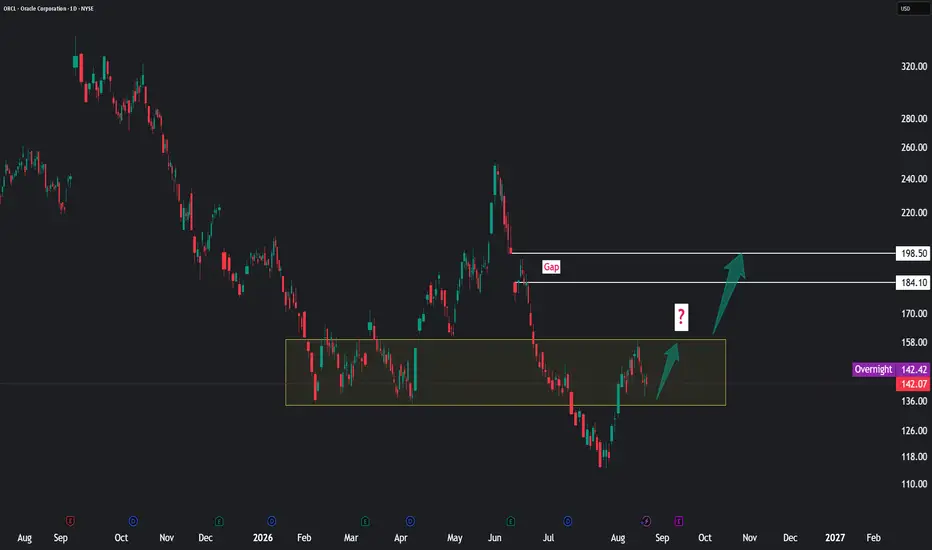
ORCL — Relief Rally Stalls Below Major ResistanceOracle closed at $142.07 on August 20, 2026. The stock has recovered strongly from the $114.50 low, but the rebound was rejected at $159.26 and has now entered a consolidation phase.
The short-term picture is neutral, while the broader daily trend remains bearish. Price is sitting near the 20-day EMA at $142.92, but remains below the 50-day SMA at $146.52, the 100-day SMA at $164.37, and the 200-day SMA at $173.63. TradingView’s broader moving-average rating also remains bearish. TradingView technical summary
RSI is neutral at approximately 48.8, while MACD remains above its signal line. This suggests that some rebound momentum is still present, but buyers have not yet regained control. With a daily ATR near $7.11, volatility remains elevated.
Key resistance levels
- $146.50–$148.70: immediate resistance and 50-day SMA area
- $152.00–$159.26: major supply zone and recent swing high
- $164.40–$173.60: long-term moving-average resistance
Key support levels
- $141.00–$137.40: immediate support zone
- $128.80–$125.00: secondary support
- $120.00–$114.50: major demand zone and structural low
Bullish scenario
A daily close above $148.70 would improve the short-term structure and could trigger a move toward $152.00, followed by $159.26.
A sustained breakout above $159.26 would provide stronger trend-reversal confirmation, opening the way toward $164.40 and potentially $173.60.
Bearish scenario
A daily close below $137.40 would invalidate the immediate recovery attempt and expose $128.80–$125.00.
If that zone fails, the market could revisit $120.00 and the major $114.50 low. A breakdown below $114.50 would confirm the continuation of the broader bearish structure.
Fundamental context
Oracle’s cloud growth remains impressive: FY2026 cloud revenue increased 39%, while remaining performance obligations reached $638 billion. However, the company also reported negative $23.7 billion in free cash flow, reflecting the enormous investment required to expand its AI infrastructure. Oracle FY2026 results
Conclusion
ORCL is attempting to build a base, but the rebound is not yet a confirmed trend reversal. The decisive range is now $137.40–$148.70:
- Above $148.70: bullish recovery gains credibility.
- Above $159.26: broader reversal confirmation.
- Below $137.40: bearish continuation risk returns.
This analysis reflects a personal market view and is not financial advice.
Share your thoughts in the comments section of the title. I'm interested in hearing your opinion on this topic.
Thank you in advance.
Laurent
✅ DL INVEST | Community Leader $MCHP: Wave (5) Completed — False Breakout, Triggers Pullback📉 📉 📉
The semiconductor sector has enjoyed an incredible run, but sophisticated capital tracks when the trend exhausts.
If you are looking for an aggressive momentum pivot to compound capital, Microchip Technology Inc.
#MCHP is presenting a textbook structural short setup.
The daily chart shows a clean, completed macro 5-wave Elliott structure.
Friday's aggressive breakdown volume has officially confirmed a structural bull trap.
1. The Technical Setup: False Breakout & Liquidity Sweep Looking closely at the daily structure price finished its multi-month expansion at Wave (5), briefly sweeping liquidity just above the 105.38 High.
The Trap: MCHP attempted to sustain momentum above the vital 2024 high of 95.25, but completely failed to attract institutional follow-through.
Instead, it formed a massive distribution cluster.
The Confirmation: Friday’s -8.27% liquidation event slammed price straight down to 88.34. In a single daily session, sellers wiped out weeks of grinding price action, plunging straight back below the 95.25 structural floor on massive volume expansion.
The trap has sprung.
2. The Fundamental Catalysts: Re-Rating Premium Valuations.
A technical trap needs macro headwinds to sustain a downward move.
Friday gave us the ultimate fundamental double-whammy: The Sector Overhang: Broadcom's recent guidance data reset expectations regarding the blistering pace of macro #hyperscaler and #AI chip spending.
This removed a core growth catalyst that was keeping high-multiple semiconductor stocks afloat.
The Discount Rate Shift: Friday’s stronger-than-expected US jobs report (172,000 payrolls) effectively crushed immediate hopes for interest rate cuts.
Stocks trading at premium multi-year forward P/E valuations are hyper-sensitive to these macro discount rate changes.
When rate cuts are delayed, high-multiple semi valuations contract rapidly.
🎯 Tactical Short Execution Plan
Because the daily candle closed right at its session lows (88.34), shorting directly into the hole carries near-term execution risk if the broader index attempts a Monday morning relief bounce.
We want to execute on a low-volume retest of the broken floor.
The Entry Zone: Look to establish a short position on a lower-timeframe dead-cat bounce back toward the 91.50 – 93.00 cluster (retesting the breakdown value area).
The Stop Loss (Invalidation): Strict stop placement on a daily close back above 95.25 (the broken 2024 high line).
If the bulls manage to re-claim this level, the bearish thesis is instantly invalidated and we preserve capital.
Take Profit (TP) Target 1: The pink consolidation zone between 80.00 and 83.00.
This marks the peak of the previous Wave (3) cluster and serves as natural structural support.
Take Profit (TP) Target 2: The blue structural liquidity pool down at 68.00 if the tech sector encounters a deeper macro ABC correction.
💬 What's Your View on Semis?
Is MCHP signalling a broader tech rotation, or do you think the dip buyers step back in at the 80s support block?
Drop your targets and perspectives in the comments section below!
If you want to follow the compounding journey and catch updates on this short trade, make sure to hit that Follow button!
(Disclaimer: Not financial advice.
Manage your risk according to your own capital allocation rules.
If you don't have any Rules make them before entering financial markets)  Short
Short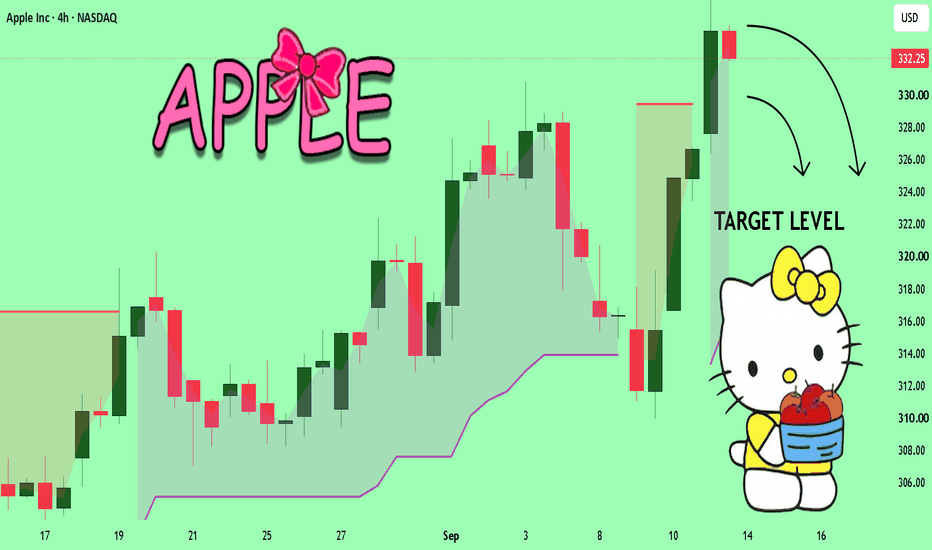
 Long
Long
 Short
Short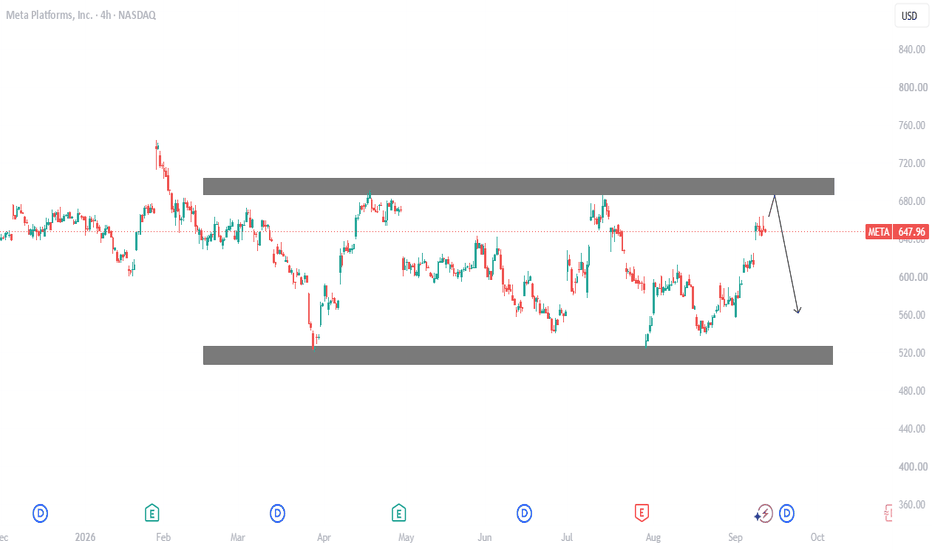
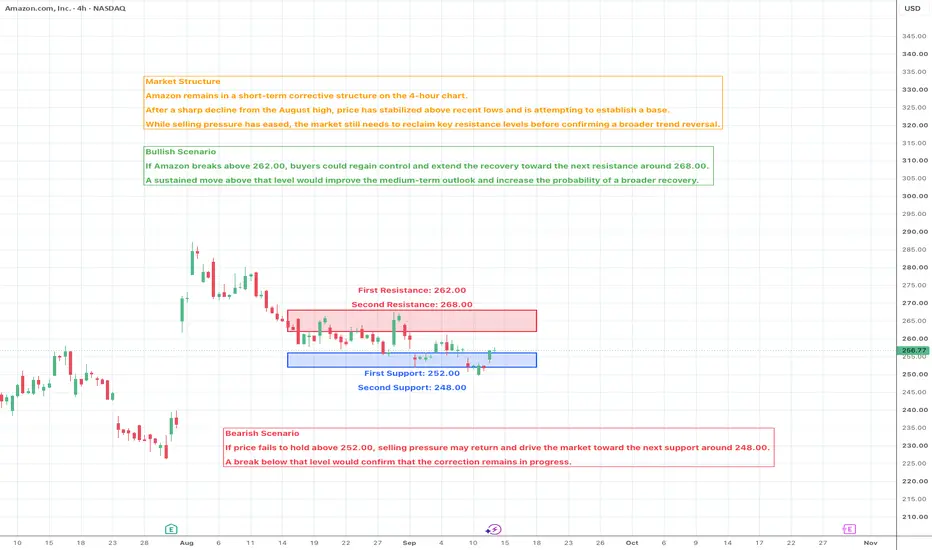
Amazon — Can Buyers Build a Stronger Recovery?Market Structure
Amazon remains in a short-term corrective structure on the 4-hour chart. After a sharp decline from the August high, price has stabilized above recent lows and is attempting to establish a base. While selling pressure has eased, the market still needs to reclaim key resistance levels before confirming a broader trend reversal.
Market Sentiment - Neutral to Moderately Bullish
Market sentiment has improved from recent weakness and is shifting toward neutral to moderately bullish. Buyers are showing signs of returning near support, but stronger follow-through is needed to confirm that momentum has fully turned.
Bullish Scenario
If Amazon breaks above 262.00, buyers could regain control and extend the recovery toward the next resistance around 268.00. A sustained move above that level would improve the medium-term outlook and increase the probability of a broader recovery.
Bearish Scenario
If price fails to hold above 252.00, selling pressure may return and drive the market toward the next support around 248.00. A break below that level would confirm that the correction remains in progress.
────────────────────
Market Outlook
Amazon is attempting to recover after a prolonged pullback, but price is still trading below key resistance. The recent rebound is encouraging, although confirmation from a higher high is still required before a stronger bullish outlook can be established.
────────────────────
Key Levels
First Resistance: 262.00
Second Resistance: 268.00
First Support: 252.00
Second Support: 248.00
────────────────────
Future Scenarios
A sustained move above the First Resistance would indicate improving buying momentum and could open the way toward the Second Resistance.
However, if price breaks below the First Support, sellers may regain control and extend the correction toward the Second Support.
────────────────────
Event Risk
Amazon's short-term direction may continue to be influenced by overall U.S. equity market sentiment, interest rate expectations, consumer spending data, cloud computing developments, and company-specific news.
However, price action remains the key indicator. If positive news cannot push price above the First Resistance, upside momentum may remain limited. Conversely, if Amazon breaks below the First Support despite supportive market conditions, it would suggest sellers are regaining short-term control.
────────────────────
Please share your view below:
Do you think Amazon has completed its correction, or is another leg lower still possible?
More market structure and key level updates will be shared regularly. Tesla — Can Buyers Push Toward the Next Breakout?Market Structure
Tesla is maintaining a short-term bullish structure on the 4-hour chart. After forming a higher low from the late-August pullback, price has recovered steadily and is now consolidating just below a recent swing high. The sequence of higher highs and higher lows remains intact, suggesting buyers still have the upper hand.
Market Sentiment - Moderately Bullish
Market sentiment is moderately bullish. Buying momentum has improved over the past two weeks, while the current consolidation appears more like a pause after the recent recovery than a trend reversal. Bulls remain in control unless key support is lost.
Bullish Scenario
If Tesla breaks above 372.00, buyers could regain momentum and push the price toward the next resistance around 382.00. A sustained breakout above that level would reinforce the bullish structure and expose the previous major swing high near 437.00 over the medium term.
Bearish Scenario
If price falls below 360.00, short-term bullish momentum could weaken and trigger a deeper pullback toward 348.00. Losing that support would shift the near-term outlook into a broader corrective phase.
────────────────────
Market Outlook
Tesla continues to trade within a recovering uptrend after rebounding strongly from its August lows. The current consolidation below resistance suggests the market is waiting for the next catalyst before choosing direction. As long as higher lows continue to hold, the overall bias remains constructive.
────────────────────
Key Levels
First Resistance: 372.00
Second Resistance: 382.00
First Support: 360.00
Second Support: 348.00
────────────────────
Future Scenarios
A decisive move above the First Resistance would confirm renewed buying strength and could extend the rally toward the Second Resistance.
On the other hand, a break below the First Support would increase selling pressure and may lead to a test of the Second Support.
────────────────────
Event Risk
Tesla's short-term price action may continue to be influenced by overall U.S. equity market sentiment, interest rate expectations, EV industry developments, and company-specific news.
However, price action remains the key indicator. If positive catalysts fail to lift price above the First Resistance, upside momentum may remain limited. Conversely, if Tesla breaks below the First Support despite supportive market conditions, it would suggest sellers are gaining short-term control.
────────────────────
Please share your view below:
Do you think Tesla is preparing for another breakout, or will resistance trigger a deeper pullback?
More market structure and key level updates will be shared regularly. NVIDIA — Is This Just a Healthy Correction?Market Structure
NVIDIA remains in a medium-term bullish structure despite the recent pullback on the 4-hour chart. After printing a new swing high, price has retraced toward a previous demand zone. Higher lows are still intact, suggesting the broader uptrend has not yet been invalidated.
Market Sentiment - Moderately Bullish
Market sentiment remains moderately bullish. Although short-term profit-taking has increased, buyers continue defending key support levels. Unless support breaks decisively, the overall bias still favors the upside.
Bullish Scenario
If NVIDIA holds above 218.00 and reclaims 228.00, buying momentum could return and drive price back toward the recent high around 234.00. A breakout above that level would confirm renewed bullish strength and could open the door for further gains.
Bearish Scenario
If price breaks below 218.00, the current correction may extend toward the next support around 210.00. Losing that level would weaken the current bullish structure and increase the probability of a deeper pullback.
────────────────────
Market Outlook
NVIDIA is currently correcting after a strong rally, but the broader trend remains constructive. As long as buyers continue defending support, this pullback may simply represent a pause before the next directional move.
────────────────────
Key Levels
First Resistance: 228.00
Second Resistance: 234.00
First Support: 218.00
Second Support: 210.00
────────────────────
Future Scenarios
A sustained move above the First Resistance would suggest buyers are regaining control and could push price toward the Second Resistance.
However, if price falls below the First Support, selling pressure may increase and lead to a test of the Second Support.
────────────────────
Event Risk
NVIDIA's short-term direction may continue to be influenced by overall U.S. equity market sentiment, Treasury yields, AI sector developments, semiconductor industry news, and company-specific catalysts.
However, price action remains the most important signal. If positive news cannot lift price above the First Resistance, upside momentum may remain limited. Conversely, if NVIDIA breaks below the First Support despite supportive market conditions, it would suggest sellers are gaining short-term control.
────────────────────
Please share your view below:
Do you think NVIDIA can resume its uptrend from current support, or is a deeper correction still ahead?
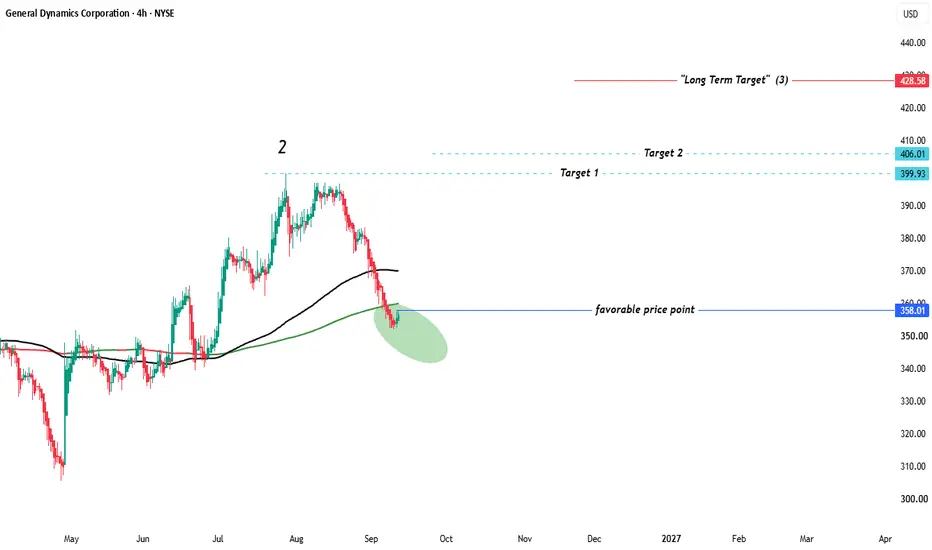
More market structure and key level updates will be shared regularly. General Dynamics Corporation. GD**General Dynamics Corporation**
General Dynamics Corporation is a major U.S. defense and aerospace company with operations spanning defense systems, aerospace, marine systems, and advanced technologies.
From a technical perspective, the highlighted area on the chart can be monitored for a potential transition from the current bearish pattern toward a bullish structure. However, the broader downtrend remains the key consideration. Rather than anticipating the reversal too early, investors should look for a **confirmed change in market structure** that aligns with the higher-timeframe direction.
**Key technical observations:**
* The highlighted area represents a potential location to monitor for a trend transition.
* The current decline should be viewed within the context of the larger timeframe structure.
* A confirmed break of the bearish sequence would strengthen the possibility of a bullish reversal.
* The formation of **Higher Highs (HH)** and **Higher Lows (HL)** would provide stronger evidence of renewed buyer participation.
Fundamentally, General Dynamics can be evaluated through cash generation, earnings quality, balance-sheet strength, backlog, capital allocation, and its long-term competitive position within the defense industry. Tools such as the **Piotroski F-Score** and **Greenblatt’s Magic Formula**, supported by Excel or Python analysis, can add another layer to the evaluation. **Not everything that is cheap is valuable.**
*This publication reflects a personal interpretation of market structure and publicly available information. It is intended solely for educational and informational purposes and should not be considered financial advice or a recommendation to buy, sell, or hold any financial instrument. Independent research, prudent risk management, and personal due diligence should always precede any investment decision.*
 Long
Long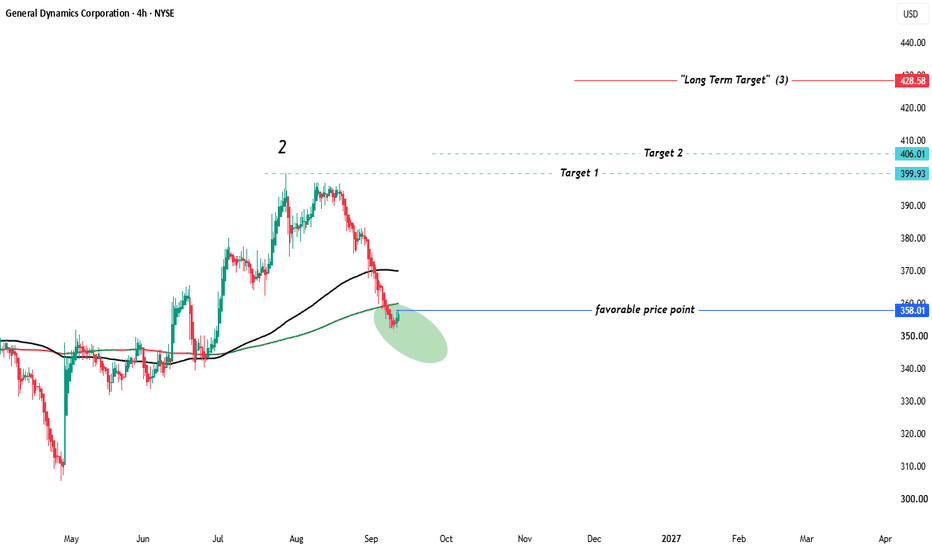
Norfolk Southern Corporation. NSC**Norfolk Southern Corporation**
Norfolk Southern Corporation is a major U.S. freight railroad company, providing transportation services across a broad network serving industrial, agricultural, and consumer markets.
From a technical perspective, the broader timeframe remains the key reference. Rather than anticipating a reversal while the lower-timeframe structure is still bearish, investors should wait for a **confirmed break of the bearish structure** and evidence that a new bullish trend is beginning.
**Key technical observations:**
* The current structure remains bearish on the relevant lower timeframe.
* Patience is important until the bearish sequence is clearly broken.
* A transition toward **Higher Highs (HH)** and **Higher Lows (HL)** would provide stronger evidence of buyer control.
* Confirmation on the lower timeframe should ideally align with the broader bullish direction visible on the higher timeframe.
From a fundamental perspective, Norfolk Southern can be evaluated through operating performance, cash generation, balance-sheet strength, capital allocation, and the long-term economics of its rail network. Tools such as the **Piotroski F-Score** and **Greenblatt’s Magic Formula**, organized through Excel or Python, can provide additional context. **Not everything that is cheap is valuable.**
*This publication reflects a personal interpretation of market structure and publicly available information. It is intended solely for educational and informational purposes and should not be considered financial advice or a recommendation to buy, sell, or hold any financial instrument. Independent research, prudent risk management, and personal due diligence should always precede any investment decision.*
 Long
Long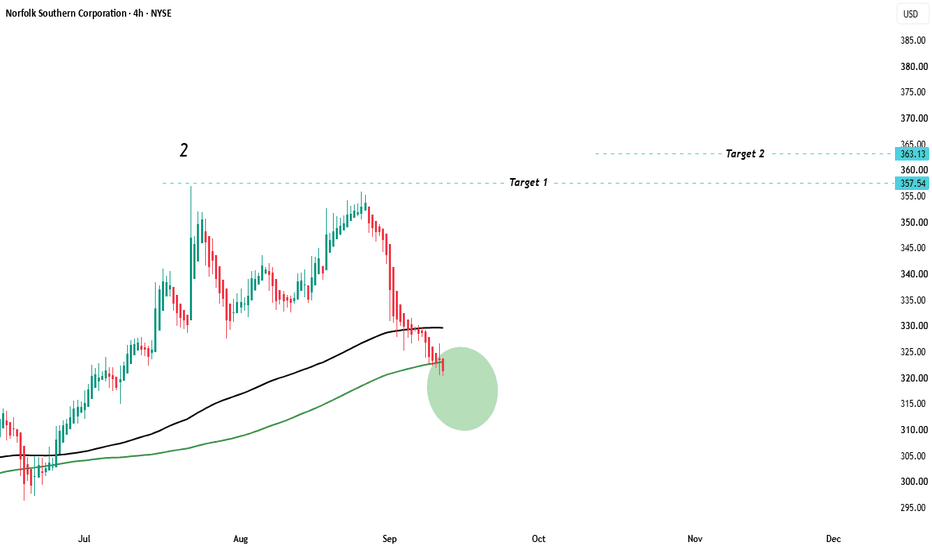
NextEra Energy, Inc. NEE**NextEra Energy, Inc.** is a major U.S. energy company with operations across regulated electric utilities and renewable energy, including wind and solar power generation.
The chart identifies a **potential entry area** within a broader bullish pattern. While the higher-timeframe structure remains positive, the lower timeframe still requires confirmation. Investors should watch for a clear **transition from bearish to bullish structure** before considering the setup more constructive.
**Key technical observations:**
* A highlighted area provides a potential location to monitor.
* The broader pattern remains **bullish**.
* Lower timeframe: wait for a confirmed bearish-to-bullish structure shift.
* **Higher Highs (HH)** and **Higher Lows (HL)** would strengthen the bullish scenario.
Fundamentally, NextEra Energy can be assessed through earnings stability, cash generation, balance-sheet strength, regulated utility operations, and its renewable-energy portfolio. Additional tools such as the **Piotroski F-Score** and **Greenblatt’s Magic Formula**, supported by Excel or Python, can help provide a broader perspective. **Not everything that is cheap is valuable.**
*This publication reflects a personal interpretation of market structure and publicly available information. It is intended solely for educational and informational purposes and should not be considered financial advice or a recommendation to buy, sell, or hold any financial instrument. Independent research, prudent risk management, and personal due diligence should always precede any investment decision.*
 Long
Long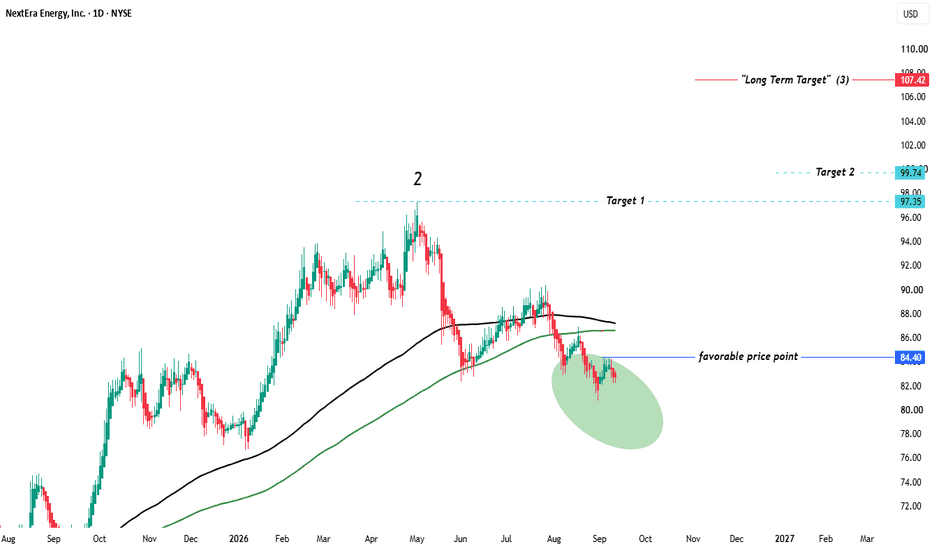
 Long
Long
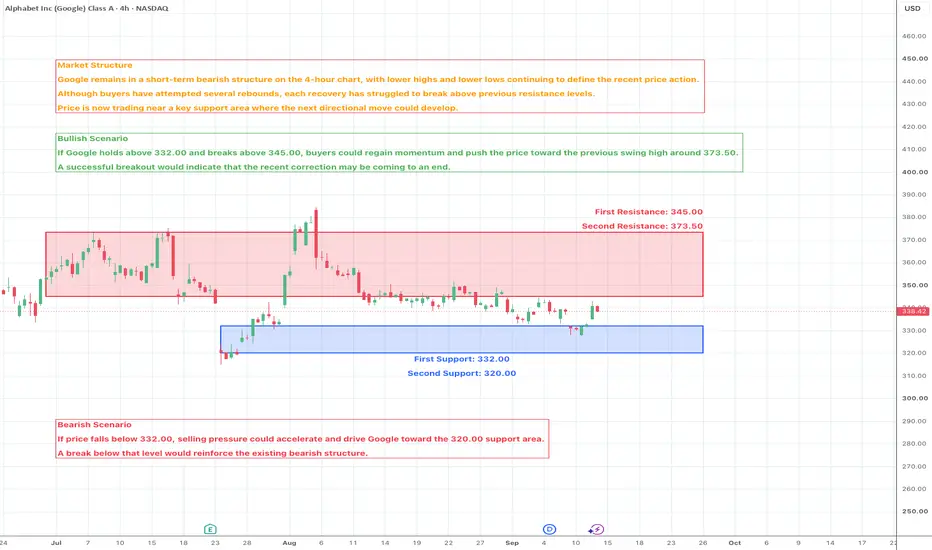
Google Tests a Critical Support ZoneGoogle Tests a Critical Support Zone — Can Buyers Reverse the Trend?
Market Structure
Google remains in a short-term bearish structure on the 4-hour chart, with lower highs and lower lows continuing to define the recent price action. Although buyers have attempted several rebounds, each recovery has struggled to break above previous resistance levels. Price is now trading near a key support area where the next directional move could develop.
Market Sentiment - Moderately Bearish
Market sentiment remains moderately bearish. Selling pressure has eased compared to the previous decline, but buyers have yet to produce a convincing breakout that would signal a meaningful trend reversal.
Bullish Scenario
If Google holds above 332.00 and breaks above 345.00, buyers could regain momentum and push price toward the previous swing high around 373.50. A successful breakout would indicate that the recent correction may be coming to an end.
Bearish Scenario
If price falls below 332.00, selling pressure could accelerate and drive Google toward the 320.00 support area. A break below that level would reinforce the existing bearish structure.
────────────────────
Market Outlook
Google remains under pressure after failing to sustain its previous rally. While recent buying interest has helped stabilize price, the overall structure still favors sellers until a clear breakout above resistance is confirmed.
────────────────────
Key Levels
First Resistance: 345.00
Second Resistance: 373.50
First Support: 332.00
Second Support: 320.00
────────────────────
Future Scenarios
A sustained move above the First Resistance would indicate that buyers are regaining control and could drive price toward the Second Resistance.
However, if price falls below the First Support, selling pressure could increase toward the Second Support.
────────────────────
Event Risk
Google's short-term direction may continue to be influenced by overall U.S. equity market sentiment, Treasury yields, economic data, AI-related developments, and company-specific news.
However, price action remains the most important signal. If positive news cannot lift price above the First Resistance, it would suggest buying momentum remains limited. Conversely, if Google loses the First Support despite improving market sentiment, the broader bearish structure would remain intact.
────────────────────
Please share your view below:
Do you think Google can reclaim the 345.00 resistance and start a new bullish phase, or will the current downtrend continue?
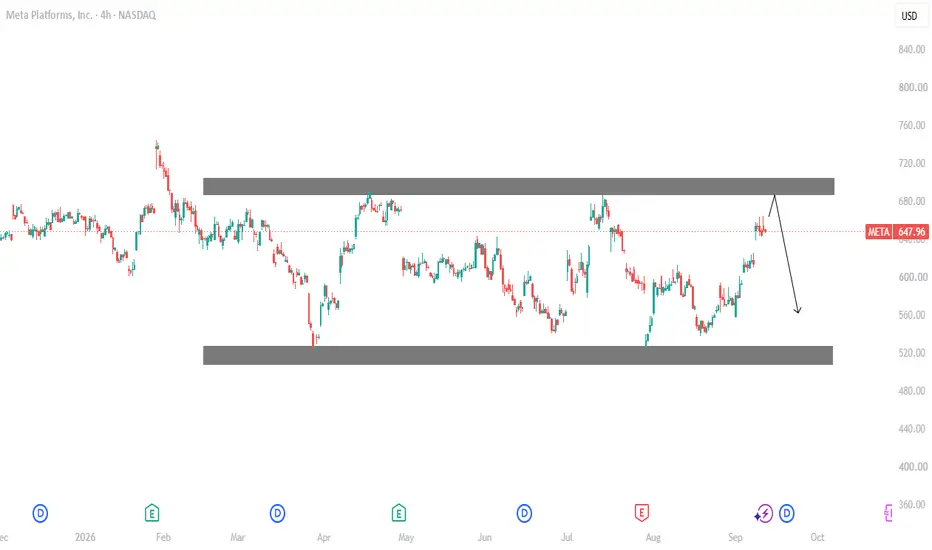
More market structure and key level updates will be shared regularly. META Rebounds Strongly —Can Buyers Break Through Key Resistance?Market Structure
META has shifted back into a bullish short-term structure on the 4-hour chart after recovering sharply from its recent swing low. Buyers have reclaimed higher levels, but price is now approaching a significant resistance zone where selling pressure previously emerged. The broader recovery remains intact as long as key support continues to hold.
Market Sentiment - Moderately Bullish
Market sentiment is moderately bullish. Buying momentum has strengthened over the past several sessions, although price is now testing an important resistance area that could determine the next directional move.
Bullish Scenario
If META holds above 610.00 and breaks decisively above 650.00, buyers could extend the rally toward the previous swing high near 678.00. A confirmed breakout would reinforce the bullish trend and signal renewed upside momentum.
Bearish Scenario
If price fails to hold above 610.00, profit-taking could drive a deeper pullback toward 590.00. A break below that level would weaken the current recovery and increase short-term selling pressure.
────────────────────
Market Outlook
META has staged an impressive recovery and is now trading near a key resistance zone. While the overall structure favors buyers, the next move will likely depend on whether bulls can generate enough momentum to break above recent highs.
────────────────────
Key Levels
First Resistance: 650.00
Second Resistance: 678.00
First Support: 610.00
Second Support: 590.00
────────────────────
Future Scenarios
A sustained move above the First Resistance would indicate that buyers are regaining full control and could drive price toward the Second Resistance.
However, if price falls below the First Support, selling pressure could increase toward the Second Support.
────────────────────
Event Risk
META's short-term direction may continue to be influenced by overall U.S. equity market sentiment, Treasury yields, economic data, AI-related developments, and company-specific news.
However, price action remains the most important signal. If positive news cannot push price above the First Resistance, it would suggest bullish momentum is losing strength. Conversely, if META continues to hold above the First Support despite negative headlines, the broader bullish structure would remain intact.
────────────────────
Please share your view below:
Do you think META will break above 650.00 and continue its bullish trend, or is another pullback likely before the next rally?
More market structure and key level updates will be shared regularly. Microsoft Nears a Key Decision Zone, Can Buyers Regain Momentum?Market Structure
Microsoft remains in a broader bullish structure on the 4-hour chart despite the recent pullback from its swing high. Price continues to trade above the major support zone around 487.00, suggesting that buyers are still defending the trend. However, the latest recovery has been relatively cautious, indicating that confirmation is still needed before the next directional move.
Market Sentiment - Moderately Bullish
Market sentiment remains moderately bullish. Although buying momentum has slowed following the recent correction, the overall structure continues to favor buyers as long as key support levels remain intact.
Bullish Scenario
If Microsoft continues to hold above 487.00 and breaks above 500.00, buyers could regain momentum and push price toward the previous high near 512.00. A successful breakout would reinforce the existing uptrend.
Bearish Scenario
If price falls below 487.00, selling pressure could increase and trigger a deeper pullback toward 480.00. Losing that support would weaken the current bullish structure and shift short-term momentum back in favor of sellers.
────────────────────
Market Outlook
Microsoft is currently consolidating after a strong advance and remains above an important support zone. While buyers still have the advantage, the next meaningful move will likely depend on whether price can reclaim the psychological 500.00 level.
────────────────────
Key Levels
First Resistance: 500.00
Second Resistance: 512.00
First Support: 487.00
Second Support: 480.00
────────────────────
Future Scenarios
A sustained move above the First Resistance would indicate that buyers are regaining control and could drive price toward the Second Resistance.
However, if price falls below the First Support, selling pressure could increase toward the Second Support.
────────────────────
Event Risk
Microsoft's short-term direction may continue to be influenced by overall U.S. equity market sentiment, Treasury yields, macroeconomic data, and company-specific developments.
However, price action remains the most important signal. If positive news cannot lift price above the First Resistance, it would suggest that bullish momentum is fading. Conversely, if Microsoft continues to hold above the First Support despite negative headlines, the broader bullish structure would remain intact.
────────────────────
Please share your view below:
Do you think Microsoft will break above 500.00 and continue its bullish trend, or is another pullback likely before the next rally?
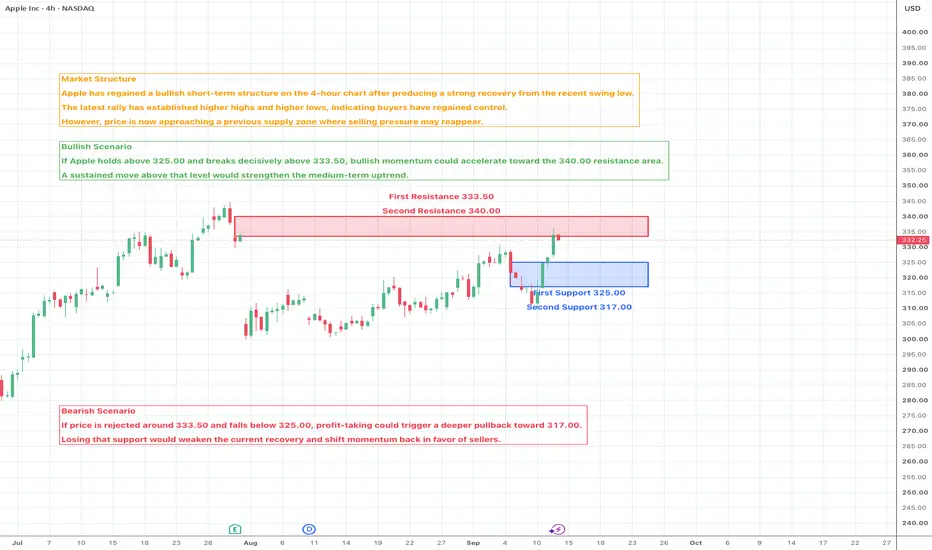
More market structure and key level updates will be shared regularly. Apple Approaches a Key Resistance ZoneMarket Structure
Apple has regained a bullish short-term structure on the 4-hour chart after producing a strong recovery from the recent swing low. The latest rally has established higher highs and higher lows, indicating buyers have regained control. However, price is now approaching a previous supply zone where selling pressure may reappear.
Market Sentiment - Moderately Bullish
Market sentiment has improved noticeably following the recent rebound. Buyers are back in control in the short term, but momentum is now being tested near an important resistance area. A confirmed breakout is needed to reinforce the bullish outlook.
Bullish Scenario
If Apple holds above 325.00 and breaks decisively above 333.50, bullish momentum could accelerate toward the 340.00 resistance area. A sustained move above that level would strengthen the medium-term uptrend.
Bearish Scenario
If price is rejected around 333.50 and falls below 325.00, profit-taking could trigger a deeper pullback toward 317.00. Losing that support would weaken the current recovery and shift momentum back in favor of sellers.
────────────────────
Market Outlook
Apple has staged an impressive rebound and is once again testing a key resistance zone. While buyers currently hold the advantage, the next move will likely depend on whether price can clear the recent swing high. Until then, this area remains an important decision point for both bulls and bears.
────────────────────
Key Levels
First Resistance 333.50
Second Resistance 340.00
First Support 325.00
Second Support 317.00
────────────────────
Future Scenarios
If price breaks above 333.50, the bullish trend could extend toward 340.00.
On the other hand, if 325.00 fails to hold, Apple could retrace toward the 317.00 support area before buyers attempt another recovery.
────────────────────
Event Risk
Apple's short-term direction may continue to be influenced by broader U.S. equity market sentiment, Treasury yields, economic data, and company-specific news.
However, price action remains the most important signal. If bullish news cannot push price above 333.50, it would suggest buying momentum is fading. Conversely, if Apple continues to hold above 325.00 despite negative headlines, the underlying trend would remain constructive.
────────────────────
Please share your view below:
Do you think Apple will break above 333.50 and continue its bullish trend, or is another rejection likely before the next move higher?
More market structure and key level updates will be shared regularly.  Long
Long
 Long
Long