BAC – Silver Reclaimed, Share Position Opened | CSE Option DecisDate: 2026-09-15
Type: CSE Option Decision OS Update
Bank of America is now another live case inside our CSE Capital — Option Decision OS, also known as the Continuation Swing Engine.
Last Friday, we opened a small share position in BAC. The reason was not a blind buy signal, and it was not an emotional reaction to price movement. We measured the stock against the CSE dashboard and the structure was interesting enough for controlled share exposure.
The current CSE read shows a very specific picture:
Manual Action: HOLD / ADD WATCH
Underlying Thesis: THESIS INTACT
Tactical Status: TACTICAL REPAIR RECLAIMED
Add Status: EVALUATE RANGE — FEASIBILITY REQUIRED
Option Position: HOLD
Signal Confidence: 72/100
Decision Price / Current Quote: 59.67
Trend: Bullish
Next Zone: 61.95
Invalidation: 32.24
Decision Mode: Manual Only
Execution: Locked / Disabled
This is exactly why we built the CSE Option Decision OS.
A normal chart view might simply say: “BAC is bullish” or “BAC is moving higher.” But for options and structured exposure, that is not enough. CSE separates the underlying thesis, the tactical repair, the entry frontier, the add status, the option position, the risk gate and the portfolio decision.
For BAC, the dashboard shows that the thesis is intact and the trend is bullish. The tactical repair has been reclaimed, and the Current Entry Frontier shows SILVER RECLAIMED. That is important. The Silver range around 54.84–55.95 has already been reclaimed, which means BAC has moved beyond the active reclaim zone and is now approaching the next important area.
The next CSE roadmap zone is 61.95, with the Bronze range sitting around 61.40–62.51. That creates a very clear decision area. BAC is not sitting at deep support anymore. It is moving toward a higher validation zone where the market must prove whether this is real continuation or just a temporary extension.
That is why we started with shares first.
Not options.
Not aggressive leverage.
Not automatic buying.
A controlled share position gives us exposure to the thesis while keeping the decision flexible. If BAC continues toward the 61.95 area and confirms strength around the Bronze zone, the setup can become more interesting. But if price fails near that area, the position can still be managed without the same time decay pressure that comes with options.
The Structural Authority Ladder also supports the broader case:
Tactical Failure: 47.93
Tactical Repair: 49.23
Macro Survival Support: 39.25
Hard Invalidation: 32.24
The Macro Fib Thesis Lens reads:
Position Archetype: Bullish Continuation
Macro Fib Status: Certified Structural Thesis — Intact
Decision Posture: Evaluate Range — Feasibility Required
Reclaim Required: False
No Add Zone: False
Order Ready: False
That last line matters: Order Ready False.
This is the discipline inside CSE. The system can show a bullish trend, intact thesis and reclaimed structure, while still refusing to treat the setup as an automatic order. That is exactly the difference between a decision-support engine and a simple signal tool.
For BAC, the current decision is Hold / Add Watch. We already have a small share position, so the next step is not to chase. The next step is to monitor whether BAC can move into the 61.95 / Bronze validation area and hold that structure. Only then does the next decision become relevant.
For an options strategy, BAC still needs to pass the Option Feasibility + Risk Gate. That means checking premium size, liquidity, bid/ask spread, delta, expiry, time value, implied volatility, portfolio exposure, concentration risk and risk/reward before any option idea can become actionable.
The current BAC case is therefore about process.
The dashboard showed Silver Reclaimed.
The thesis remained intact.
The trend stayed bullish.
Tactical repair was reclaimed.
The next zone is clearly defined.
But CSE still requires feasibility review.
So the decision was simple: start with controlled share exposure, manage the position, keep options under review and do not chase.
This is the edge we are building with CSE Capital — Option Decision OS.
Not prediction.
Not hype.
Not emotional trading.
A structured decision system for options and equity exposure.
Structure first.
Confirmation second.
Feasibility third.
No chase, no emotion, only process.
 Long
Long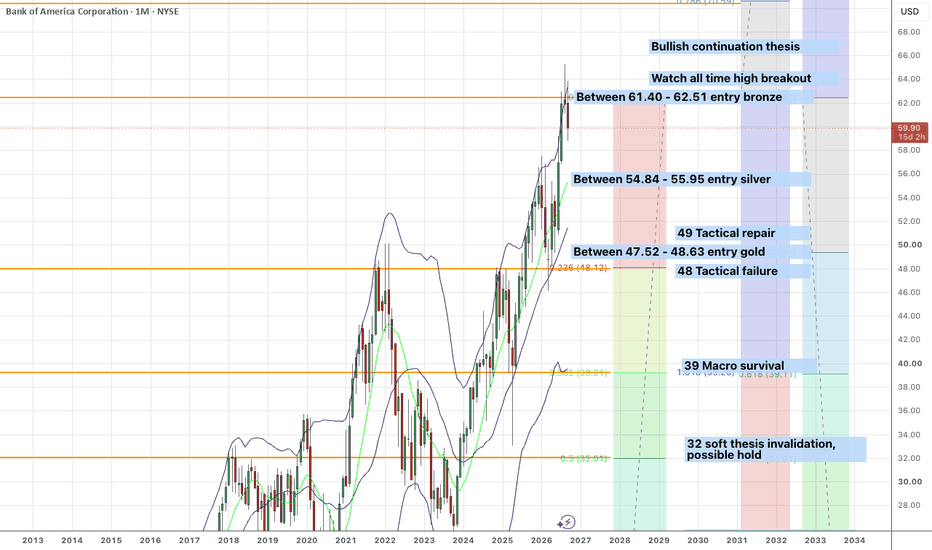
AMD – Bronze Accepted After Correction | Why CSE Chose SharesDate: 2026-09-15
Type: CSE Option Decision OS Update
AMD is currently one of the most interesting live cases inside our CSE Capital — Option Decision OS, also known as the Continuation Swing Engine.
Over the last two days, AMD gave us exactly the kind of situation where a normal trader can easily become emotional. The stock corrected sharply, volatility increased, and the question immediately became: is this weakness a warning, or is this a structured entry opportunity?
This is where our CSE decision tree becomes valuable.
Yesterday, during the correction, AMD moved into our Bronze Current Entry Frontier. The dashboard had already defined the Bronze range between 461.87 and 485.00, with the function labelled as BREAKOUT_ACCEPTED. That meant the correction was not automatically bearish. It brought AMD back into a relevant CSE decision zone.
That is why we chose to initiate a small share position first.
Not options.
Not a full aggressive add.
Not a blind buy signal.
A controlled share position.
The reason is important. AMD is structurally interesting, but CSE does not classify the current setup as fully order-ready. The system currently shows:
Manual Action: HOLD / ADD WATCH
Underlying Thesis: THESIS INTACT
Tactical Status: TACTICAL REPAIR RECLAIMED
Add Status: EVALUATE RANGE — FEASIBILITY REQUIRED
Option Position: HOLD
Signal Confidence: 75/100
Decision Price / Current Quote: 504.24
Trend: Bullish
Next Zone: 580.91
Invalidation: 291.26
Decision Mode: Manual Only
Execution: Locked / Disabled
This is exactly the distinction we want the CSE Option Decision OS to make.
The dashboard is bullish on trend and intact on thesis, but it is not saying “auto buy.” The system recognises that AMD has accepted the Bronze range, reclaimed tactical repair, and remains in a bullish continuation structure. At the same time, it keeps the decision disciplined by showing “Evaluate Range — Feasibility Required.”
That is why shares made more sense first than options.
With shares, we can participate in the thesis while keeping the position flexible. With options, the decision has to be much stricter: premium, liquidity, bid/ask spread, expiry, delta, implied volatility, concentration risk and total portfolio exposure all need to pass the CSE Option Feasibility + Risk Gate.
AMD’s Macro Fib Thesis Lens also supports the broader case:
Position Archetype: Bullish Continuation
Macro Fib Status: Certified Structural Thesis — Intact
Macro Survival Support: 359.62
Tactical Repair Trigger: 456.94
Distance to Macro Support: +40.2%
Distance to Repair Trigger: +10.4%
Decision Posture: Evaluate Range — Feasibility Required
Reclaim Required: False
No Add Zone: False
Order Ready: False
That combination is powerful, but also nuanced.
The thesis is intact.
The trend is bullish.
The tactical repair has been reclaimed.
The Bronze range has been accepted.
But the setup still requires feasibility review before any option decision.
This is exactly how we want to use CSE Capital — Option Decision OS. It is not built to generate random buy and sell signals. It is built to create a structured decision framework around Fibonacci architecture, tactical repair, entry frontiers, thesis health, option feasibility and portfolio impact.
The current AMD roadmap now points to 580.91 as the next major CSE target zone, with higher structural zones at 738.48 and 938.92. These are not guarantees or predictions. They are roadmap levels inside the model. The purpose is not to claim certainty, but to know where the next decision areas are before price gets there.
The most important part of this AMD case is the process.
Yesterday’s correction did not make us panic.
It made us measure AMD against the dashboard.
The dashboard showed Bronze Accepted.
The thesis remained intact.
The trend stayed bullish.
The tactical repair remained reclaimed.
But CSE still required feasibility review.
So the decision was: start with shares as controlled exposure, keep options under review, and do not chase.
That is the edge we are trying to build.
Not prediction.
Not hype.
Not emotional trading.
A structured decision system for options and equity exposure.
Structure first.
Confirmation second.
Feasibility third.
No chase, no emotion, only process.
 Long
Long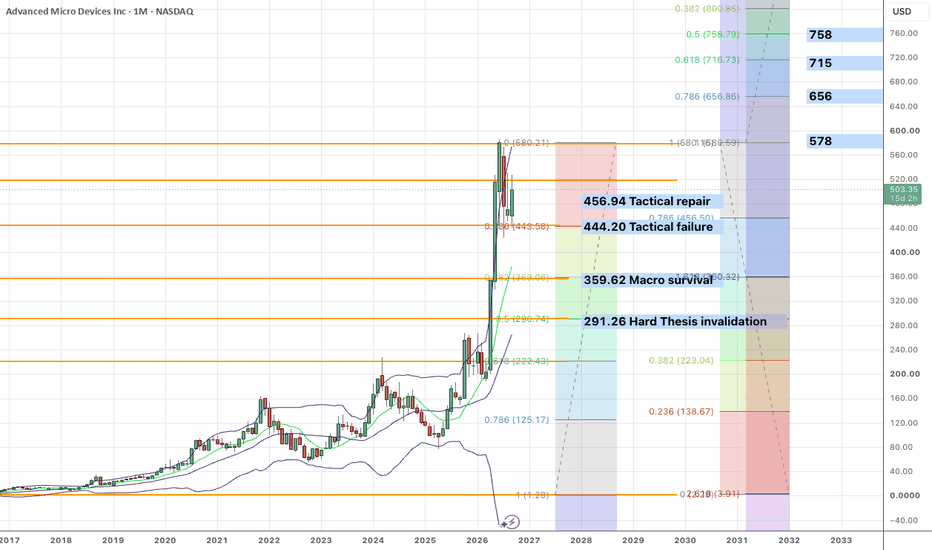
 Long
Long
Diamondback Energy Has Been CoilingDiamondback Energy has consolidated as crude oil rallies, and some traders may see potential for a breakout.
The first pattern on today’s chart is the July 2024 high of $214.50. FANG broke the old peak last month before pulling back. Is another push coming?
Second, the oil-and-gas driller made higher lows above its rising 50-day simple moving average after testing the old resistance. That could reflect bullish intermediate-term price action.
Third, Bollinger Bandwidth has narrowed as the stock forms the tighter range. That volatility squeeze may create potential for prices to expand.
Finally, the 8-day exponential moving average (EMA) has mostly stayed above the 21-day EMA since early July. That could be consistent with growing bullishness in the short term.
TradeStation has, for decades, advanced the trading industry, providing access to stocks, options and futures. If you're born to trade, we could be for you. Learn more here about TradingView’s Broker of the Year!
Past performance, whether actual or indicated by historical tests of strategies, is no guarantee of future performance or success. There is a possibility that you may sustain a loss equal to or greater than your entire investment regardless of which asset class you trade (equities, options or futures); therefore, you should not invest or risk money that you cannot afford to lose. Online trading is not suitable for all investors. View the document titled Characteristics and Risks of Standardized Options at www.TradeStation.com . Before trading any asset class, customers must read the relevant risk disclosure statements on www.TradeStation.com . System access and trade placement and execution may be delayed or fail due to market volatility and volume, quote delays, system and software errors, Internet traffic, outages and other factors.
Securities and futures trading is offered to self-directed customers by TradeStation Securities, Inc., a broker-dealer registered with the Securities and Exchange Commission and a futures commission merchant licensed with the Commodity Futures Trading Commission). TradeStation Securities is a member of the Financial Industry Regulatory Authority, the National Futures Association, and a number of exchanges.
TradeStation Securities, Inc. and TradeStation Technologies, Inc. are each wholly owned subsidiaries of TradeStation Group, Inc., both operating, and providing products and services, under the TradeStation brand and trademark. When applying for, or purchasing, accounts, subscriptions, products and services, it is important that you know which company you will be dealing with. Visit www.TradeStation.com for further important information explaining what this means.  Short
Short
 Short
Short
 Short
Short
 Long
Long
 Long
Long
 Long
Long
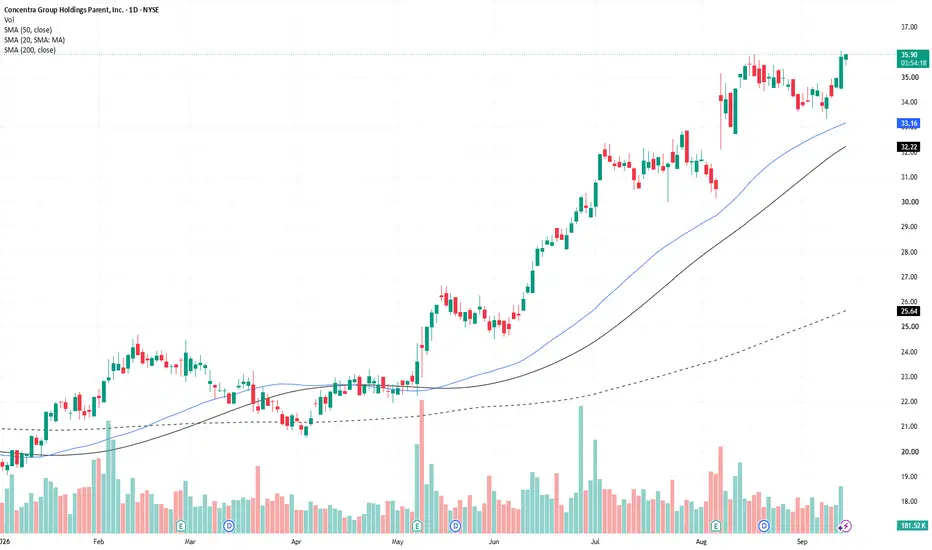
$CON is Potential A SetupNYSE:CON looks close: I’d grade the visible technical setup A−, with a decent consolidation, but the breakout is not confirmed yet.
Check list
Strong trend? Yes.
The weekly trend is strong, and the daily price is above rising 20-, 50-, and 200-day averages.
Good consolidation (pre-requisite before breakout in A+ setup)? Constructive. Several weeks of consolidation around roughly $33–35 preceded the latest push toward new highs. The final tightening could be clearer.
Extended? Moderately: approximately 3.3% above the daily 20-day average ($34.63) and 8.2% above the 50-day ($33.08) at $35.78.
Volume confirmation? Yesterday’s 1.09M was about 55% above the 10-day average, but only 16% above the 90-day average. Encouraging, rather than overwhelming.
Entry trigger now? Still pending. Price is consolidating beneath yesterday’s $36.05 high.
The main breakout level is $36.05.
The earlier $35.85 level is today’s intraday high. Clearing it would show improving momentum, but $36.05 is the more meaningful daily-chart hurdle.
For an early entry, I’d look for a completed 15-minute candle above $36.05, closing strongly on increased volume, followed by price holding above that level. A single one-minute spike would offer much weaker evidence. Expanding volume strengthens a resistance breakout  Long
Long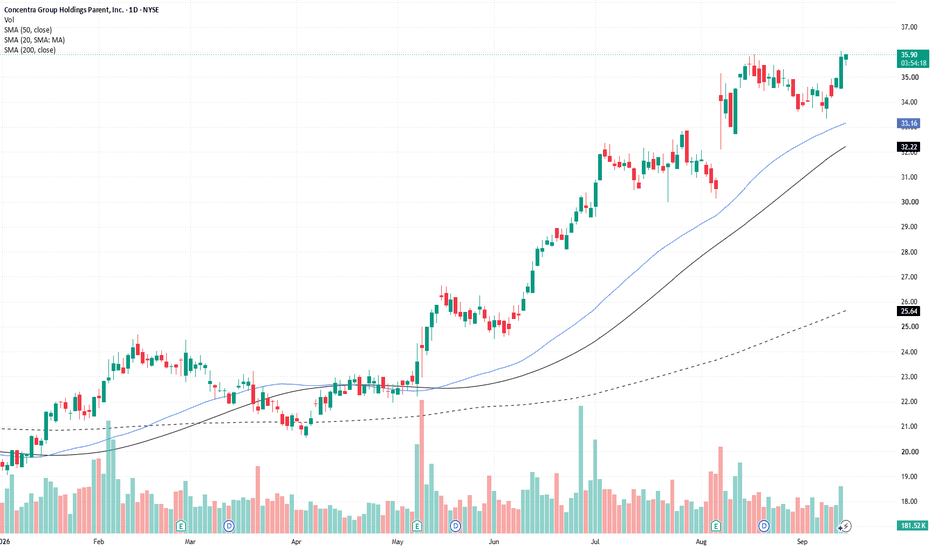
 Long
Long
 Long
Long
AI Boom Stumbles: Chipmakers Lose Nearly 6%It took just one trading session for the semiconductor sector to lose nearly 6% of its value . On September 14, the PHLX Semiconductor Index fell 5.9%, while #NVIDIA shares dropped around 3.4% and #Micron fell more than 5% . The pressure spread across the broader technology market as well, with the Nasdaq ending the day lower.
The main trigger came from warnings issued by AI company executives. Following concerns about the risks of technology developing too quickly, investors seriously began asking for the first time in a while: what will happen to chipmakers if massive spending on artificial intelligence starts to slow down?
What spooked investors:
1. The market has started reassessing future demand . #NVIDIA and #Micron have been among the biggest beneficiaries of data center construction and growing demand for computing power.
Even a hint of a potential slowdown in AI investment is prompting investors to take a more cautious view of future processor and memory sales.
2. High interest rates are adding pressure . The yield on 10-year US government bonds briefly exceeded 5% , while expectations of another Fed rate hike remain elevated. The more expensive money becomes, the harder it is for technology stocks to justify high valuations.
3. Investors are taking profits after a strong rally . The semiconductor sector remains one of the year's top performers and, even after the sell-off, is still up around 57% since January . Against this backdrop, the emergence of a new risk provided a convenient reason to close some profitable positions.
The problem for the market is that current high valuations of technology companies already largely assume that AI investment will continue growing rapidly . As companies consistently increased spending on equipment and data centers, this scenario worked in favor of chipmakers. Now, the market has to consider the opposite possibility as well.
At the same time, it is still too early to talk about the end of the AI boom. Demand for computing power remains high, and a single day of selling does not change the long-term trend. However, the nearly 6% decline showed just how sensitive the sector has become to any doubts about the future pace of artificial intelligence spending.
According to FreshForex analysts, as long as pressure on chipmakers persists, it will be harder for #NQ100 to reach new highs . If US Treasury yields remain around 5% and concerns about a slowdown in AI investment intensify, pressure on the technology index could continue.  Short
Short
 Long
Long