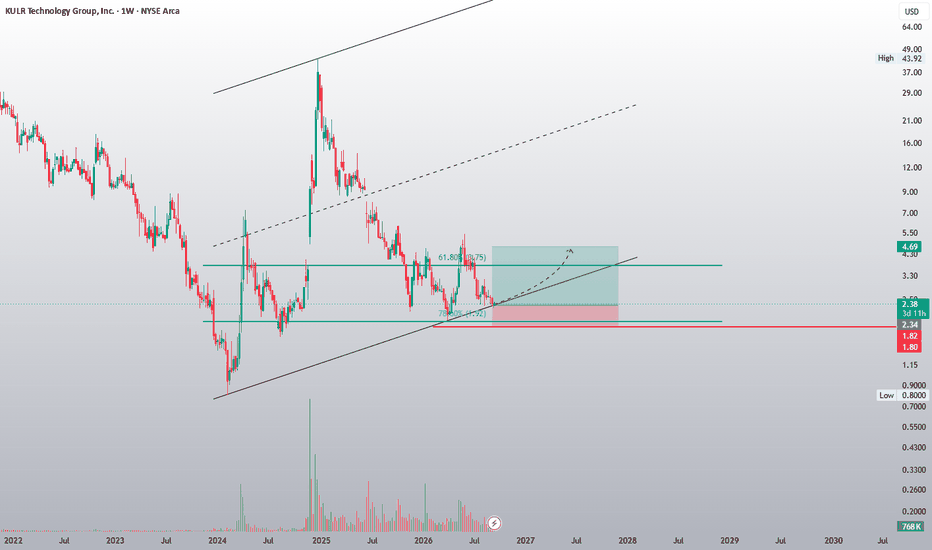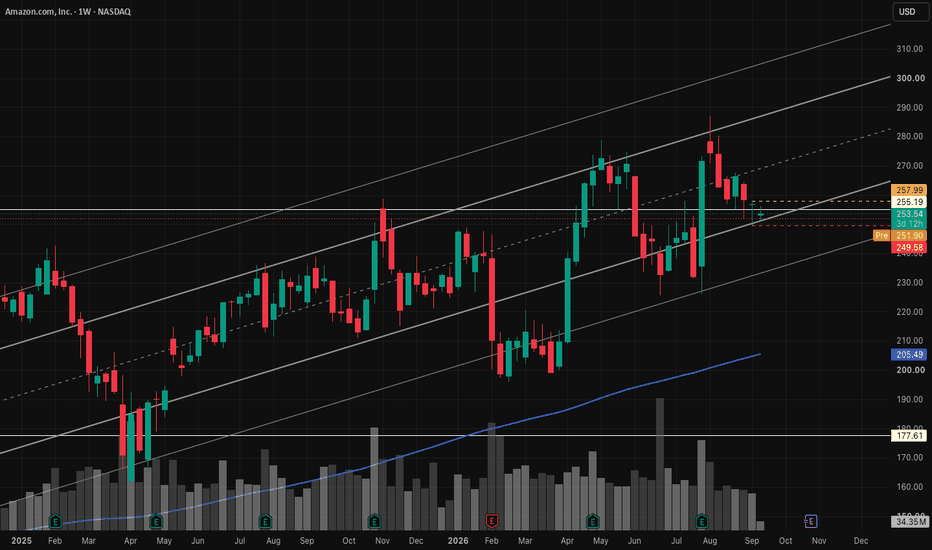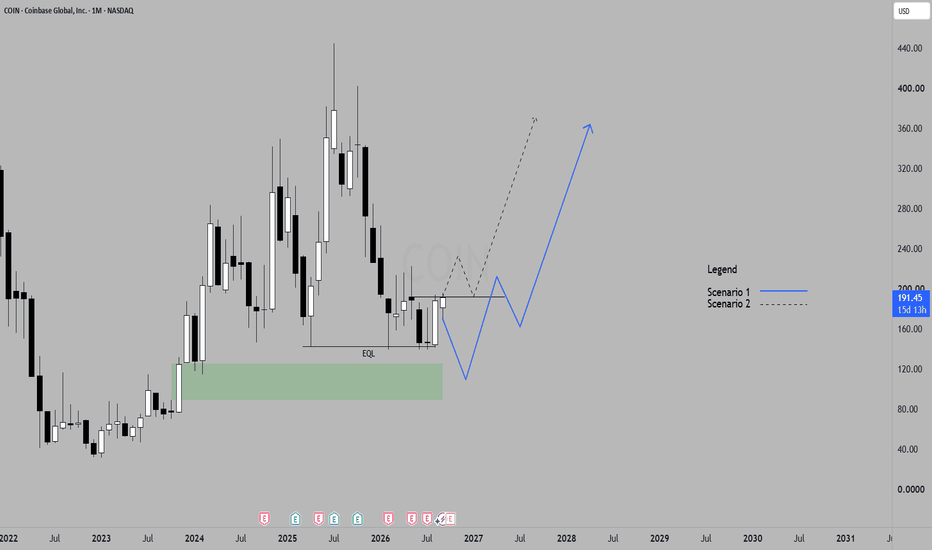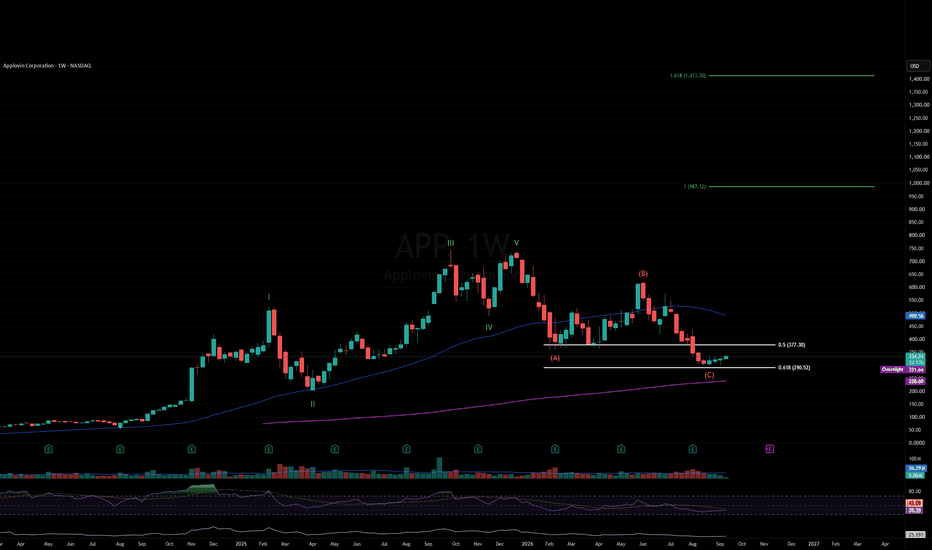
SOFI - opportunity for the next 400 days or so Expecting 1 more leg down (14£$ ish)
Projections are based on previous retracements and extensions on the Fib
ABC waves, while not very impulsive, can be predictable.
Looking to finish a wave 4 and then to start a wave 5 - again as a ABC
In the bullish waves, noticed the B retraces around the area of 0.61 with price projections to -0.5 on a Log Scale. Looking for the same pattern!
Sandisk (SNDK) LONG — 1D ALMA Setup (WR 85%)█ SETUP
Sandisk · BATS:SNDK · 1D · long only.
ALMA Averaging Strategy: ALMA 3 / σ2, SD band 2, min diff 1/1, 25% per bar, up to 4 adds, hard stop −10% from average entry.
Strategy Tester (SNDK 1D):
Win rate 85% · profit factor 14.1 · max drawdown 38%
Typical hold ~17×1D bars on winners · high-payoff memory-name mean-reversion template
═
█ WHY NOW
Tuesday US cash close — fresh 1D ALMA long on 08 Jul 13:30 UTC ~ $1,618 .
First lot on the daily template after a sharp drawdown from the June highs — storage/memory beta on a bar-close signal, not an AI-headline chase. Snapshot ~ $1,657 on the 08 Jul board (~+2.4% from fill).
Hard stop zone −10% from entry ~ $1,456 . Exits follow Pine ALMA flip + min diff or the hard stop.
═
█ MACRO
Sector: SNDK = SanDisk · NAND flash / enterprise SSD · WDC spin-off (2025) — AI data-center storage and the NAND shortage thesis (Micron tight supply, multi-year LTAs with price floors), not GPU silicon.
Tape (Jun–8 Jul): Mixed supercycle → reset — June +~34% on Micron FQ3 blowout (25 Jun) and PT hikes (Citi $2,500, Bernstein $3,000, BofA $2,500, Goldman $2,200); early July sentiment reversal — Meta Compute oversupply scare (01–02 Jul, SNDK −~14%) and Samsung sell-the-news (06–07 Jul) erased most June gains (−31% from the June peak by 07 Jul). Analysts still cite ~$42B contracted backlog and LTAs — but late-window tape is profit-taking / glut narrative, not a fresh upgrade chase.
Near-term: SK Hynix (SKHY) Nasdaq listing (~10 Jul) — competition for US AI-memory flows; FQ4 earnings (~13 Aug, confirm IR) — NAND ASP / LTA guide.
Execution is 1D ALMA on the post-unwind bar (~$1,618 after the July flush), not an earnings preview or chase into June highs.
Book note: a separate 4H VWAP long from 02 Jul (~$1,759) remains underwater — this publish tracks only the fresh 1D ALMA lot.
═
█ OUTLOOK
Positive factors
- 85% WR · PF 14.1 — rare payoff skew on a 40-day US equity sample
- Fresh daily entry inside the 24h publish window — first bar on the high-WR template
- ALMA — daily stretch (fuel): 1D SHORT · S:5 vs SAvg 2.4 OVERHEAT-S — time below the daily band exceeds norm · MR fuel on the crash, not «SHORT = bearish»
- ALMA — execution ladder: 1H LONG · L:3 · 4H LONG · L:1 at the band — fast boards aligned with the new daily long · 15m S:1 first bar below fast ALMA (touch, not chase)
- EMA — overheated below (fuel): 1H Cur S:29 vs Avg S:6.7 · +4.5% dev — stretched below-session on the fast ladder after the July flush
- SMC — at the fill ~$1,618: 4H FVG Raid Bull bull-event bounce B 63.4% Br36.6% (n=71) · 1D raid B 68.4% Br31.6% (n=19) — close ≥ ref follow-through at the entry print · aligns with 1D ALMA long
- SMC — 4H: OB Enter Normal Bull @ ~$1,618 · bounce B55.6% Br44.4% (n=9) — bid-side structure at fill
- TL AI — Support Break 06 Jul: bounce B 81% Br19% (n=47) — elevated post-break bounce history on SNDK; supports the MR template despite the TL label
- Scoring: long +31.3 vs short −21.3 on the snapshot board
Negative factors
- EMA — young below (execution TF): 1D Cur S:4 vs Avg S:7.7 · +9.0% dev — below-session not yet overstretched on the daily chart; selloff can extend before the 1D ALMA band works
- EMA — overheated above (slow charts): 3D Cur L:78 vs Avg L:2.3 · −15.4% dev — long above-session on slow EMA after the June spike · giveback / coil risk even with price back near the line
- EMA — weekly crash context: 1W Above · L:23 · −51.2% dev — extreme unwind from the YTD memory rally; gap risk on headline opens
- ALMA — slow boards young: 3D/1W both SHORT · S:2 ≈ SAvg ~2.1 — higher-TF below-band time not stretched yet vs the overheated 1D read
- SMC — overhead ~$1,745 (02 Jul bull FVG): prior June shelf · bull-event bounce B 81.3% Br18.8% (n=16) — first test is a reaction zone, not a free pass; 06 Jul bear FVG formed/filled adds fresh supply into the same area
- Gap risk on memory-sector headlines — −10% stop can slip on the US open
Takeaway: the 85% WR daily template, 1D ALMA OVERHEAT-S, 1H below-EMA stretch, and SMC/TL bounce at ~$1,618 align with a post-crash MR entry — but 1D young below-EMA and 3D overheated above-time cap the first leg; exit path remains Pine / −10%, not a chase back to ~$1,745 without ALMA/EMA cooperation.
Base case: 1D ALMA holds ~$1,618–1,680 · 1H/4H long boards hold · slow grind toward prior supply ~$1,745 if memory sentiment stabilizes.
Bear case: lose daily ALMA · 1D young below extends · 4H liquidation flush · −10% toward ~$1,456 from ~$1,618 entry.
Chart: NASDAQ:SNDK 1D — ALMA Averaging Strategy.
Educational idea. Live position — past backtest ≠ future results. NFA.
USA Rare Earth (USAR) LONG — 12H ALMA Setup (WR 77%)█ SETUP
NASDAQ:USAR · 12H · long only.
(Context: USA Rare Earth — Round Top TX mine-to-magnet · NdFeB magnets · US critical-minerals chain.)
ALMA Averaging Strategy: ALMA 3 / σ2, SD band 2, min diff 1/1, 25% per bar, up to 4 adds, hard stop −10% from average entry.
Strategy Tester (USAR 12H):
Win rate 77% · profit factor 2.6 · max drawdown 22%
Avg winning trade +33.8% · avg losing trade −8.9%
Typical hold ~15×12H bars on winners — US small-cap mean-reversion grid on the rare-earth sleeve
█ WHY NOW
Wednesday US cash close — fresh 12H ALMA long on 09 Jul 13:30 UTC ~ $18.43 .
First lot on the template after a brutal June unwind (−23% on the month per tape) and a fresh regulatory headline week — bar-close on the 12H ALMA sleeve, not a CHIPS-deal chase into the spring highs.
Hard stop zone −10% from fill ~ $16.59 . Exits follow Pine ALMA flip + min diff or the hard stop.
═
█ MACRO
Sector: USAR = Western rare-earth / critical minerals — Round Top (TX) → Wheat Ridge hydromet demo → Blacksburg SC magnets (target 2028). Policy tailwind (Commerce agreements, US govt equity stake) vs execution and dilution risk on a pre-revenue buildout.
Tape (Jun–9 Jul): June −23% on share-overhang narrative, China export-control list (22 Jun), Russell benchmark exit (forced selling), and MP Materials trade-secrets lawsuit escalation. 6–7 Jul: Senate Democrats probe the ~$1.6B Commerce placement / Cantor Fitzgerald role — shares −7–8% on the inquiry. Offset in-window: Wheat Ridge hydromet demo commissioned 15 Jun with first separated oxides targeted Q3 2026.
Execution is 12H ALMA on the post-selloff bar (~$18.43), not a Q3 oxide-catalyst preview or policy headline chase.
═
█ OUTLOOK
Positive factors
- 77% WR · PF 2.6 on a 95-day 12H US equity sample — workable skew for a volatile small-cap template
- Post-crash MR frame: June −23% + early-July probe selloff leaves price ~$18–19 vs 52-week span $10.50–$43.98 — selloff context for a mean-reversion sleeve, not a breakout chase
- Wheat Ridge Q3 2026 oxide milestone (15 Jun commissioning) — one operational proof point in the window if execution stays on schedule
- US critical-minerals policy support (Commerce / CHIPS equity path) — sector beta for Western REE names even when tape is messy
- Hard −10% stop from ~$18.43 (~$16.59) caps nominal script risk on the first leg
Negative factors
- Regulatory / legal overhang: Warren-led probe (6 Jul) + China export-control symbolism (22 Jun) — headline gap risk on US opens
- Russell exit-driven selling and S-3 share-overhang narrative still in recent tape — float pressure can extend below the first ALMA add
- MP Materials lawsuit / IP narrative — distraction and competitive noise in US magnet supply chain
- Pre-revenue, capital-intensive buildout — commercial magnet scale and Round Top PFS (~end 2026) not yet in hand
- Sparse live factor board on USAR in the desk snapshot batch — no fresh EMA/ALMA/VWAP/SMC rows to confirm discount stretch at paste time; technical confirmation lags the equity headline read
- Single first lot — no averaged discount yet if the 12H bar extends lower before adds qualify
- Small-cap gap risk — −10% stop can slip on a policy headline open
Takeaway: the 77% WR 12H template and post-June selloff context support a disciplined MR long at ~$18.43, but regulatory probe noise, index exit selling, and missing fresh technical board data cap conviction — script-backed bounce sleeve vs headline overhang, not a clean rare-earth breakout; nominal risk stays on −10% / Pine exit.
Base case: 12H ALMA holds ~$17.50–19.50 · headline noise fades into range · slow grind if Wheat Ridge Q3 narrative stays intact.
Bear case: lose 12H ALMA · probe headlines accelerate · China-list symbolism triggers another flush · −10% toward ~$16.59 from ~$18.43 entry.
Chart: BATS:USAR 12H — ALMA Averaging Strategy.
Educational idea. Live position — past backtest ≠ future results. NFA.
Pre-Earnings Triangle in Tesla Tesla has been struggling all year, and now some traders may see risk of a break to the downside.
The first pattern on today’s chart is the tight range since July 2. The EV giant has made lower highs while remaining above roughly $390.50. That could be viewed as a bearish triangle, with potential for a move lower if support breaks.
Second, TSLA tried unsuccessfully to break its late-2024 high in December before making lower weekly highs. That may be consistent with a longer-term top.
Third, the 50-, 100- and 200-day simple moving averages are close to each other and essentially moving sideways. Could that long-term neutrality morph into bearishness?
Next, some chart watchers may see potential for prices to slide toward the 52-week low below $300.
Finally, TSLA is a highly active underlier in the options market. (Its average daily volume of 2.8 million contracts ranks second in the S&P 500, according to TradeStation data.) That could help traders take positions with calls and puts – especially with earnings due after the closing bell next Wednesday, July 22.
TradeStation has, for decades, advanced the trading industry, providing access to stocks, options and futures. If you're born to trade, we could be for you. Learn more here about TradingView’s Broker of the Year!
Past performance, whether actual or indicated by historical tests of strategies, is no guarantee of future performance or success. There is a possibility that you may sustain a loss equal to or greater than your entire investment regardless of which asset class you trade (equities, options or futures); therefore, you should not invest or risk money that you cannot afford to lose. Online trading is not suitable for all investors. View the document titled Characteristics and Risks of Standardized Options at www.TradeStation.com . Before trading any asset class, customers must read the relevant risk disclosure statements on www.TradeStation.com . System access and trade placement and execution may be delayed or fail due to market volatility and volume, quote delays, system and software errors, Internet traffic, outages and other factors.
Securities and futures trading is offered to self-directed customers by TradeStation Securities, Inc., a broker-dealer registered with the Securities and Exchange Commission and a futures commission merchant licensed with the Commodity Futures Trading Commission). TradeStation Securities is a member of the Financial Industry Regulatory Authority, the National Futures Association, and a number of exchanges.
Options trading is not suitable for all investors. Your TradeStation Securities’ account application to trade options will be considered and approved or disapproved based on all relevant factors, including your trading experience. See www.TradeStation.com . Visit www.TradeStation.com for full details on the costs and fees associated with options.
Margin trading involves risks, and it is important that you fully understand those risks before trading on margin. The Margin Disclosure Statement outlines many of those risks, including that you can lose more funds than you deposit in your margin account; your brokerage firm can force the sale of securities in your account; your brokerage firm can sell your securities without contacting you; and you are not entitled to an extension of time on a margin call. Review the Margin Disclosure Statement at www.TradeStation.com .
TradeStation Securities, Inc. and TradeStation Technologies, Inc. are each wholly owned subsidiaries of TradeStation Group, Inc., both operating, and providing products and services, under the TradeStation brand and trademark. When applying for, or purchasing, accounts, subscriptions, products and services, it is important that you know which company you will be dealing with. Visit www.TradeStation.com for further important information explaining what this means.
07-16-2026 Buy NIO 07-16-2026
NIO
B 5.05
S 5.17
A 0.16
NIO Rolls Out Five-Seater ES8: NIO rolled out a five-seat ES8 as June ES8 deliveries fell 22% M/M to 8,969. ES8 cumulative deliveries hit 120,000 on June 22. NIO led China large SUV and 400k‑yuan segments six months.
NIO Could Outperform Despite Tariff Risks: NIO Inc. (NIO) could outperform Chinese peers in Q2 on a strong model cycle and improved product mix; EU tariff hikes on plug‑in hybrids and local‑content rules pose risks to competitiveness.
AAPL Is Sitting on the Line — Waiting for the Room to AgreeAAPL is sitting right on top of my PD-15 high, and this is a key decision area for today.
The PD-15 range is based on the previous day’s final 15-minute candle. I use that high and low because it shows where price made its final stand before the session ended. It gives me a clean battle zone for the next trading day.
Today’s PD-15 levels:
PD-15 High: 328.30
PD-15 Low: 325.80
Right now, AAPL is above the PD-15 high, which means buyers still have a chance to control the move. But I’m not chasing just because price is above the range. I’m waiting for my ORB + Retest edge to confirm.
My process:
1. Let the first 15-minute Opening Range print.
2. Wait for a break with displacement.
3. Wait for a clean retest.
4. Look for a confirmation candle.
5. Confirm volume is behind the move.
Bullish Plan:
If AAPL holds above 328.30, breaks the Opening Range High, retests, and confirms with volume, I’ll watch for upside toward 333.30, then 335.80.
Bearish Plan:
If AAPL loses 328.30 and falls back into the PD-15 range, I’ll be cautious. The cleaner bearish setup comes if AAPL breaks below 325.80, retests, and confirms lower. Downside targets would be 320.80, then 318.30.
Key Levels:
- 328.30 = PD-15 High / buyer control level
- 325.80 = PD-15 Low / seller control level
- 333.30 = Call TP1
- 335.80 = Call TP2
- 320.80 = Put TP1
- 318.30 = Put TP2
For me, the trade is simple:
Above 328.30, buyers have control.
Inside the PD-15 range, I stay patient.
Below 325.80, sellers can take control.
I’m not predicting. I’m waiting for agreement.
YGO — Study the Levels. Wait for Agreement. Trade with Discipline.
Disclaimer: This idea is for educational purposes only and is not financial advice. I’m sharing my chart breakdown, levels, and trade plan. Always do your own research and manage your own risk.
PYPL: Stripe Bid $53B. Is $60.50 Enough?Six weeks after everyone wrote off its turnaround, PayPal just became the target in a $53 billion buyout bid — and jumped 17% in a single session because of it.
The bid on the table
Stripe and Advent International, with Block kicking in equity alongside them, offered $60.50 per share for PayPal — roughly $17 billion in equity backed by about $50 billion in committed bank financing. That's a real, financed offer, not a rumor. PYPL closed at 47.37 the day before the news leaked. It closed yesterday at 55.52, up 17.2%, which means the market is currently pricing this deal at roughly 80% odds of happening — a healthy premium already baked in, but still a real gap to the actual $60.50 offer.
The board hasn't said yes
PayPal's board hasn't accepted or rejected anything yet — they're expected to meet on this as soon as July 20. Until then, this stock trades on deal-probability math, not fundamentals. Michael Burry, who holds a PayPal stake, came out and called $60.50 too low, putting his own estimate of fair value between $75 and $115 a share, with $100 as his best guess. Whether or not you buy Burry's number, the point stands: the market isn't fully convinced $60.50 is where this ends, either.
The three prices that matter this week
MAKE-OR-BREAK 47.37 — the last price before the bid leaked. This is the floor if the deal collapses entirely and PayPal goes back to trading on its own turnaround story.
FIRST TEST 55.52 — yesterday's close, where the market currently has the deal priced at roughly an 80% chance of closing.
RECLAIM/TARGET 60.50 — the actual Stripe/Advent offer. Getting here means the market is pricing the deal as essentially done.
How this plays out
Deal confirmed or sweetened: a close above 55.52 that keeps climbing toward 60.50 says the market is growing more confident the board says yes — and if the offer gets raised (Burry isn't the only one who thinks $60.50 is light), the ceiling moves higher than 60.50 entirely.
Deal falls apart: a close back below 47.37 says the board rejected it, or talks broke down, and PayPal is back to trading as a standalone turnaround story with no acquisition premium.
Between 47.37 and 55.52 — no trade. That's the pocket where the deal is still alive but the board hasn't moved, and daily swings on nothing but rumor aren't worth chasing.
Invalidation
The bullish "deal happens" read dies below 47.37 — that's the price with zero acquisition premium in it. No shame in that; a stock two days into a buyout rumor hasn't earned a real range yet, and M&A situations can unwind on a single boardroom meeting.
The takeaway that isn't really about PayPal
This isn't a technical setup — it's a probability trade. The chart isn't telling you where PayPal "wants" to go next; it's telling you what odds the market has assigned to a board decision that hasn't happened yet. That's a different game than reading a breakout or a trendline, and it's worth knowing the difference: in an M&A situation, the stock price is a probability, not a forecast.
The board meets as soon as July 20. I will update this idea the moment there's real news — a formal response, a sweetened bid, or a walk-away.
NVDA Poked A New High At 213.81, Then Faded.NVDA Poked A New High At 213.81, Then Faded.
Nvidia pushed through 212.55 to a new high at 213.81 overnight - yesterday's up-path - then faded back to 209.15, holding above the reclaimed 207.59 but well off the high. The daily conviction has tipped into EUPHORIA now, which is a caution flag and not a green light, and the old daily bear print is still standing uncleared. On the hour, conviction faded to bottom-quartile as price rolled over. Momentum poked the high and could not hold it. Neutral.
Resistance: 212.55-213.81 - yesterday's high and the new high
Key resistance: 215.00 - open air above
Current price: 209.15
Support: 207.59 - reclaimed, the line to hold
Key support: 204.82 - interior support
Structural floor: 202.20 - the base, breakdown invalidation
Two paths from here:
The dip holds 207.59 and the high gets retested. If NVDA defends 207.59 and pushes back through 213.81, the euphoria resolves into a real trend leg and open air opens above. The base and the reclaim are both still intact.
Euphoria caps it and it slips. A fresh high that fails, daily euphoria, and an uncleared bear print are the classic stall setup. A loss of 207.59 puts 204.82 and the base back in play, and the fade becomes a lower high.
NVDA got the new high and immediately gave it back. 207.59 holds the structure; 213.81 is the level it has to reclaim to prove the high was real and not just a euphoric poke.
Built with SYNTHESIS v3.3 | SOM / ACE / IMP / SYNTHESIS
Study, not financial advice.
Week 24 of 52 SPCX The Most Important IPO of Our Generation?NASDAQ:SPCX is finally public, and the market is treating it exactly how you would expect: massive attention, huge volume, and immediate FOMO.
SpaceX is not just another IPO.
This is the company that turned reusable rockets from a crazy idea into one of the biggest technological advantages in the world. It built Starlink into the largest satellite internet network on the planet. It changed the economics of space launches. And now, it is finally trading in the public market.
That is why the hype is real.
SpaceX priced its IPO at $135 per share, raising a record $75 billion and reaching a valuation around $1.75 trillion. That makes this the largest IPO in history and immediately places SpaceX in the conversation with the biggest companies in the world.
The numbers are incredible.
In 2025, SpaceX reported approximately $18.67 billion in revenue, up 33% year over year. Starlink represented about 60% of total sales, supported by roughly 10.3 million users and around 9,600 satellites. That is not just a rocket company anymore. That is a launch business, a satellite internet business, a defense/space infrastructure business, and possibly one of the most ambitious AI/space platforms ever attempted.
But here is the part investors need to respect:
A historic company can still create a dangerous entry.
After pricing near $135, the stock quickly moved into the $150–$170 opening range. That first IPO move can be driven by scarcity, media attention, retail demand, institutional positioning, and the Elon Musk premium. That is where FOMO becomes powerful — and where bad entries are often created.
The first 1–2 months after a major IPO are usually not about “fair value.” They are about price discovery.
Early buyers take profits. Traders sell the first pop. Institutions reassess valuation. Underwriters may use the greenshoe option to stabilize trading. And retail investors who chased the excitement often get tested once the headline momentum cools down. SpaceX’s IPO also includes a greenshoe option that could allow underwriters to buy up to 15% additional shares at the IPO price, which is commonly used to help manage early trading volatility.
That is why my focus is not only on how incredible SpaceX is.
My focus is on where the market eventually builds a base.
SpaceX may become one of the most important public companies of the next decade. But even generational companies can go through a post-IPO cooling-off period before offering a cleaner long-term setup.
For me, the lesson is simple:
Do not confuse an incredible story with an automatic entry.
Do not chase maximum excitement.
Wait for structure.
Wait for price discovery.
Let the market show where real long-term demand is.
SpaceX may be historic.
But the smartest money usually does not buy the loudest moment.
Disclaimer: This idea is for educational purposes only and is not financial advice. Always do your own research and manage your risk.
Week 27 of 52 ASTS Bounce From Support… Or Just Another TrapNASDAQ:ASTS SpaceMobile is back in one of the most important decision zones on the chart.
After a massive run, ASTS failed twice near the $125–130 area, creating a clear double-top structure. From there, sellers pushed the stock all the way back into the $60–65 support zone — and so far, buyers defended it.
That defense matters.
But here is the key: the easy bounce already happened. From the $60s to the mid-$80s, ASTS has already made a strong recovery. Now the stock needs confirmation.
Bullish scenario:
If ASTS can hold above $78–80 and reclaim $95–100 with strength, bulls may regain control. Above $100, the next upside zones would be $105–110, and eventually a possible retest of the old double-top area near $120–130.
Bearish scenario:
If the stock rejects around $90–100 and loses $72–70, the bounce starts to look weaker. A retest of $60–65 would become likely. If that major support breaks, the next downside zone could be $50–55.
ASTS is not a normal valuation story yet. This is a high-execution, high-risk, high-reward company. The satellite story is real, the partnerships are real, and the recent BlueBird launch keeps the narrative alive. But the company is still early-stage financially, with small revenue compared to its market value and large ongoing losses.
That means the stock can move violently in both directions.
For now, ASTS is not a blind chase for me.
It is a confirmation setup.
Bulls need to prove strength above $95–100.
Bears need a breakdown below $70.
Until then, this is a battleground between momentum and execution risk.
Key levels:
Support: $78–80 / $60–65
Breakout zone: $95–100
Upside targets: $105–110 / $120–130
Bearish breakdown target: $50–55
Disclaimer: Educational content only. This is not financial advice. Always manage risk and position size.
NTRS Follow-Up: The Breakout Worked—Now the Trailing Stop Takes NTRS has now moved decisively above the resistance highlighted in the original setup.
The breakout was only the beginning.
After price escaped the tight base, the Sniper Alpha framework shifted from identifying the setup to managing the open trend. Rather than setting a fixed profit target, risk is progressively reduced by raising the trailing stop beneath the structure left behind by price.
Since the breakout:
The first trailing stop was raised beneath the initial post-breakout support.
The second trailing stop was moved higher after NTRS formed another higher swing low.
Price has continued advancing while the remaining position is given room to follow the trend.
This is an important distinction.
A strong trend rarely moves in a straight line. Pullbacks are expected, but as long as price continues forming constructive higher lows, the trade remains structurally healthy.
The objective is not to predict the exact top.
It is to protect capital, reduce open risk, and stay with the move until the structure provides a genuine reason to exit.
Sniper Alpha Framework:
Structure identified the opportunity.
The breakout confirmed the move.
Trailing stops now manage the position.
Risk first. Trend second. No prediction required.
This chart is a follow-up on an existing position and is not presented as a new entry signal.
SpaceX Returns to $135: What Would Confirm a Recovery?Hey traders, quick one here.
Many of you are probably wondering whether SpaceX is becoming a value buy after falling back towards its $135 IPO offer price.
Well let's examine several moving parts here...
There is a structural source of demand behind the stock.
SpaceX was added to the Nasdaq-100 on 7 July, meaning funds that track the index are required to hold it. This includes index products used within some retirement accounts, although it does not mean every 401(k) is automatically buying SpaceX.
That demand may provide support, but it does not settle the valuation question.
SpaceX does not currently have a meaningful positive P/E ratio
It reported a net loss of approximately $4.94 billion in 2025, followed by another $4.28 billion loss during the first quarter of 2026. Investors are therefore paying for the expected growth of Starlink, launch services, Starship and its other developing businesses, rather than current net earnings.
Now that the share price is back near the official $135 IPO offer price, what should traders look for before developing a higher-confidence bullish view?
The $135 level was the price paid by investors during the offering, while public Nasdaq trading began at approximately $150.
The earliest technical sign, in my opinion, would be a reclaim of the declining 1 hour 50-EMA band.
SPCX has remained beneath this band throughout its recent decline, with rebounds repeatedly failing around it. That keeps the short-term structure bearish and suggests sellers are still using recoveries to reduce exposure.
A move through the upper edge of the band would be the first step. However, a temporary break is not enough. Price would need to hold above the band and successfully defend it during a retest.
That would indicate that the 50-EMA band is beginning to shift from resistance into support.
Until that happens, the base case remains cautious. A sustained move below $135 would place SPCX beneath its IPO offer price and reopen downside price discovery.
A confirmed reclaim of the EMA band would improve the short-term picture and bring $150, SpaceX’s first public Nasdaq trading level, back into focus.
Key levels:
$135: Official IPO offer price
1H 50-EMA band: Immediate dynamic resistance
$150: First public Nasdaq trade and major recovery level
- Yang
NFLX Earnings Week Outlook (15-Minute Chart)Netflix heads into earnings sitting near the lower half of its recent range after several sessions of selling pressure. Even though I'm not exactly a Netflix fan, I actually find myself leaning bullish heading into earnings week. That doesn't mean I'm looking to blindly buy calls—it simply means I think the odds of an upside surprise are a little better than most traders currently expect.
The options market is pricing roughly an ±8.5% implied move following earnings. From current prices around $73.40, that suggests an expected range of approximately $67-$80 after the report. Keep that in mind because a move that looks massive may simply be what the options market already expected.
🟢 Bullish Scenario (My Lean)
If buyers reclaim the 74.14-75.47 area ahead of earnings, I could see NFLX grinding higher into the announcement before breaking above 76.33. A strong report could then push price toward 78.45 and even challenge the upper end of the implied move near $80.
This is the path I'm leaning toward, despite not being particularly bullish on Netflix as a company. Sometimes the chart and positioning matter more than personal opinions.
🔴 Bearish Scenario
If support around 72.60 gives way before earnings, momentum could accelerate lower quickly. A disappointing report could easily send NFLX toward the lower end of the implied move around $67, which lines up with a larger flush before buyers potentially step back in.
The downside risk is very real, especially during earnings when reactions tend to be exaggerated.
🟡 Sideways Scenario (The Theta Monster)
This is the one I hope we avoid.
NFLX could spend the next few sessions chopping between support and resistance without committing to either direction, letting the theta monster munch away all your premiums while both bulls and bears wait for earnings.
This is exactly why buying options too early into earnings can be frustrating.
Managing Earnings Risk
One thing to remember is that implied volatility (IV) is elevated heading into earnings. That means option premiums become expensive, and even if you're right on direction, the post-earnings IV crush can significantly reduce your gains.
Because of that, my preferred approach is:
Trade the run-up into earnings if momentum develops.
Take profits before the report rather than gambling on the announcement.
Then look to trade the post-earnings overreaction or continuation once the market shows its hand.
In my experience, there's often cleaner money to be made after earnings than trying to predict the report itself.
As always, I'll be relying on the Heavy Diligence Options Signals Indicator for entries. The scenarios above simply define where I think price has the highest probability of reacting. Once the indicator confirms the move, execution becomes much simpler.
Disclaimer: This is only a trade idea based on my interpretation of the chart and is not financial advice. Always do your own research, wait for confirmation, and manage your risk before entering any trade.
SpaceX Stock Dives Under $135 IPO Price, Down 40%. When Buy?Every blockbuster IPO has its honeymoon. Some last months. Others barely survive the first season.
SpaceX NASDAQ:SPCX is now discovering that even the world's biggest stock debut isn't immune to gravity.
Shares of Elon Musk's rocket company briefly slipped below their $135 IPO price on Wednesday, touching an intraday low of $132.15 before recovering to close at $135.27.
It's a far cry from the euphoric days of mid-June , when the stock rocketed to $225 and pushed the company's valuation above $3 trillion — briefly making SpaceX NASDAQ:SPCX worth more than Amazon NASDAQ:AMZN .
Since then, roughly 40% has evaporated from the share price, wiping more than $1 trillion off the company's peak market value. Even Musk has felt the turbulence, with the value of his net worth shrinking by about $500 billion, according to the Bloomberg Billionaires Index .
💸 Why the Rocket Lost Fuel
No single headline caused the selloff. Instead, several concerns have quietly piled up.
First comes valuation. Even after the recent decline, investors are still debating whether a company generating a handful of billions in revenue but remaining lossmaking deserves such a lofty price tag.
Then there's supply. SpaceX insiders are currently prevented from selling because of a post-IPO lock-up — a contractual period that stops early shareholders from immediately cashing out after a listing.
Once those restrictions begin to expire following the company's first quarterly earnings report in August (ref: Earnings calendar ) , more shares will gradually become available, potentially increasing selling pressure.
The bond market has also grown more cautious. SpaceX raised roughly $25 billion in debt just three weeks ago, yet those bonds have already underperformed many other high-grade corporate issues.
📈 Is This a Buying Opportunity?
That's the question every dip buyer (and bagholder) eventually asks.
History suggests that great companies don't always make great investments at every price. Sometimes the business keeps improving while the stock simply spends months catching up with reality.
This one quickly shifted from “to the moon” to “just go back to entry, I don’t even want profits anymore.”
Long-term investors often watch for catalysts rather than just lower prices. A catalyst is an event that could materially change how investors value a company — whether through stronger earnings, successful product launches or new contracts.
For SpaceX, several potential catalysts are approaching.
🌌 Eyes on Starship
The next one could arrive as soon as Thursday. SpaceX is preparing the 13th test flight of Starship, the fully reusable rocket designed to dramatically reduce the cost of reaching orbit.
If successful, Starship could unlock entirely new businesses, from larger satellite deployments to Musk's ambitious vision of orbital AI data centers.
The technology remains a work in progress. Previous test flights have delivered valuable engineering lessons, even when they didn't end exactly as planned.
The upcoming launch will continue refining the rocket's third-generation design, bringing the company another step closer to commercial operations.
🤔 Dreams, Deadlines and Reality
Musk has never been accused of thinking small. Eventually, SpaceX hopes to launch hundreds of Starships thousands of times each year.
That's an extraordinary vision, although investors have also learned to treat Musk's timelines with a healthy dose of skepticism. Millions of humanoid robots by 2025 and fleets of robotaxis were once just around the corner, yet both remain works in progress.
In the end, the stock's recent decline may say less about SpaceX's future than about expectations getting ahead of execution.
The company still sits at the heart of the commercial space industry, but Wall Street is asking for something it always asks after the excitement fades: less storytelling, more delivery.
Off to you : Is this a buying opportunity for you right now? Share your views in the comments!
$EOSE — Breakout from falling resistanceThe NASDAQ:EOSE chart shows a breakout from a falling resistance line that ended with a hammer candle, indicating a potential reversal. The support line, marked in yellow, is now being tested. If this line holds, it would confirm the uptrend and provide a good buying opportunity. However, if the price breaks below this line, it could lead to further downward movement. The reasoning behind this setup is that a break above the resistance line and a hold above the support line would indicate a change in market sentiment, making this a potentially profitable trade.
Not financial advice.