Long
Long
 Long
Long
 Long
Long
Trust the Candlesticks and Indicators NOT the NewsOver this past weekend the retail news and retail financial websites slammed MSTR stating their opinions with doom and gloom for MSTR. This stock is actually in a reinvention mode and its CEO was extremely careful in his statements about the future of MSTR, the name change to Strategy Inc, and how the company is projecting slow steady growth over time.
Retail traders and retail investors typically believe that a CEO is always lying. Nothing could be further from the truth. CEOs go to prison if they lie, exaggrate, over promote etc.
CEOs statements are carefully constructed to be factual, with minimal emotional content, without emotion, without bias, but clearly define the posture and projections for the company. They never project 30 years out as one news feed stated. Learn to read the candlesticks, identify Dark Pools, then Identify Professional Trader Nudges, and learn how to enter a trade with the professionals and let HFTs gap the stock upward. This is a superior way to make higher income trading stocks. Stop listening to the retail news.

 Long
Long
 Long
Long
3 US Stocks to Watch This WeekUS markets reopen after the Labor Day break with a shortened but busy week of company-specific catalysts. Oracle and Adobe report on Thursday, while GameStop releases its full quarterly results later today.
What makes the three worth watching is that each arrives with a very different chart. Adobe's recovery is testing whether the longer-term downtrend is beginning to change, Oracle is rebuilding after a volatile summer, while GameStop is bouncing back towards an important breakdown level.
Adobe: Is the longer-term trend beginning to change?
Adobe has recovered strongly from its June lows, with the rally through July and August taking price back above the 50-day moving average.
More recently, price has traded through the falling 200-day moving average before slipping back underneath. Rather than treating that moving average as resistance in its own right, its value here is as a reference for the broader trend. It is still falling, while the 50-day moving average has started to turn higher.
That leaves Adobe in an interesting position ahead of Thursday's earnings. The shorter-term trend has improved considerably since June, but there is not yet the same evidence of change in the longer-term picture.
Adobe Daily Candle Chart
Past performance is not a reliable indicator of future results
What happens after earnings should help us judge whether those two trends are beginning to come back into line. If price can establish itself above the 200-day moving average while the shorter-term trend continues to improve, the recovery starts to look more established. A deeper retracement of the August advance would make that argument harder to sustain.
The numbers themselves will put Adobe's AI strategy back under scrutiny, while the recent announcement that Anil Chakravarthy will replace Shantanu Narayen as chief executive later this year adds another element to the outlook.
Oracle: Putting the pieces back together
Oracle comes into Thursday's earnings with a very different chart.
The huge breakout in June didn't last. Price reversed sharply from its highs and eventually fell through an area that had repeatedly provided support earlier in the year, before finally finding a low in July.
Since then, some of that damage has been repaired. Oracle has climbed back above its former support and held above it during the latest pullback. Price is now pushing back towards the highs of the August recovery, while the 50-day moving average has started to flatten after several months of decline.
Oracle Daily Candle Chart
Past performance is not a reliable indicator of future results
The next question is whether Oracle can build on that improvement. A break through the recent recovery highs could add another higher high to the developing structure. Another failure around the same area would leave the recovery with more work to do, particularly while the longer-term trend remains lower.
There is plenty for Thursday's numbers to test. Oracle's previous results showed another sharp acceleration in cloud infrastructure growth and a huge increase in contracted business, much of it linked to AI. Attention now turns to how quickly that backlog is feeding through into revenue as Oracle continues investing heavily in additional infrastructure.
GameStop: Back to the breakdown
GameStop is probably the simplest chart of the three.
Price broke decisively through a well-established area of support at the beginning of August. The sell-off continued before finding a low later in the month, and the rebound since then is now taking price back towards the area that gave way.
That puts the focus firmly on how price behaves if that former support is tested from underneath.
GameStop Daily Candle Chart
Past performance is not a reliable indicator of future results
If GameStop can reclaim the old floor and begin holding above it, August's breakdown starts to look less convincing. If the rebound stalls beneath it and the shorter-term structure begins to weaken again, there would be much stronger evidence that former support is starting to act as resistance. Both the 50 and 200-day moving averages are also still falling, keeping the broader trend pointed lower for now.
Today's results are slightly different from a normal earnings release because GameStop has already published preliminary figures for the quarter. Some of the headline numbers are therefore already known, putting more emphasis on the detail behind them and what the company is doing with its sizeable balance sheet.
Reading the reaction
There is little value in trying to second-guess three sets of company results. The charts already give us a framework for judging what happens afterwards.
For Adobe, the question is whether the shorter-term recovery can develop into a broader change in trend. Oracle needs to build on the repair that has taken place since July, while GameStop needs to show that August's breakdown can be reversed.
The results provide the catalysts. How price behaves around the structure already sitting on each chart should tell us much more about what the market makes of them.
Disclaimer: This is for information and learning purposes only. The information provided does not constitute investment advice nor take into account the individual financial circumstances or objectives of any investor. Any information that may be provided relating to past performance is not a reliable indicator of future results or performance. Social media channels are not relevant for UK residents.
Spread bets and CFDs are complex instruments and come with a high risk of losing money rapidly due to leverage. 89% of retail investor accounts lose money when trading spread bets and CFDs with this provider. You should consider whether you understand how spread bets and CFDs work and whether you can afford to take the high risk of losing your money.
 Short
Short
 Long
Long
 Long
Long
 Long
Long
 Short
Short
Circle: Bulls Reclaim $84 — Can They Build on the Recovery?Recovery Gathers Momentum
CRCL has staged an impressive recovery from the significant $57.84 low, with price now approaching $100 after pushing to a recent high of $103.28. The earlier bullish RSI divergence at the lows proved an early warning that momentum was beginning to shift.
Former Support Successfully Reclaimed
The key $84 area, which had previously acted as support before breaking down in June, has now been reclaimed. More importantly, CRCL has successfully retested this area from above, giving bulls a much stronger platform to build from.
Buying Pressure Backs the Move
Buying volume has increased as price has moved higher, adding conviction to the recovery. RSI has also moved comfortably above 50 after working off overbought conditions, while StochRSI is currently mid-range.
100/50-Day EMAs Starting to Improve
The 100/50-day EMAs remain bearishly crossed, so the broader trend is not completely repaired. However, price has reclaimed both averages, and they are beginning to contract and slope higher, suggesting the underlying picture is gradually improving.
In Summary
CRCL has made significant progress since bottoming at $57.84, reclaiming the important $84 area and successfully retesting it as support. Stronger buying volume and the earlier bullish RSI divergence add weight to the recovery, while price has also moved back above the 100/50-day EMAs. Those averages remain bearishly crossed, so there is still work to do, but bulls are beginning to make a much stronger case if $84 continues to hold.  Long
Long
It's a time for CHARGEPOINT - potential 55% target / 12 USDThe CHPT chart shows several technical factors that support a bullish scenario toward the $12 level in the coming weeks or months, although this outcome is by no means guaranteed.
First, since the April low around $4.50–$5.00, the stock has been forming a series of higher lows, which is a classic sign of a developing uptrend. In recent weeks, the price has repeatedly defended the demand zone between $5.90 and $6.20, indicating strong buying interest at those levels.
Second, the trend indicator on the chart has shifted from red to green, signaling a transition from a bearish phase to a bullish one. In addition, the stock is trading above the trend line, suggesting that buyers currently have control of the short-term direction.
The key resistance area is now located between $7.80 and $8.30. The stock has tested this zone several times without experiencing a strong rejection, which often indicates accumulation before a breakout. If buyers can secure several daily closes above $8.00, it could trigger the next upward leg.
Once the $8.00 resistance is broken, the next technical target lies in the $10.50–$11.00 range, which is marked on the chart as a previous supply zone. A successful breakout above that level would open the door for a move toward the major resistance area around $12.00–$12.50, corresponding with a significant prior swing high.
From a fundamental perspective, ChargePoint remains one of the largest electric vehicle charging infrastructure providers in North America and Europe. The market continues to focus on the company’s efforts to improve profitability, reduce costs, and capitalize on the long-term growth of the EV industry. While the company is still not consistently profitable, investors are paying close attention to improving margins and operational efficiency.
Potential TP: 12 USD
Disclaimer: This analysis is provided for informational and educational purposes only and should not be considered financial, investment, or trading advice. The views expressed are based solely on technical chart interpretation and publicly available information at the time of writing. Financial markets involve risk, and past performance does not guarantee future results. Investors should conduct their own research, assess their individual risk tolerance, and consult a qualified financial advisor before making any investment decisions. The author assumes no responsibility for any financial losses resulting from the use of this analysis.  Long
Long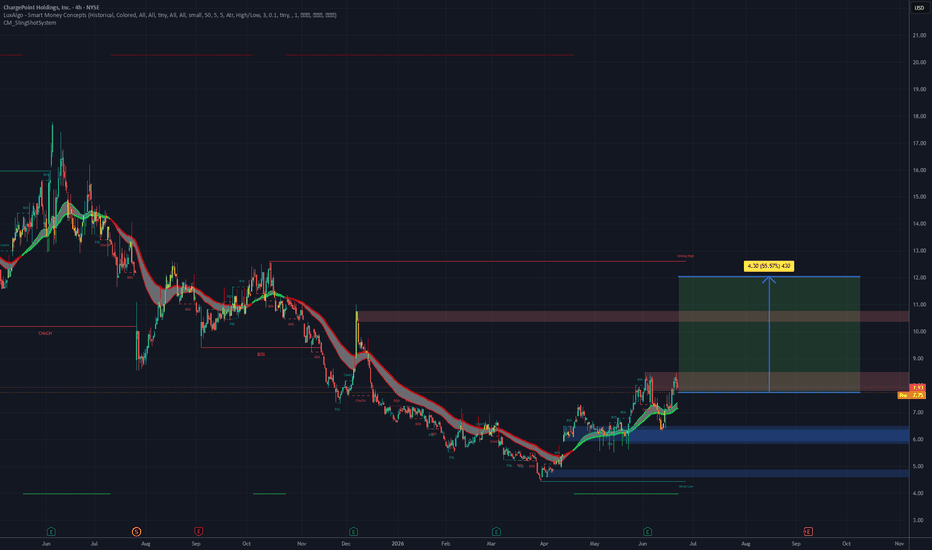
 Long
Long
 Long
Long
NVIDIA (NVDA) is going down: Crypto vs the Stock MarketSeeing a stock market crash is nothing to be happy about. Going through a bear market is nothing to celebrate. Yes, I can benefit from a period of contraction through short-selling, easily it can be done, but there is nothing positive about the upcoming period of contraction, something incredible is underway.
Bitcoin is growing massively, the strongest amount of trading activity in years is happening now. As Bitcoin and the altcoins market recover and grow, we are seeing the stock market, the SPX, NVDA and such, trading still close to resistance with a very strong long-term bearish structure, this chart is a perfect example.
NVIDIA (NVDA) peaked May 2026 and has been printing lower highs since. Most of the Cryptocurrency market hit bottom Q2 2026 and has been printing higher lows. This is it, this is the switch. Money will flow from the stock market to Crypto, just as predicted months ago. This setup has been in the making for an entire decade, Cryptocurrencies and the stock market developing an inverse correlation.
This chart here shows NVDA on the daily timeframe, a bearish cycle is already underway and what follows, purely based on technical analysis, is a major market flush/crash alas Crypto October 2025. When one of the major stock crashes, some of the others tend to follow but not always. We've seen how in the past few years the major stocks have been producing their own unique chart patterns and cycles, very strong variations. This is all about to change.
This NVDA chart leaves no room for doubt. There is literally no possibility of a bearish wave nullification, it is already confirmed based on the long-term chart structure, almost an entire year without growth.
Well, nothing is ever written in stone when it comes to the financial markets. If NVDA can stay above 212 there is hope, but nothing points to this event taking place. The chart is showing a major drop starting next week and this drop can lead to the lowest prices since 2025, visiting the lows from April and May, but we go step by step.
You can prepare by selling stocks and buying Crypto; sell those at resistance to buy those at support. The stock market has been rising for decades, an over-extended bull market. Crypto has been dropping for years, a brutal bear market.
The stock market peaked hitting major new all-time highs, the strongest bull market in the history of the world. Once everything is over-extended, the market tends to turn. On the other hand, the Cryptocurrency market is trading at support with a massive bullish breakout. There is still time to take action. NVIDIA is going down. You've been warned!
Namaste.  Short
Short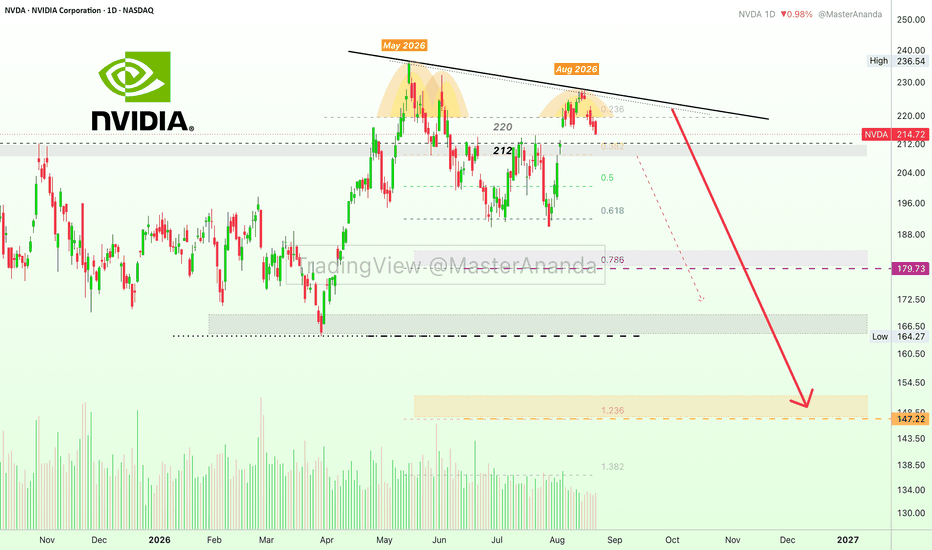
 Long
Long
 Long
Long