CNS - New 52-Week High Breakout + Record AUM & Strong Inflows📍 ENTRY: $81.60
🛑 **STOP LOSS:** $73.00 (Risk: $8.60)
🎯 **TAKE PROFIT:** $104.50 (Reward: $22.90)
📊 R:R RATIO: ~1:2.66
🔍 TECHNICAL ANALYSIS (The Setup):
CNS just hit a new 52-week high of $81.17 on July 16, 2026. The stock has been on a powerful run, up +21.60% over the last 3 months and +29.13% year-to-date.
The 52-week range is $58.39 – $81.17 — the stock is now trading at the upper end of its range, attempting a clean breakout into blue sky territory.
Key support: The 50-day MA sits at ~$74.52** and the **200-day MA at ~$68.65. My stop loss at $73.00 is placed below the 50-day MA and just above the 200-day MA, giving the trade room to breathe while protecting against a breakdown.
Key resistance: The $81.17** 52-week high is the immediate hurdle. A confirmed breakout above this level with volume would open the door to **$90+ and beyond.
Target at $104.50: This represents a measured move projection from the base formed over the past year and approaches the upper end of long-term historical levels.
📊 FUNDAMENTAL ANALYSIS (The Catalyst – Just Released!):
Cohen & Steers reported Q2 2026 earnings on July 16 and the results were exceptional:
✅ **AUM reached a record $100.1 billion** at quarter end, up from $93.1B in Q1 2026
✅ $1.3 billion in net inflows** — the **strongest quarter since Q4 2021**
✅ **Fourth consecutive quarter of organic growth** — the longest streak since 2022
✅ **Diluted EPS of $0.95 (GAAP) and $0.85 as adjusted**
✅ **Revenue of $151.8M (adjusted), beating the $146.05M consensus by $5.8M
✅ Operating margin expanded to 34.6%, up from 31.8% a year ago
✅ Active ETFs surpassed $1 billion in AUM with six ETFs in the market
CEO Joseph Harvey commented: "We are beginning to see the benefits of improving market conditions for our investment strategies and the investments we've made in the business to expand our capabilities."
2026 Outlook (from Q1 call guidance):
Compensation ratio expected to remain at 40%
G&A expected to increase in mid-single digits year-over-year
As-adjusted effective tax rate expected to stay at 25.5%
Analyst sentiment (mixed but with upside):
Firm Rating Price Target
Evercore ISI Outperform **$84** (raised from $82)
eToro consensus Moderate Buy $84
Consensus (S&P Global) Hold $71.33
🎯 TRADE STRATEGY:
Entry at $81.60:** Entering just above the **52-week high of $81.17, anticipating a confirmed breakout with momentum as the market digests the strong Q2 earnings.
SL at $73.00:** Placed safely **below the 50-day MA (~$74.52) and above the 200-day MA (~$68.65). If price loses this level, the bullish breakout thesis is invalidated.
TP at $104.50: A measured move projection from the base formed over the past year, representing a ~28% upside from entry.
⚠️ RISK MANAGEMENT:
Earnings volatility: The stock is up +21.6% over the last 3 months. A "sell the news" reaction could still occur despite the strong results.
Valuation concerns: CNS trades at a P/E of ~26.8x, which is elevated relative to traditional asset managers. The GF Value™ is ~$79.23, suggesting the stock is fairly valued to slightly overvalued at current levels.
Mixed analyst sentiment: The S&P Global consensus is "Hold" with a $71.33 price target, implying potential downside. However, Evercore maintains an Outperform rating with an $84 target.
Insider selling: Recent insider transactions show sales by executives, which could be a cautionary signal.
Dividend payout: The quarterly dividend of $0.67 per share yields ~3.3%, but the payout ratio is elevated.
💬 What are your thoughts? Is anyone else watching this 52-week high breakout, or do you expect a pullback before the next leg up?
⚠️ DISCLAIMER:
This is NOT financial or investment advice. This post reflects my personal opinion and analysis based on publicly available information. Trading and investing involve substantial risk, including the potential loss of your entire capital. Past performance does not guarantee future results. Always do your own research (DYOR) and consult with a licensed financial advisor before making any trading decisions. I am not responsible for any losses incurred.
#CNS #CohenSteers #Earnings #Breakout #52WeekHigh #TradingSetup #TechnicalAnalysis #Stocks #AssetManagement
GS Long — Analyst upgrades and bullish CEO commentary give GS thGS is pulling back into a neutral 4h structure with aligned swings and modest extension, sitting well below resistance; the cluster of fresh analyst upgrades and bullish CEO commentary on the economy supplies the catalyst that aligns with the LONG side and improves the odds of a bounce toward the measured target.
📍 Entry: 1062.80
🛑 Stop: 1028.70
🎯 Target: 1154.00
⚖️ R:R: 2.67
ON | Continued stock growth- Timeframe: Weekly
- Trade type: Buy stop order
- Price: 98.21
- Take Profit: Open
- Stop Loss: 86.47 (-11.90 %)
Idea: Long on a breakout above last week's high - bullish momentum continuation.
Entry: Buy stop above last week’s high.
Stop-loss: Below the low of the same candle.
If the weekly candle closes below this level, the trade is invalidated.
Take Profit: Trailing stop following the lows of new weekly candles.
MPWR | Continued stock growth- Timeframe: Weekly
- Trade type: Buy stop order
- Price: 1,388.53
- Take Profit: Open
- Stop Loss: 1,258.66 (-9.40 %)
Idea: Long on a breakout above last week's high - bullish momentum continuation.
Entry: Buy stop above last week’s high.
Stop-loss: Below the low of the same candle.
If the weekly candle closes below this level, the trade is invalidated.
Take Profit: Trailing stop following the lows of new weekly candles.
HIMS | May, 2026 | The time to go long has come- Timeframe: Weekly
- Trade type: Buy stop order
- Price: 26.64
- Take Profit: Open
- Stop Loss: 23.36 (-12.30 %)
Idea: Long on a breakout above last week's high — bullish momentum continuation.
Entry: Buy stop above last week’s high.
Stop-loss: Below the low of the same candle.
If the weekly candle closes below this level, the trade is invalidated.
Take Profit: Trailing stop following the lows of new weekly candles.
👉 Pionex | 200+ U.S. stock tokens | xStocks
Feel free to like and share your thoughts in the comments! ❤️
RBLX | The time to go long has come- Timeframe: Weekly
- Trade type: Buy stop order
- Price: 49.54
- Take Profit: Open
- Stop Loss: 44.70 (-9.80 %)
Idea: Long on a breakout above last week's high - bullish momentum continuation.
Entry: Buy stop above last week’s high.
Stop-loss: Below the low of the same candle.
If the weekly candle closes below this level, the trade is invalidated.
Take Profit: Trailing stop following the lows of new weekly candles.
GRAB | June, 2026 | The time to go long has come- Timeframe: Weekly
- Trade type: Buy stop order
- Price: 3.62
- Take Profit: Open
- Stop Loss: 3.34 (-7.70 %)
Idea: Long on a breakout above last week's high - bullish momentum continuation.
Entry: Buy stop above last week’s high.
Stop-loss: Below the low of the same candle.
If the weekly candle closes below this level, the trade is invalidated.
Take Profit: Trailing stop following the lows of new weekly candles.
NVIDIA | AI Momentum vs Profit Booking | Trading PlanNVIDIA at a Decision Point | Will AI Momentum Drive the Next Breakout?
NVIDIA remains one of the strongest leaders in the AI sector, but price is approaching a zone where institutional profit booking and fresh accumulation will determine the next move. While the long-term AI narrative remains intact, short-term volatility is likely to be driven by earnings expectations, semiconductor demand, and macroeconomic developments.
Market Drivers
🤖 Continued global investment in AI infrastructure.
💻 Strong demand for GPUs from cloud providers and enterprises.
🌍 Geopolitical tensions and semiconductor export policies remain key risks.
🏦 U.S. interest-rate expectations could influence growth-stock valuations.
Trading Plan
🟢 Bullish: Buy only after a confirmed breakout above resistance with strong volume.
🔴 Bearish: Failure to hold key support may trigger short-term profit booking before the primary trend resumes.
Trading Thesis
"NVIDIA isn't just trading on earnings—it's trading on the future of artificial intelligence. Let price confirm the next institutional move before chasing momentum."
Upside in Occidental?Occidental Petroleum has been climbing this month, and some traders may see further upside.
The first pattern on today’s chart is the quick bounce since July 1. The oil driller has paused in the last three sessions. Could the pullback be viewed as a bullish flag?
Second, recent consolidation has occurred around the lows of April and May. That zone initially held OXY back, but now that resistance may be breaking.
Third, the recent bounce started at the 200-day simple moving average. That may confirm a bullish longer-term trend.
Finally, the 8-day exponential moving average (EMA) has crossed above the 21-day EMA. MACD is also rising. Those signals could indicate short-term bullishness.
TradeStation has, for decades, advanced the trading industry, providing access to stocks, options and futures. If you're born to trade, we could be for you. Learn more here about TradingView’s Broker of the Year!
Past performance, whether actual or indicated by historical tests of strategies, is no guarantee of future performance or success. There is a possibility that you may sustain a loss equal to or greater than your entire investment regardless of which asset class you trade (equities, options or futures); therefore, you should not invest or risk money that you cannot afford to lose. Online trading is not suitable for all investors. View the document titled Characteristics and Risks of Standardized Options at www.TradeStation.com . Before trading any asset class, customers must read the relevant risk disclosure statements on www.TradeStation.com . System access and trade placement and execution may be delayed or fail due to market volatility and volume, quote delays, system and software errors, Internet traffic, outages and other factors.
Securities and futures trading is offered to self-directed customers by TradeStation Securities, Inc., a broker-dealer registered with the Securities and Exchange Commission and a futures commission merchant licensed with the Commodity Futures Trading Commission). TradeStation Securities is a member of the Financial Industry Regulatory Authority, the National Futures Association, and a number of exchanges.
TradeStation Securities, Inc. and TradeStation Technologies, Inc. are each wholly owned subsidiaries of TradeStation Group, Inc., both operating, and providing products and services, under the TradeStation brand and trademark. When applying for, or purchasing, accounts, subscriptions, products and services, it is important that you know which company you will be dealing with. Visit www.TradeStation.com for further important information explaining what this means.
Broadcom May Be SlidingBroadcom began last month with a sharp selloff, and some traders may see further downside in the chip giant.
The first pattern on today’s chart is the June 4 drop following quarterly results. AVGO has remained entirely below that gap since, so it may represent a bearish reversal.
Second, the stock has made lower lows and lower highs since the decline. Does the resulting channel mark a new downtrend?
Third, falling MACD may reflect weak momentum. It also created potentially bearish divergence in June, failing to confirm new highs on the price chart.
Fourth, the 8-day exponential moving average (EMA) has stayed under the 21-day EMA. That may reflect a short-term downtrend.
Next, prices recently bounced at the 200-day simple moving average. Closing under that line could signal a longer-term breakdown.
Finally, AVGO is an active underlier in the options market. (Its average daily volume of 275,600 ranks 15th in the S&P 500, according to TradeStation data.) That could help traders take positions with calls and puts.
TradeStation has, for decades, advanced the trading industry, providing access to stocks, options and futures. If you're born to trade, we could be for you. Learn more here about TradingView’s Broker of the Year!
Past performance, whether actual or indicated by historical tests of strategies, is no guarantee of future performance or success. There is a possibility that you may sustain a loss equal to or greater than your entire investment regardless of which asset class you trade (equities, options or futures); therefore, you should not invest or risk money that you cannot afford to lose. Online trading is not suitable for all investors. View the document titled Characteristics and Risks of Standardized Options at www.TradeStation.com . Before trading any asset class, customers must read the relevant risk disclosure statements on www.TradeStation.com . System access and trade placement and execution may be delayed or fail due to market volatility and volume, quote delays, system and software errors, Internet traffic, outages and other factors.
Securities and futures trading is offered to self-directed customers by TradeStation Securities, Inc., a broker-dealer registered with the Securities and Exchange Commission and a futures commission merchant licensed with the Commodity Futures Trading Commission). TradeStation Securities is a member of the Financial Industry Regulatory Authority, the National Futures Association, and a number of exchanges.
Options trading is not suitable for all investors. Your TradeStation Securities’ account application to trade options will be considered and approved or disapproved based on all relevant factors, including your trading experience. See www.TradeStation.com . Visit www.TradeStation.com for full details on the costs and fees associated with options.
Margin trading involves risks, and it is important that you fully understand those risks before trading on margin. The Margin Disclosure Statement outlines many of those risks, including that you can lose more funds than you deposit in your margin account; your brokerage firm can force the sale of securities in your account; your brokerage firm can sell your securities without contacting you; and you are not entitled to an extension of time on a margin call. Review the Margin Disclosure Statement at www.TradeStation.com .
TradeStation Securities, Inc. and TradeStation Technologies, Inc. are each wholly owned subsidiaries of TradeStation Group, Inc., both operating, and providing products and services, under the TradeStation brand and trademark. When applying for, or purchasing, accounts, subscriptions, products and services, it is important that you know which company you will be dealing with. Visit www.TradeStation.com for further important information explaining what this means.
AAPL | July 17 | New Highs & Trend ContinuationIn today's review of Apple (AAPL), I walk through my top-down analysis process to understand how price is behaving as it continues to push into new highs.
Starting from the higher timeframes, I establish the overall market context and identify the key levels that may influence price throughout the session. With AAPL continuing to trend higher, the focus shifts from trying to call a reversal to identifying where healthy pullbacks and continuation opportunities may develop.
A major topic in today's review is using TradingView alerts to stay connected to the market. If you can't watch the charts all day, setting alerts at important levels allows price to come to you instead of chasing every move.
By combining higher-timeframe context, trend analysis, and key price levels, we can build confluence and make more disciplined trading decisions.
In this video, I cover:
• Higher-timeframe market context
• Understanding why AAPL continues to trend higher
• Identifying key areas of interest around new highs
• Using TradingView alerts to avoid watching the chart all day
• Building confluence through trend, structure, and price action
The goal is not to predict every move, but to develop a repeatable process that helps identify high-probability opportunities while removing emotion from decision-making.
As always, the focus remains on confirmation over prediction.
**Dad Joke of the Day:** My TradingView alerts are like my kids... they only get my attention when they start making noise.
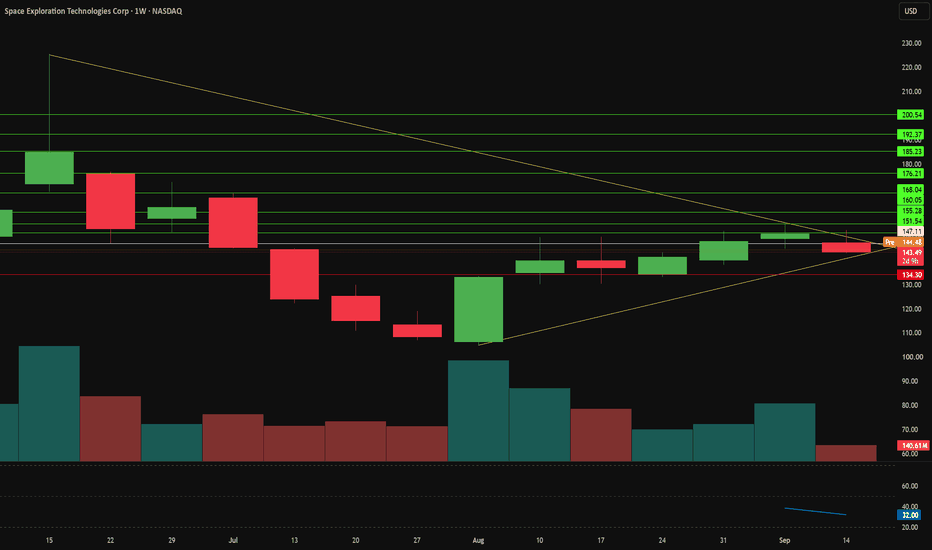
SPCX: The Trillion-Dollar Ego Float & The Staggered Unlock Trap🚀 💸 📉 🪓 🚀 💸 📉 🪓
Let's be totally honest about the massive SpaceX listing (NASDAQ: SPCX): this historic IPO was engineered from day one as the ultimate liquidity vanity project.
By floating a tiny, minuscule slice of the company (roughly 3.3% to 4.2% of the actual equity) and leaving 95%+ securely locked up, the market makers engineered an extreme supply-squeeze.
The result? A highly manipulated paper valuation pushing $1.77 trillion, giving the illusion of the world’s first trillionaire on paper while everyday retail traders chase the momentum.
If you are an early pre-IPO investor or an employee sitting on shares, the playbook here isn't to buy the hype—it's to aggressively delta-hedge or build a synthetic short strategy around the upcoming unlock dates to lock in your pricing before the tidal wave of supply hits the secondary market.
📅 【 THE STAGGERED SUPPLY AVALANCHE: UNLOCK DYNAMICS 】
* **Initial Float:** 555 Million Shares
➔ 𝘚𝘵𝘳𝘶𝘤𝘵𝘶𝘳𝘢𝘭 𝘙𝘦𝘢𝘭𝘪𝘵𝘺: A tiny sandbox with low-20% retail allocation designed to maximize artificial volatility.
* **Conditional Trigger (Trades > $176):** Activated
➔ 𝘚𝘵𝘳𝘶𝘤𝘵𝘶𝘳𝘢𝘭 𝘙𝘦𝘢𝘭𝘪𝘵𝘺: Cracking 30% above the $135 IPO base price mechanically opens an extra 10% insider tranche, capping the asset instantly.
* **August 11 (Q2 Earnings):** ~1 Billion Shares Unlocked
➔ 𝘚𝘵𝘳𝘶𝘤𝘵𝘶𝘳𝘢𝘭 𝘙𝘦𝘢𝘭𝘪𝘵𝘺: Up to 20% of core insider holdings flood straight onto the tape.
The upward momentum breaks here.
* **Rolling Time Blocks:** 350M Shares Exiting Every 15 Days
➔ 𝘚𝘵𝘳𝘶𝘤𝘵𝘶𝘳𝘢𝘭 𝘙𝘦𝘢𝘭𝘪𝘵𝘺: Staggered 7% tranches hitting at 70, 90, 105, 120, and 135 days post-IPO ensure continuous, aggressive dilution.
* **Late October / November:** Final Major Tranches
➔ 𝘚𝘵𝘳𝘶𝘤𝘵𝘶𝘳𝘢𝘭 𝘙𝘦𝘢𝘭𝘪𝘵𝘺: The secondary market becomes entirely oversaturated with paper.
The ultimate liquidity trap springs shut.
⚠️ Note on the Chief Operator: While the political elite and institutional capital bow to the allure of the paper trillionaire, remember that Elon Musk's personal 42% stake is under a strict 366-day hard lockup.
His trillionaire status is an illiquid phantom, purely useful for flexing power while the remaining insider blocks quietly distribute into retail hands.
📉 Technical Coordinates: SPCX to Earth
The daily price action tracked shows the structural reality of the post-IPO distribution.
The initial euphoric push to the $225.64 high has entirely dissolved, and the stock is hovering flatly at $153.23.
➔ ➔ ➔ ➔
Immediate Resistance ($176.00): The conditional unlock ceiling.
Any attempt to pump the stock past this level is immediately met with institutional selling blocks.
Target 1 ($102.20): The first structural decompression target visible
This represents the clean erasure of the IPO premium once the August earnings release unlocks hit the tape.
Target 3 ($25.88): The true fundamental valuation zone. Stripping away the hype and the xAI/social-media baggage, the real baseline value of the underlying rocket enterprise sits closer to the $20-$25 channel.
⚡ The Macro Coffin: OpenAI & Anthropic Cascades
This isn't an isolated event; it is the opening act of a systemic liquidity drain.
SpaceX is simply the first monstrous money grab out of the gate, designed to suck up the remaining retail liquidity at the absolute peak of the cycle.
Waiting in the wings are the massive public listings of OpenAI and Anthropic, both of which have already quietly filed initial documents.
When these massive, capital-incinerating entities simultaneously hit the public exchanges, they will act as the final nails in the coffin of this multi-year tech bull run.
Expect a violent macro liquidity migration that will drag the broader indexes down past the initial 7,000 threshold, accelerating into a proper, structural bear market targeting sub-6,000 territory.
Protect your capital, watch the unlock dates on SPAC-X and let the retail crowd hold the bag while you short the distribution.
#SpaceXIPO #SPCX #ElonMusk #InitialPublicOffering #Nasdaq #TechnicalAnalysis #ShortSetup #UnlockSchedule #MacroAlpha #TradingView #LiquidityDrain #TechBubble #BearMarket #HedgingStrategy #PreIPO
Netflix - Watch the tapeI've been on the sidelines sat mostly in cash. I anticipated this drop in the market, I warned you all about oil prices and the euphoria in semis. Now i'm looking to deploy cash, I have turned my attention to core compounding machines that have been forgotten about.
Netflix has dropped over 50% from its highs and is now trading around fair value. Does it offer a margin of safety at this level? I calculate the fair value around $66, so I have taken a nibble here but I want to fill my position lower - ideally at $50.
A few points to note:
- GAAP P/E is around 20.75x.
- The mature engine (North America) is reaching its ceiling. YoY growth decelerated from 18% in Q4 2025, to a flat 10% in Q2 2026. There is also growth decay in across other regions.
- The $8.99 ad supported tier accounted for over 60% of all Q1 sign ups, their advertising revenue is now at $3 billion for full year 2026.
- Slowdown in
- Management deployed a record $4.7bn share buyback in Q2 alone.
- We appear to be in wave C of the ABC pattern.
- We could close the gap down to $50, this would offer a solid 25% MOS.
I plan to build this position slowly, getting more aggressive as we close the gap. There's no hurry, I don't fomo into positions. It'll take management time to turn this ship around, I will be around to buy shares from the weak hands as the drop continues.
Not financial advice, do what's best for you.
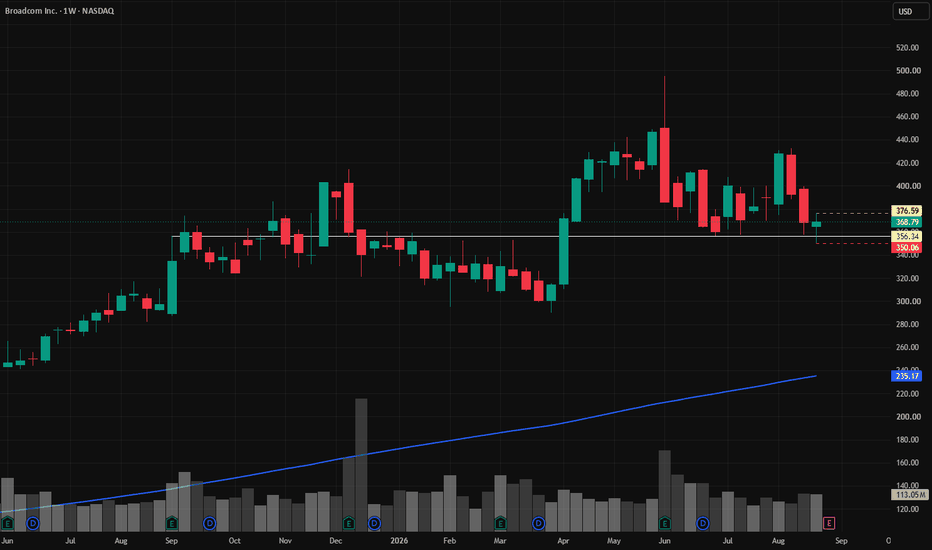
BROADCOM rejected its 1D MA50 and headed to $300.Broadcom Inc. (AVGO) got rejected yet again last Thursday on its 1D MA50 (blue trend-line). So far the 1D MA200 (orange trend-line) is in Support but the medium-term trend remains heavily bearish after the June 03 rejection on the long-term Higher Highs trend-line.
If the 1D MA200 breaks and closes a candle below it, expect the stock to seek its multi-month Support Zone and target the 1W MA100 (red trend-line), which is the market's long-term Support, around $300.
---
** Please LIKE 👍, FOLLOW ✅, SHARE 🙌 and COMMENT ✍ if you enjoy this idea! Also share your ideas and charts in the comments section below! This is best way to keep it relevant, support us, keep the content here free and allow the idea to reach as many people as possible. **
---
💸💸💸💸💸💸
👇 👇 👇 👇 👇 👇
NVDA Is Back At 202.20 - The Line That Decides The Base.NVDA Is Back At 202.20 - The Line That Decides The Base.
The euphoria cap kept working. NVDA has fallen from the 213.81 high all the way back to 202.20 over three sessions, losing 207.59 and 204.82 on the way, and is now testing the base itself at 202.49. It swept a low right at the line. This is the level that has held the entire base - hold it and the structure is intact, lose it and the base fails. Short pressure is maxed on the higher timeframe and the daily is still in euphoria. Momentum is down, but price is sitting on the one level that matters. Neutral.
Resistance: 204.82 - first level to reclaim
Key resistance: 207.59 - the lost breakout level
Current price: 202.49
Support: 202.20 - the base, the make-or-break line
Key support: 199.89 - first shelf below the base
Structural floor: 197.13 - deeper support
Two paths from here:
The base holds 202.20 and the swept low bounces. Three days down into the exact base level with a low swept is a reversal setup. If 202.20 holds and NVDA reclaims 204.82, the drop was a shakeout and the base survives. The line does its job until it does not.
The base fails on a close. Maxed short pressure and euphoria unwinding can drive right through support. A close below 202.20 breaks the base that has held for weeks and opens 199.89, then 197. Below the base, the trend changes.
NVDA gave the entire run back and is now standing on 202.20. Everything hinges here - a hold and a reclaim of 204.82 says shakeout, a close below 202.20 says the base is gone.
Built with SYNTHESIS v3.3 | SOM / ACE / IMP / SYNTHESIS
Study, not financial advice.
WALL STREET IS COUNTING EVERYTHING AGAIN—EXCEPT THE CASHThe 2026 numbers investors cannot stop quoting: AI revenue, RPO, backlog, bookings, users and gigawatts—and what each one is actually worth
Evidence date: 17 July 2026
Every market cycle develops a favourite number.
During one cycle it is users. In another, total addressable market. Then it becomes subscribers, gross merchandise value, orders, capacity or adjusted EBITDA.
In 2026, the fashionable numbers are even larger: Oracle has $638 billion of remaining performance obligations. CoreWeave has almost $100 billion of revenue backlog. GE Vernova has $163 billion of backlog. Uber processed $53.7 billion of Gross Bookings in one quarter. Snowflake has $9.21 billion of RPO. Broadcom expects billions of dollars of AI semiconductor revenue every quarter.
The numbers are real. The mistake begins when a real operating number is treated as if it were already shareholder value.
Operating metric → Revenue → Operating profit → Taxes → Reinvestment → Free cash flow → Risk and probability → Present value
That chain is the framework. This time, instead of revisiting NVIDIA, Palantir, Amazon, Meta or Tesla, we will apply it to seven additional US stocks that sit directly inside the hottest 2026 themes.
This is not a list of stocks to buy or avoid. It is a test of evidence: how far has each headline metric actually travelled towards free cash flow per share?
1. ORACLE: $638 BILLION OF RPO—AND NEGATIVE $23.7 BILLION OF FREE CASH FLOW
Oracle may be the cleanest 2026 example of why backlog and value are not the same thing.
At the end of FY2026, Oracle reported:
Remaining performance obligations of $638 billion , up 363% year over year
FY2026 revenue of $67.4 billion
Cloud revenue of $34.0 billion
Cloud Infrastructure revenue of $18.1 billion , up 77%
GAAP operating income of $20.6 billion
Operating cash flow of $32.0 billion
Capital expenditure of $55.7 billion
Free cash flow of negative $23.7 billion
The cloud demand is genuine. Q4 IaaS revenue grew 93%, and management said much of the recent RPO increase came from large AI contracts. But recognizing that RPO will require data centres, GPUs, power and years of execution.
Oracle also disclosed a useful detail: $75 billion of its large AI-contract commitments involved hardware prepaid or supplied by customers. That reduces Oracle's capital burden. It does not eliminate the need to examine the timing, margins and financing attached to the rest of the backlog.
The bridge currently looks like this:
AI contracts → $638B RPO → gradual cloud revenue → operating cash flow → massive data-centre capex → currently negative FCF
What matters next:
How much RPO converts within 12, 24 and 36 months?
What operating margin does the new AI infrastructure earn after depreciation?
Does capex growth slow before operating cash flow does?
How much funding comes from customers versus Oracle's own balance sheet?
Does free cash flow turn positive as commissioned capacity begins generating revenue?
Framework verdict: Demand pass; reinvestment bridge under maximum stress.
Human version: a signed cloud contract is economically useful, but the data centre must still be built and paid for before the contract becomes shareholder cash.
2. COREWEAVE: THE BACKLOG IS ENORMOUS—SO ARE THE CAPITAL REQUIREMENTS
CoreWeave reported Q1 2026 revenue backlog of $99.4 billion and quarterly revenue of $2.08 billion , more than double the prior-year period. It had surpassed 1 GW of active power and reported more than 3.5 GW of contracted power.
Those numbers place CoreWeave directly at the centre of AI-infrastructure demand. But its income and cash-flow statements show why backlog cannot be valued in isolation:
GAAP operating loss: $144 million
Net interest expense: $536 million
GAAP net loss: $740 million
Adjusted EBITDA: $1.16 billion
Cash from operations: $2.98 billion
Purchases of property and equipment: $7.70 billion
Subtracting reported property purchases from operating cash produces a simplified quarterly cash deficit of roughly $4.7 billion before considering financing flows. The company also had approximately $24.9 billion of current and non-current debt at quarter-end.
Why can adjusted EBITDA look strong while GAAP profit and post-capex cash look weak? Because depreciation, financing and infrastructure investment are central—not peripheral—to an AI cloud.
The company itself defines backlog broadly enough to include RPO plus other estimated future revenue under committed contracts, subject to delivery and service availability. Therefore, power, GPU supply, construction timing and customer concentration all sit between backlog and recognized revenue.
What matters next:
Backlog conversion rather than backlog growth alone
Revenue produced per active megawatt
Utilization after new capacity comes online
Interest expense as a percentage of revenue
Post-capex cash flow and new financing required per dollar of growth
Customer concentration and contract protections
Framework verdict: Revenue conversion visible; equity-cash bridge incomplete and financing-dependent.
Human version: the demand may be extraordinary, but lenders, equipment suppliers and construction spending reach the cash flow before common shareholders do.
3. BROADCOM: WHEN THE AI NUMBER ALREADY REACHES FREE CASH FLOW
Broadcom offers the opposite comparison.
In Q2 FY2026 it reported:
Total revenue of $22.19 billion , up 48%
AI semiconductor revenue of $10.8 billion , up 143%
GAAP net income of $9.31 billion
Adjusted EBITDA of $15.24 billion
Operating cash flow of $10.49 billion
Free cash flow of $10.26 billion , or 46% of revenue
Management expected Q3 AI semiconductor revenue of approximately $16 billion. More importantly, AI revenue is not merely a pipeline or capacity target. It is already included in reported semiconductor revenue and is accompanied by substantial free cash flow.
The bridge is comparatively short:
Custom AI accelerators and networking demand → semiconductor revenue → operating profit → operating cash → FCF
The remaining risk is not whether AI has started monetizing. It is whether current growth is durable. Custom accelerators can create deep customer relationships, but they can also produce concentration, product-cycle and bargaining-power risk. Investors must also separate AI growth from the infrastructure-software economics acquired with VMware.
What matters next:
AI revenue growth by accelerator and networking demand
Customer concentration and the number of hyperscale programmes
GAAP versus adjusted operating economics
FCF conversion after integration costs, interest and working capital
Whether growth remains broad when individual chip programmes change generation
Framework verdict: Strong operational and cash-flow pass.
Human version: Broadcom's AI claim is easier to audit because the story has already arrived in the cash-flow statement.
4. SNOWFLAKE: RPO AND RETENTION LOOK STRONG, BUT DILUTION CANNOT DISAPPEAR
Snowflake reported Q1 FY2027:
Product revenue of $1.33 billion , up 34%
Net revenue retention of 126%
Remaining performance obligations of $9.21 billion , up 38%
779 customers generating more than $1 million of trailing product revenue
GAAP operating loss of $326 million
Free cash flow of $233 million
Adjusted free cash flow of $266 million
RPO indicates contracted future business, while 126% net revenue retention means the existing customer base is spending more after churn and contraction. Both are valuable signals.
But Snowflake uses a consumption model. A contract does not guarantee that revenue will arrive evenly, and optimization by customers can affect usage. More importantly, Q1 stock-based compensation was approximately $402 million —larger than reported free cash flow.
SBC is non-cash in the quarter, but not economically free. If it increases diluted shares, part of the company's future cash flow belongs to additional shares.
RPO and consumption → product revenue → GAAP operating result → operating cash → FCF → divide by diluted shares
What matters next:
Product-revenue growth relative to RPO growth
Net revenue retention without excessive discounts
GAAP operating-loss improvement
SBC as a percentage of revenue
FCF per diluted share—not only company-level adjusted FCF
AI workloads that create paid consumption rather than demonstrations
Framework verdict: Commercial bridge passes; GAAP profitability and dilution remain the missing pieces.
Human version: cash flow is more valuable when the same shareholders still own roughly the same percentage of it.
5. GE VERNOVA: THE POWER BACKLOG IS STARTING TO SHOW MARGINS
The AI buildout is not only a semiconductor story. Data centres need turbines, transformers, grid equipment and reliable electricity.
GE Vernova's Q1 2026 numbers included:
Orders of $18.3 billion , up 71% organically
Total backlog of $163 billion
Gas Power backlog and slot reservations of 100 GW
Revenue of $9.3 billion
Adjusted EBITDA of $0.9 billion , with a 9.6% margin
Free cash flow of $4.8 billion
Raised FY2026 FCF guidance of $6.5–7.5 billion
This is a stronger backlog bridge than a company that has not yet demonstrated execution. Revenue, adjusted margin and cash generation are all moving in the right direction.
Still, two adjustments matter. First, reported Q1 net income included $4.5 billion of pre-tax M&A gains, primarily related to Prolec GE; that should not be treated as recurring operating profit. Second, quarterly free cash flow can be affected by customer advances and working-capital timing in long-cycle businesses.
What matters next:
Backlog conversion schedule by equipment and services
Price, cost and warranty assumptions on long-duration contracts
Adjusted EBITDA margin as deliveries increase
Customer advances versus sustainable cash generation
Service revenue attached to the installed equipment base
Whether data-centre demand adds capacity without damaging project discipline
Framework verdict: Strong backlog-to-revenue bridge; normalize gains and working capital before valuing cash flow.
Human version: a turbine slot has more value when the manufacturer can deliver it at an attractive margin and later earn service revenue from the installed base.
6. UBER: $53.7 BILLION OF BOOKINGS DOES NOT BELONG TO UBER
Uber completed 3.64 billion trips in Q1 2026 and reported 199 million monthly active platform consumers. Gross Bookings reached $53.7 billion .
But Gross Bookings represents the total value moving through the platform. Drivers, couriers, merchants, taxes and other parties receive much of that amount.
Uber itself reported:
Revenue of $13.2 billion
GAAP operating income of $1.92 billion
Adjusted EBITDA of $2.5 billion
Operating cash flow of $2.4 billion
Free cash flow of $2.3 billion
That gives us a visible conversion chain:
Consumers and trips → Gross Bookings → Uber's revenue/take → operating income → FCF
Uber One had reached 50 million members, with members driving half of Mobility and Delivery Gross Bookings. That can improve frequency and retention, but investors should still test the cost of membership benefits and incentives.
Autonomous vehicles add a separate layer. A partnership-based, capital-efficient AV strategy can expand the network without Uber owning every vehicle. But future AV value should depend on actual paid trips, utilization, insurance/liability economics and the share retained by Uber and its partners.
What matters next:
Gross Bookings growth versus revenue growth
Operating income and FCF as percentages of bookings
Insurance, incentives and driver/courier economics
Uber One retention and incremental profitability
Paid autonomous trips and economics per trip—not announcements alone
Framework verdict: Strong marketplace conversion; AV optionality remains probability-weighted.
Human version: the money passing through the app is not the money Uber keeps.
7. APPLOVIN: THE AI ADVERTISING STORY ALREADY PRODUCES CASH—TRANSPARENCY IS THE NEXT TEST
AppLovin's Q1 2026 results were financially powerful:
Revenue of $1.84 billion , up 59%
Net income of $1.21 billion
Adjusted EBITDA of $1.56 billion
Operating cash flow of approximately $1.3 billion
Free cash flow of approximately $1.3 billion
Unlike an AI company selling only a future vision, AppLovin's advertising technology is already producing revenue, profit and cash.
The analytical challenge is different: ad platforms are less transparent than order-book businesses. Investors need evidence that improved advertiser outcomes—not temporary pricing, customer mix or traffic-acquisition choices—drive the economics.
What matters next:
Revenue growth alongside advertiser retention and diversification
Incremental revenue converted into GAAP operating profit
Difference between adjusted EBITDA and GAAP earnings
Traffic-acquisition, platform and privacy/regulatory risks
Durability of FCF after taxes, working capital and capital returns
Framework verdict: Strong reported cash bridge; durability and transparency require continued testing.
Human version: an algorithm can be valuable without revealing every detail, but investors still need repeatable financial evidence that the advantage is durable.
THE 2026 EVIDENCE SCORECARD
These scores grade the completeness of the metric-to-cash evidence. They do not say whether a share is cheap or expensive.
Broadcom — 9/10: AI revenue already converts into substantial FCF
Uber — 8/10: bookings-to-revenue-to-FCF bridge is visible
GE Vernova — 8/10: backlog conversion and margins improving; normalize working capital and gains
AppLovin — 8/10: strong profit and cash; durability is harder to observe externally
Snowflake — 7/10: strong commercial metrics and positive FCF; GAAP loss and SBC remain material
Oracle — 6/10: extraordinary contracted demand; capex currently overwhelms operating cash
CoreWeave — 4/10: revenue growth is real; debt, interest and construction consume the economics
THE PRACTICAL TEST: FIVE NUMBERS TO WRITE DOWN BEFORE EVERY EARNINGS CALL
For any stock promoted using AI revenue, backlog, RPO, bookings or capacity, record these five figures before reading management commentary:
Conversion ratio: recognized revenue divided by the relevant operating metric over a sensible period
GAAP operating margin: after normal operating costs, before unusual investment gains
Reinvestment rate: capex plus working-capital needs relative to operating cash
Financing burden: interest and net debt relative to revenue and cash generation
Per-share result: normalized FCF divided by the diluted share count
Then write one sentence that can be proven wrong:
“If the metric is genuinely creating value, revenue conversion, normalized margins and free cash flow per share should improve by ______ within ______ quarters.”
If a thesis cannot be expressed with a measurable deadline, it may be a story rather than an analysis.
FINAL CONCLUSION
The hottest US-stock numbers of 2026 are not imaginary. AI revenue is growing. Cloud contracts are being signed. Power equipment is being reserved. Consumers are completing more trips. Enterprises are consuming more data.
But the framework reveals that these companies occupy very different economic positions.
Broadcom's AI number already reaches free cash flow. Uber's bookings pass through a visible take-rate and profit bridge. GE Vernova's backlog is converting with improving margins. Snowflake produces cash but must account for dilution. Oracle has extraordinary demand while current capex overwhelms cash generation. CoreWeave shows most clearly that backlog, EBITDA and equity cash can tell three different stories.
A huge number is not automatically a valuable number. Its value depends on how much reaches free cash flow per share, when it arrives, and what must be risked to produce it.
That is the discipline for 2026: count the contracts, bookings, users and gigawatts—but finish by counting the cash.
HR Breakout Confirmed — From Sector Strength to Portfolio ExecutThe opportunity did not begin with the breakout candle.
It began with the sector.
In our previous XLRE analysis, Sniper Alpha identified improving structure in the Real Estate sector while the ETF was still consolidating near resistance. Rather than chasing the sector itself, the next step was to scan inside that sector for individual stocks displaying stronger relative strength and cleaner price structures.
Healthcare Realty Trust Incorporated (HR) emerged as one of those candidates.
The stock continued building above the $19.70 support and invalidation area, while repeatedly testing resistance near $21.00. That behavior showed underlying demand: pullbacks remained controlled, support was defended, and price kept returning toward the upper boundary.
Now HR has closed above the resistance zone, providing the breakout validation we were waiting for.
Sniper Alpha framework
1. Detect sector momentum
2. Search for relative strength
3. Wait for structure to confirm
4. Execute without chasing
HR has now entered the Sniper Alpha portfolio following the confirmed move above the $21.00–$21.01 breakout area.
The key lesson is simple:
Sector analysis tells us where to look.
Relative strength tells us what to watch.
Price structure tells us when to act.
The position remains valid while the broader structure holds. The $19.70 area currently represents the main structural invalidation level, while risk management will continue to follow the development of future swing lows.
This publication is for educational and research purposes only. It is not financial advice. Always conduct your own research and manage risk according to your own trading plan.
BlackRock's Earnings Just Changed the Investment NarrativeBlackRock delivered another outstanding quarter, proving once again why it remains the global leader in asset management
Assets under management reached a record $15.3 trillion, fueled by $192 billion in quarterly net inflows and strong demand across iShares ETFs, active strategies, private markets, and institutional mandates.. Revenue climbed 31% year over year to $7.08 billion, while adjusted EPS of $13.91 comfortably exceeded Wall Street expectations, highlighting the firm's ability to grow even at an unprecedented scale
💰 Higher Margins, Better Business Mix
The biggest takeaway wasn't just higher earnings it was improving profitability. BlackRock expanded its adjusted operating margin to 45.9%, driven by strong operating leverage, growing technology revenue, and increasing exposure to higher fee businesses like private credit, infrastructure, and Aladdin. As the firm's business mix shifts away from purely passive investing, investors should expect more resilient earnings and stronger long term margin expansion
🚀 Private Markets Become the Next Growth Engine
BlackRock is transforming beyond a traditional ETF giant. Recent acquisitions, including Global Infrastructure Partners, HPS Investment Partners, and Preqin, are accelerating its expansion into private markets, infrastructure financing, and alternative investments. These businesses not only generate higher fees but also position BlackRock to benefit from one of the fastest growing segments of global finance as institutional investors continue shifting capital into private assets.
🤖 Larry Fink Is Betting Big on AI
CEO Larry Fink remains highly optimistic, saying he is very bullish on the markets over the next 12 months . His confidence comes from the belief that artificial intelligence will drive a multi year productivity boom across nearly every industry.. Rather than worrying about an AI bubble, Fink believes the real challenge is building enough computing power, data centers, and electricity infrastructure to satisfy exploding demand
BlackRock is positioning itself to finance that transformation, while internally using AI to boost efficiency and expand margins without significantly increasing headcount
BlackRock continues to execute at an elite level. Record inflows, expanding margins, disciplined capital allocation, and growing exposure to private markets create multiple long term growth drivers beyond traditional asset management.
While market volatility and equity valuations remain key risks, the company's diversified platform, technology leadership, and exposure to the AI infrastructure boom leave BlackRock well positioned to continue compounding earnings and shareholder value for years to come.
FSLR is trading near $185, sitting 0.9x weekly ATRFSLR is trading near $185, sitting 0.9x weekly ATR from its 200-week EMA. That distance places it inside the defined buy zone (≤1x ATR from the 200W EMA), well short of extended (≤4x). The 200-week EMA is up 31% over the last two years and still rising, with the 50-week EMA above it.
Gate 1, trend A rising 200W EMA with price pulled back to touch it, not through it, and the 50W holding above the 200W, is the structural definition of an intact long-term uptrend resting at support rather than breaking down. That's the first gate, and it's confirmed here.
Gate 2, momentum Confirm momentum is turning up from this level rather than still falling before treating this as a live entry. On a name this volatile a pullback to trend support is not the same as a base already forming. Wait for the weekly candle to show the reset resolving before sizing in.
Gate 3, risk Entry zone: near $185. Scale-out targets, scaled to this asset's own ATR: TP1 → $327 (+76%) TP2 → $468 (+152%) TP3 → $694 (+274%)
Volatility context: 14-day ATR is $11.44, average daily range $10.67, an expected day of roughly ±$11.44, around 6% of price. This is a genuine mover, which is both the source of the wide upside targets and the reason position size matters more here than on a slow name. A 1.5x ATR stop from entry is roughly $17.16 of room. No trailing stop until price reclaims and holds above the 50-week EMA, tightening risk before the trend has actually resumed just invites noise-driven stop-outs on a stock that swings this hard.
The seasonality overlay Kept in perspective, because this is a mild tailwind rather than the headline. Averaged over the last five years, FSLR has closed green in 7 of its 12 calendar months with a positive average monthly return of +2.65%. The strongest month has historically been May and the weakest June, both now behind us, so the seasonally worst stretch of the year has already passed. The structure is the reason this is on the chart. The calendar simply isn't working against it.
Build in stages rather than one entry. No leverage, and size it for the volatility. Assess Gate 1 first, then Gate 2, then size Gate 3 off current ATR, not a static stop distance.
Not financial advice. All commentary is for analytical purposes only.