AAPL | The Trap - Why Apple’s AI Halo Is Fading | SHORTIf you think the $4.37 trillion "iStock" is invincible, you might want to check the expiration date on this rally.
While everyone is busy hyperventilating over "Apple Intelligence," Siri upgrades, and WWDC software reveals, the chart is quietly downgrading its future. Here’s why we’re looking at a potential 65% liquidation event at the Apple Store.
1. The Bearish Divergence (The Momentum Whisperer)
Price is making "Higher Highs" up near $315 that look great on a billboard, but the RSI (sitting uncomfortably in the 70s) and MACD are making "Lower Highs" on the longer timeframes. This isn't just a hiccup; it’s a massive Bearish Divergence. The stock is climbing the mountain, but it's running completely out of oxygen. When the momentum gives out, gravity takes over—and it’s a devastatingly long way down to the next structural "Anchor Point."
2. The Wyckoff Distribution: The "Smart Money" Exit
We are tracing a textbook Wyckoff Distribution right now. We’ve seen the Buying Climax fueled by the new $100 billion share buyback announcement, the Automatic Reaction, and now we’re floating in that dangerous "Upthrust" zone. The smart money has already packed their bags and locked in profits from the early 2026 run; they’re currently busy handing the bags over to retail traders who think Apple cautiously sitting out the AI spending arms race is just a "genius, cost-saving dip."
3. Price Action & Volume (The Hollow Climb)
Take a look at the volume during this push toward all-time highs—it’s declining while the price edges higher. That’s a "hollow" move. In technical terms: there’s no conviction behind this rally. We’re staring at a massive liquidity void below. The 200-day moving average sits around $260, but once that floor snaps, the trap door opens. There is absolutely no structural support until we hit the multi-year consolidation zones, pointing toward a brutal 65% retracement down to the $110–$120 level.
4. The Denial Phase: "It’s Different This Time"
We are currently entering the Denial Phase of the market cycle. You'll hear it in the comments: "Apple Intelligence will trigger an iPhone supercycle," "China tariff risks are overblown," or "Services revenue just hit $31 billion—they're unstoppable!" This psychological buffer is the only thing keeping AAPL's premium 36x P/E multiple afloat. But remember: the bigger the denial, the harder the eventual capitulation when the "longs" finally realize the hardware replacement cycle is permanently broken and the V-shaped recovery isn't coming.
5. Short Interest: The Fuel for the Fall
While people don't usually "squeeze" a $4 trillion behemoth, the remarkably low short interest actually works against Apple here. There are practically no shorts left to "cover" and provide a parachute during a flash crash. When the geopolitical fears return or earnings stumble, it’s a one-way street with no forced buyers in sight. When the panic starts, the race to the exits will turn a standard correction into a historic haircut.
NVIDIA (NVDA): news flow leaning bullish — the net read
The wire has been busy on NVIDIA (NVDA). Weighing the stories from the last 24h against each other — new against old, and tracking which ones have already faded:
+++ Nvidia, Micron, Broadcom, Applied Materials Set to Generate $430 Billion in Free Cash Flow as Tech Giants Bleed Cash - Benzinga
+++ Morgan Stanley Warns of "Chipflation" as Hyperscalers Invest More in Compute Capacity: 2 No-Brainer Artificial Intelligence (AI) Chip Stocks to Buy Right Now - Yahoo Finance
−−− Taiwan Just Waved a Red Flag for Nvidia Stock
+++ NVIDIA (NVDA) Stock Price Forecast July 2026: UAE Export Easing Drove +4% — Is $212 a Double Top?
−−− Trump Takes $9 Billion Stake in Intel, Pressures Apple and Nvidia to Place Orders in Bid to Challenge TSMC
Net read: +++ leaning bullish — top of our scale.
What this is: a measure of which way the *news* is leaning right now — not a promise about price. Strong reads fade as the market digests them, and a fresh headline can flip the whole picture. That's exactly what we track.
The rule of this account: every read gets a public update once the market has had time to speak — the ones that landed and the ones that didn't. No deleted calls. Watch for the update on this idea.
(Informational only — not financial advice, not a signal.)
BioNTech (BNTX) LONG — 4H ALMA Setup (WR 80%)█ SETUP
NASDAQ:BNTX · 4H · long only.
(Context: BioNTech — mRNA platform; oncology pivot post-COVID; Pfizer Comirnaty partner.)
ALMA Averaging Strategy: ALMA 3 / σ2, SD band 2, min diff 6/1, 25% per bar, up to 4 adds, hard stop −10% from average entry.
Strategy Tester (BNTX 4H):
Win rate 80% · profit factor 2.3 · max drawdown 17%
Avg winning trade +10.6% · avg losing trade −8.8%
Typical hold ~18×4H bars on winners — biotech mean-reversion sleeve on the US cash grid
█ WHY NOW
Monday US cash open — fresh 4H ALMA long on 13 Jul 13:30 UTC ~ $91.42 .
First lot on the template at the VWAP support cluster (~$91.02–91.36) after a July grind in the low-$90s — bar-close on the 4H sleeve, not an oncology-headline or patent-win chase.
Hard stop zone −10% from fill ~ $82.28 . Exits follow Pine ALMA flip + min diff or the hard stop.
═
█ MACRO
Sector: BNTX = mRNA / immuno-oncology pivot — COVID revenue fade, pipeline catalysts (pumitamig, BNT324 prostate ADC Phase 3), ~€16.8B cash (Q1).
Tape (Jun–13 Jul): Mixed window — UPC patent win vs Promosome (02–08 Jul, Comirnaty cleared in Europe) and Lancet mRNA efficacy meta-analysis vs German manufacturing divestiture talks (~1,860 jobs, Handelsblatt/Reuters 03 Jul). $1B ADS buyback active (~$99M repurchased mid-June, avg ~$88.6). Morgan Stanley Buy maintained, PT $126→$119 (08 Jul); Morningstar 2-star «overvalued» after ~+11% over 30 days on one tape slice. Next: Q2 earnings ~04 Aug 2026 ; H2 oncology readouts on the calendar.
Execution is 4H ALMA at ~$91.42 in the support band — not a post-rally chase into MS’s trimmed PT zone (~$115–119).
█ OUTLOOK
Positive factors
- 80% WR · PF 2.3 · avg win +10.6% vs avg loss −8.8% on 109×4H trades — workable skew for a volatile biotech name
- Fresh 4H entry inside the 24h publish window — first lot at US cash, not a scale-in add
- ALMA — execution TF aligned: 4H LONG · L:1 vs avg L:3.8 — template direction matches the bar
- VWAP — support at fill: active support ~$91.02 / ~$91.36 · chart touch Support — entry sits on the lower VWAP band, not mid-range
- SMC — demand at fill: 4H bull FVG raid ~$91.42 (10 Jul) · 1D bull FVG enter ~$91.49 + OB enter normal bull — same-session demand tags
- EMA — below-session stretch (fuel): 1H Cur S:14 vs Avg S:4.2 · +0.8% dev — entry ladder stretched below on the faster TF
- Macro tailwinds in-window: UPC win + buyback execution vs restructuring noise — mixed tape suits a mean-reversion sleeve, not a breakout call
Negative factors
- ALMA — slow-TF headwind: 1D SHORT · S:5 vs avg S:4.2 · OVERHEAT-S — daily band still short-biased; adds risky if price extends without reset
- EMA — bear stack: 4H / 1D / 3D / 1W all Below — no full MTF reclaim; 4H only S:3 (+0.6% dev), not a deep crash discount
- VWAP — overhead: resistance ~$94.45 / ~$94.17 (Jul) — first mean-reversion ceiling a few percent above fill
- Restructuring headline risk: German site sales, job cuts, JPT Peptide exit — gap risk on US opens
- Analyst caution: MS PT cut · Morningstar overvalued — sentiment not uniformly bullish despite patent win
- Earnings ~04 Aug — binary biotech window ahead; 4H sleeve can whipsaw into the print
- Single first lot — no averaged discount yet if the bar extends lower before adds qualify
- Promosome may appeal UPC ruling — residual legal overhang
Takeaway: the 80% 4H template, VWAP support cluster, bull FVG/OB tags at ~$91, and 1H below-EMA stretch support a disciplined mean-reversion long at the cash open — but 1D ALMA OVERHEAT-SHORT and the full EMA bear stack cap conviction; macro is patent/buyback positive vs restructuring/analyst downgrade negative — biotech grind in the low-$90s, not a clean oncology breakout; nominal risk stays on −10% / Pine exit.
Base case: 4H ALMA holds ~$89–94 · VWAP support absorbs dips · slow work toward ~$94–95 resistance if bull FVG shelf holds.
Bear case: lose 4H ALMA · restructuring headline accelerates · pre-earnings de-risking · flush toward hard stop ~$82.28 from ~$91.42 entry.
Chart: BATS:BNTX 4H — ALMA Averaging Strategy.
Educational idea. Live position — past backtest ≠ future results. NFA.
NVDA – AI Momentum Leader In Expansion Mode | CSE Capital OptionNVIDIA remains one of the most important momentum and AI-leadership cases inside my CSE Capital — Option Decision OS, also known as the Continuation Swing Engine.
NVDA is not a normal stock in my model. It represents a very specific category: high-quality, high-momentum, high-attention and high-option-risk. That combination can create exceptional opportunities, but it can also create emotional decision-making if there is no system behind the trade. This is exactly why I analyse NVDA through the CSE framework instead of treating it as a simple “AI stock to buy.”
In earlier models, the main focus was patience and structure. NVIDIA has already shown several powerful continuation phases, but the strongest stocks can also become the most dangerous when traders start chasing every breakout without checking risk. My view is that NVDA should be respected as a market leader, but never traded without a clear technical and options-based decision process.
Inside the CSE Capital Option Decision OS, I look at NVDA through multiple layers: Fibonacci structure, trend continuation, momentum quality, reclaim zones, breakout behaviour and option feasibility. The question is not only whether NVIDIA is strong. The real question is whether the stock is offering a clean enough continuation setup and whether the option contract is still realistic from a portfolio-risk perspective.
From a technical perspective, NVDA remains a classic expansion candidate when it holds important support zones and continues to push through higher resistance areas. When a stock like this starts moving into new high territory, overhead resistance becomes less relevant and momentum can attract even more trend-following capital. But that also means discipline becomes more important, not less.
This is where the CSE model adds value. The system helps separate a strong underlying trend from an actionable option trade. A chart can look excellent while the option contract is still too expensive, too wide, too short-dated or too concentrated relative to the portfolio. Especially with a stock like NVDA, the High-Priced US Option Regime must always be respected.
For an options strategy, I do not want to chase NVIDIA simply because it is moving higher. I want structure first: support, reclaim, trend quality and continuation. Then I want confirmation: momentum, volume behaviour and the ability to hold above key levels. Only after that does the option feasibility layer become relevant.
That means checking premium size, bid/ask spread, liquidity, delta, expiry, time value, implied volatility, portfolio exposure and risk/reward before any position can become actionable. If the option is too expensive relative to the account, the correct decision can still be to wait, reduce exposure, use a spread structure or skip the trade completely.
The current NVDA case is therefore not about hype. It is about respecting one of the strongest AI momentum leaders in the market while staying disciplined enough not to confuse a strong stock with an automatic option entry.
My view: NVDA remains a core momentum leader inside the CSE Capital Option Decision OS. The bullish continuation structure stays interesting as long as the stock holds key technical zones and momentum remains constructive. But every potential option trade must still pass the full CSE feasibility and risk process.
Structure first.
Confirmation second.
Option feasibility third.
No chase, no emotion, only process.
AMZN – Silver Zone Reclaim Into Continuation Setup | CSE CapitalAmazon is currently one of the most important focus cases inside my CSE Capital — Option Decision OS, also known as the Continuation Swing Engine.
In earlier AMZN models, I treated the stock as a high-quality continuation candidate, but not as a random buy. The key idea was to wait for the right technical location: a reclaim, a support hold, or a controlled entry zone where the risk/reward for an option strategy would become more attractive. Within my model, the Silver entry zone became the most important area to monitor.
That Silver zone is now the focus.
For me, this changes the decision structure. Amazon is no longer just a broad watchlist name. It is now a daily focus case because the stock is moving around a predefined CSE entry region where continuation can develop if buyers remain in control. The setup is especially relevant because I already have exposure through the AMZN Jun 2027 235 Call, which means the goal is not to chase or randomly add risk, but to evaluate whether the original thesis is still strengthening.
This is exactly why I built the CSE Capital Option Decision OS. The software is not designed to create blind buy signals. It is designed to bring structure into the full decision process: where is the stock relative to its Fibonacci zones, where is the trend improving, where has price reclaimed an important area, and whether the option contract itself is actually feasible.
Amazon is interesting because it sits in a very important category inside my option universe. It has the quality, scale and growth profile of a major US technology leader, but the option structure can sometimes be more workable than some of the extremely high-priced megacap names. That makes AMZN a potential portfolio growth engine when the technical structure and option feasibility align.
From a technical perspective, the current focus is the Silver zone. If AMZN continues to hold this region, rebuilds momentum and starts moving toward the next higher resistance or expansion area, the bullish continuation scenario improves. The reclaim or support hold around this zone becomes a reference point for the thesis. If price fails the zone, the model prevents me from forcing a trade just because the company is strong.
For an options strategy, this remains very important: an entry zone is not a buy signal. A Silver zone, a reclaim or a strong-looking chart only tells me that the stock deserves focus. Every option idea still needs to pass the Option Feasibility + Risk Gate inside the CSE model.
That means checking premium size, bid/ask spread, liquidity, delta, expiry, time value, portfolio exposure and risk/reward before taking any action. With AMZN, this is especially important because I already have a long-dated position. The question is not only whether the chart looks attractive, but whether additional exposure would improve the portfolio or simply increase concentration risk.
The current AMZN case is therefore about process, not hype. First the model identified Amazon as a high-quality continuation candidate. Then it marked the relevant Silver entry region. Now the stock is being monitored as a daily focus case because the technical location is becoming important again.
My view: AMZN remains one of the cleaner large-cap continuation candidates inside the CSE Capital Option Decision OS. The bullish structure improves as long as the Silver zone holds and momentum continues to build. If the stock confirms strength from this area, the existing Jun 2027 235C thesis remains supported.
Structure first.
Confirmation second.
Option feasibility third.
No chase, no emotion, only process.
AAPL – 291 Reclaim Into All-Time-High Breakout | CSE Capital Apple is now becoming one of the most important focus cases inside my CSE Capital — Option Decision OS, also known as the Continuation Swing Engine.
In earlier Apple models, I did not want to chase the stock directly under resistance. The key idea was to wait for a cleaner technical location: a retracement, a reclaim, or a confirmed support zone where the risk/reward for an option strategy would become more attractive. One of the most important levels in that process was the 291 area.
That level has now been reclaimed.
For me, that changes the structure. Apple is no longer just a quality stock on the watchlist. It is now moving from a “wait for retracement / wait for confirmation” case into a continuation swing case. The reclaim of 291 shows that buyers have stepped back in at an important technical zone, and the move toward / through the all-time-high area confirms that the market is again willing to price Apple higher.
This is exactly the type of situation my CSE Capital Option Decision OS was built to analyse. The software is not designed to create random buy signals. It is designed to bring structure into the decision process: where is the stock relative to its Fibonacci zones, where is the trend improving, where is the reclaim confirmed, and whether the option strategy is actually feasible from a risk perspective.
In the earlier Apple case, the system treated the stock with patience. The thesis was clear: Apple remained a high-quality name, but a strong company is not automatically a good option entry. The model preferred to wait for the right zone instead of chasing price under resistance. Now that 291 has been reclaimed and Apple is breaking into all-time-high territory, the setup becomes much more interesting.
From a technical perspective, this is a transition from recovery into expansion. A reclaim of 291 can now act as an important reference level. If Apple continues to hold above this area, the structure supports a bullish continuation scenario. The all-time-high breakout is important because it removes overhead resistance and can attract new momentum, trend-following capital and institutional attention.
For an options strategy, this does not mean “buy blindly.” That is a very important part of my process. An entry zone, a reclaim or even an all-time-high breakout is not automatically a buy signal. Every option idea still needs to pass the Option Feasibility + Risk Gate inside the CSE model.
That means I still need to check the premium size, bid/ask spread, liquidity, delta, expiry, time value, portfolio exposure and risk/reward before any position can become actionable. Especially with US megacap options, the chart can look strong while the option contract itself may still be too expensive or inefficient.
The current Apple case is therefore not about hype. It is about process. First the model identified Apple as a stock to watch. Then it waited for the right technical area. Now 291 has been reclaimed and the stock is breaking into all-time-high territory. That is the moment where Apple becomes a serious continuation candidate inside the CSE Capital Option Decision OS.
My view: Apple is now upgraded from a passive watchlist name to an active focus case. The bullish structure improves as long as 291 remains reclaimed and the breakout does not fail. If the stock holds above this zone and momentum continues to build, Apple can become one of the cleaner large-cap continuation setups in my option universe.
Structure first.
Confirmation second.
Option feasibility third.
No chase, no emotion, only process.
TELSATesla (TSLA) – Bullish Outlook
Tesla staged a strong rally but encountered resistance at recent highs, failing to break through and subsequently pulling back. That unmitigated high has now transformed into a significant liquidity pool, drawing price action back toward it.
While early sellers have emerged, a clear Liquidity Block (LB) sits in the vicinity — a high-probability zone where aggressive bullish momentum can create a stall or reversal. This setup suggests the market may consolidate or defend this level if buyer conviction remains strong.
Adding to the intrigue, price is currently hunting bottom-side liquidity, a move likely to trigger stop-losses and induce further selling. This liquidity sweep could serve as the final shakeout, offering stronger confirmation that the Liquidity Block holds and sets the stage for a potential bullish continuation.
The market will ultimately decide the outcome.
Stay sharp, manage risk, and trade well.
AXON Long — AXON's failed breakdown just flipped into strength, AXON is one of the stronger long setups: it is barely extended, the failed breakdown reclaimed strength, and the reward/risk is excellent into the next upside objective. Fresh analyst target raises and contract-driven momentum support the move, while the political controversy is a risk to monitor but not enough to negate the bullish catalyst stack.
📍 Entry: 563.84
🛑 Stop: 537.04
🎯 Target: 665.07
⚖️ R:R: 3.78
RBRK: One Breakout Away From Price Discovery?RBRK appears to be setting up for another attempt at its All-Time High near 103 after spending months building a strong bullish base.
Following its rejection from 103, the stock entered a prolonged correction and consolidation phase. That correction has now evolved into a large Inverse Head & Shoulders pattern—one of the most recognized bullish reversal formations.
Adding to the bullish case, price has recently:
✅ Broken Market Structure (BOS)
✅ Broken above the descending trendline resistance zone
Together, these signals suggest buyers are regaining control as RBRK approaches one of the most important resistance levels on the chart.
🚀 Bullish Factors
🟢 Inverse Head & Shoulders
Signals a potential transition from a prolonged correction into a new bullish trend.
🚀 Trendline Breakout
Price has broken above the descending resistance zone that capped previous rallies.
📈 Break of Structure (BOS)
Confirms improving market structure and strengthens the bullish outlook.
🎯 Bullish Scenario
➡️ The immediate objective is a successful breakout above the All-Time High at 103.
🎯 Resistance: 103 (All-Time High)
🎯 Measured Target: 130–131 (Inverse Head & Shoulders projection)
A confirmed breakout above 103 would place RBRK into price discovery, where historical resistance no longer exists.
❌ Bullish Invalidation
🔴 The bullish thesis remains valid as long as RBRK holds above 80 on a daily closing basis.
A decisive daily close below 80 would weaken the current setup and increase the probability of a deeper pullback before another breakout attempt.
👀 The 103 ATH is the level to watch. A clean breakout could open the door for a move toward the 130 area.
Will RBRK finally break into price discovery, or will the All-Time High reject buyers once again? Let's watch it together.
AVPT: Double Breakout Signals the End of the Correction?After repeatedly topping out around 19–20 in August 2025, AVPT entered a prolonged correction, falling more than 55% to below 9 while trading inside a well-defined bearish channel.
That correction now appears to be ending.
Several bullish developments have aligned at the same time:
🟢 Bullish Factors
✅ Bearish Channel Breakout
Price has broken out of the long-term descending channel, signaling a potential trend reversal.
✅ Rounding Bottom Neckline Breakout
The breakout above the rounding bottom neckline confirms improving buyer strength and a shift in momentum.
📈 EMA200 Reclaimed
Price has reclaimed the 200 EMA, a key dynamic level that often separates bullish and bearish market conditions.
🎯 Bullish Scenario
As long as AVPT remains above its recent breakout levels, I believe the correction phase is over and a new bullish leg may be underway.
💰 Buying Zone: Around 11-12 on any healthy pullback.
🎯 Target 1: 14
🎯 Target 2: 16
🚀 Extended Target: A retest of the all-time highs near 20 if bullish momentum continues.
❌ Bullish Invalidation
🔴 A decisive daily close below 10.5 would invalidate this bullish thesis and suggest the breakout has failed.
👀 I'll be watching for a healthy retest of the breakout zone. If buyers successfully defend it, the probability of a sustained rally increases significantly.
AMAZON Pullback Expected! Sell!
Hello,Traders!
AMAZON is reacting beneath a horizontal supply area after failing to reclaim it. SMC suggests the zone may flip,favoring a bearish continuation toward the marked target. Time Frame 9H.
Sell!
Comment and subscribe to help us grow!
Check out other forecasts below too!
TARS: History Repeating? Falling Wedge + Golden Pocket +AB=CD ?TARS has a history of rewarding patient buyers.
Over the past two years, the stock has repeatedly formed falling wedges, only to break out and produce strong impulsive rallies. The current setup looks remarkably similar to the previous two.
After peaking near 85, TARS entered another healthy correction, once again carving out a falling wedge. Price has now broken above the wedge and is retesting the breakout, a common characteristic of strong continuation moves.
But that's only part of the story.
The current pullback also completed landed perfectly into the Fibonacci Golden Pocket (0.5–0.618)—and took decisive support that resulted in the wedge breakout.
This creates a high-probability setup, that the corrective phase may be coming to an end.
🟢 Bullish Factors
📈 Third Falling Wedge Breakout
Previous falling wedges resulted in strong bullish expansions.
The current setup closely resembles those historical patterns.
🎯 Golden Pocket Support
Price respected the 0.5–0.618 Fibonacci retracement zone
🔄 Healthy Breakout Retest
📊 Volume Confirmation
Buying volume expanded into the breakout, while the retest is occurring on relatively lighter volume—a constructive sign.
🎯 Bullish Scenario
➡️ If buyers continue defending the current support zone, I expect TARS to resume its primary uptrend.
🎯 Target 1 zone: 74 -78
🎯 Target 2: Retest of the recent high near 85
🚀 Target 3: 🌟 Breakout Above 85: A decisive breakout above 85 would lead to AB=CD target of 102.
⚠️ What I'm Watching
👀 Before turning aggressively bullish, I'd like to see:
✅ Successful defense of the breakout retest
✅ Strong bullish candles from current levels
✅ Increasing buying volume
Those would confirm that buyers have regained control.
❌ Bullish Invalidation
🔴 The bullish thesis remains valid as long as TARS holds above 64 on a daily closing basis.
A decisive daily close below 64 would invalidate the breakout and increase the probability of a deeper correction.
💡 What I like most about this setup isn't just the breakout—it's the confluence. Multiple historical wedge breakouts, and a Golden Pocket retracement all align at the same area. When several independent technical signals point to the same zone, they often deserve extra attention.
Let's see if history repeats itself once again.
**AAPL Bullish Continuation Toward $331 Resistance**
Apple (AAPL) is maintaining a strong bullish market structure after breaking out of its consolidation range and reclaiming the Ichimoku Cloud. Price is respecting the ascending trendline, indicating that buyers remain in control. As long as AAPL holds above the recent breakout area around **$316**, the momentum favors a continuation toward the next major resistance.
**🎯 Target:** **$331.12*
A sustained move above the recent swing high could accelerate the rally toward the **$331.12** target. However, a break below the ascending trendline and cloud support would weaken the bullish outlook and may trigger a deeper pullback.
SNDK: From Buy the Dip to Losing Grip? Trend is Changing?!!! "buy the dip" to "sell the rally.
Since the beginning of the second bullish leg in March, SNDK had respected a rising trendline remarkably well. Every pullback found buyers at trendline support, while the Daily EMA20 acted as dynamic support throughout the advance.
That bullish structure has now changed.
The stock has broken below the rising trendline, completed a textbook retest, and failed to reclaim it. At the same time, price has closed below the Daily EMA20, turning both the trendline and the EMA into overhead resistance.
Adding to the bearish case, clear bearish divergence is visible, suggesting bullish momentum has been fading despite previous attempts to push higher.
🐻 Bearish Factors
📉 Trendline Breakdown
📊 EMA20 Lost
⚠️ Bearish Divergence
Momentum weakened while price was making higher highs, increasing the probability of a larger correction.
🔄 Market Structure Weakening
The combination of a trendline break, EMA20 loss, and bearish divergence suggests buyers are losing control.
🎯 Bearish Scenario
➡️ As long as SNDK remains below the broken trendline and EMA20, I expect rallies to be sold into rather than bought.
🚧 Immediate Resistance: 1850
🚧 Major Resistance: 2000
🚧 Bullish Reversal Zone: 2350
🎯 Primary Downside Target: 1300
📉 If bearish momentum accelerates, an even deeper correction cannot be ruled out.
⚠️ What I'm Watching
👀 To invalidate the current bearish momentum, I'd like to see:
✅ A decisive reclaim of 2000
✅ A strong daily close back above the broken trendline
✅ A sustained move above 2350, confirming buyers have regained control
Until then, I view rallies as potential relief bounces within a developing downtrend.
❌ Bearish Invalidation
🟢 A decisive daily close above 2350 would invalidate this bearish thesis and significantly improve the probability of a renewed bullish trend.
💡 For now, the technical picture has shifted from "buy the dip" to "sell the rally." Unless SNDK quickly reclaims its lost support levels, the path of least resistance appears to be lower, with 1300 as the first major downside objective.
$FRSH , Huge Risk Great RewardENTRY : CMP
TP : on the chart, yet to be finalized. keep checking, I´ll post at the end of the week
SL : If you wish
My SL is never a SELL, just an alarm to stop adding money and wait for better dca
Follow, Boost, Thank You !!
⚠️ Financial Disclaimer:
This post is not financial advice. I am not your financial advisor, your life coach, or your legally responsible adult.
Always do your own research and never trade based solely on internet comedy.
why the market is looking past Apple’s weaknessesApple has reached a new all-time high, with the stock gaining approximately 17% over the last 10 trading sessions and adding hundreds of billions of dollars to its market capitalization.
The move is not being driven by one single catalyst. It reflects a change in how investors are valuing the company’s position in a market increasingly focused on artificial intelligence, profitability, and capital efficiency.
The AI Spending Difference
One of the biggest reasons behind renewed optimism is Apple’s approach to artificial intelligence.
Unlike Microsoft, Amazon, Alphabet, and Meta, which are committing massive amounts of capital toward AI infrastructure and data centers, Apple has taken a more measured approach.
The company has historically operated with a strong focus on free cash flow generation and shareholder returns. While competitors are spending aggressively to build AI capacity, investors are beginning to ask a more important question:
How quickly will these AI investments translate into actual profits?
The market has rewarded companies that can prove AI monetization, but it has also become more selective about companies spending billions without clear returns.
Apple’s lower capital intensity gives investors confidence that the company can maintain strong cash generation while still integrating AI into its ecosystem.
Resilient Sales Changed the Narrative
Another factor supporting the rally is that Apple’s business has remained more resilient than many investors expected.
Before the recent move, expectations had already adjusted toward slower growth, particularly around iPhone demand and the broader consumer electronics market.
When expectations become very low, companies do not need perfect results to surprise investors. They only need to perform better than feared.
Apple’s ability to maintain revenue strength, protect margins, and continue generating significant cash flow has helped shift sentiment from caution back toward optimism.
Services Continue to Strengthen the Business
Apple is no longer valued only as an iPhone company.
Its services ecosystem, including areas such as the App Store, iCloud, Apple Music, and other subscription offerings, has become an increasingly important part of the business model.
Services typically carry higher margins than hardware, creating a more stable earnings profile over time.
This matters because investors often assign higher valuations to companies with predictable recurring revenue streams.
Buybacks Support Shareholder Value
Apple’s large share repurchase program remains another factor supporting the stock.
By consistently buying back its own shares, Apple reduces the number of shares outstanding, which can increase earnings per share and return capital to shareholders.
The company’s ability to generate large amounts of free cash flow allows it to continue rewarding shareholders while investing in future growth.
The Bullish Case vs The Bearish Risks
The bullish argument is becoming stronger because Apple combines several qualities investors currently value:
Strong free cash flow generation
A highly profitable ecosystem
Growing services revenue
A disciplined approach to AI spending
A powerful global brand
Significant shareholder returns
However, risks remain.
Apple still faces challenges from slowing smartphone growth, competition in China, regulatory pressure, and the need to prove that its AI strategy can create meaningful consumer value.
The market is not ignoring these risks. Instead, investors appear to believe Apple has enough financial strength and strategic flexibility to manage them.
What This Means for Traders
Apple’s rally shows how markets often price expectations, not just current results.
A company does not need to be growing the fastest to outperform. Sometimes the biggest moves happen when a high-quality company exceeds lowered expectations and investors begin re-rating its future potential.
Apple’s return to all-time highs is less about being the biggest AI spender and more about convincing investors that it can participate in the AI era without sacrificing the financial discipline that made it successful.
One Thing to Remember
Markets often reward the company that creates the best return on capital, not always the company that spends the most money.
put together by : Pako Phutietsile As @currencynerd
SELF TAUGHT MAPPONG MARKETS I have reverse-engineered the exact timing patterns of the global financial markets. Think of it like a master "connect-the-dots" book. I have figured out exactly how to draw the lines that predict the absolute highest and lowest points of the day. Once my lines are drawn, the market routinely fills them in perfectly.
BLUEPRINT MAPPING THE MARKETSI have reverse-engineered the exact timing patterns of the global financial markets. Think of it like a master "connect-the-dots" book. I have figured out exactly how to draw the lines that predict the absolute highest and lowest points of the day. Once my lines are drawn, the market routinely fills them in perfectly.
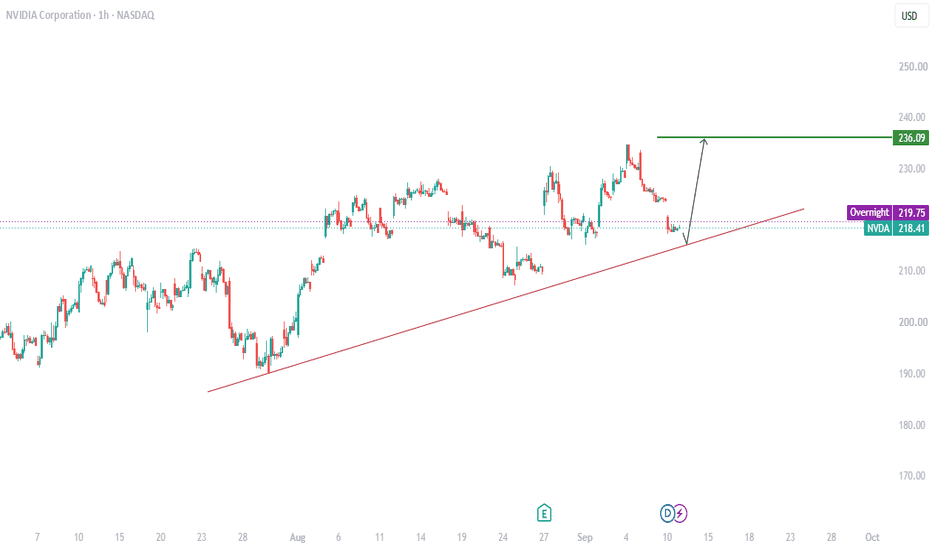
Media Misses the Mark, AGAIN: Why $NVDA ConsolidatesOverview: Recent financial media headlines express confusion over why major AI CapEx announcements from hyperscalers ( NASDAQ:META $50B+ data center commitments) aren't driving immediate upside bursts. This narrative fundamentally misunderstands how markets price expectations and structural scale.
Key Technical & Structural Takeaways:
1. Priced In Expectations:
Markets are forward discounting mechanisms. The multi-year expansion from under $20 to over $200 has already priced in aggressive AI CapEx. CapEx confirmations today merely validate existing valuations rather than serving as unexpected catalysts.
2. Liquidity & Scale Mechanics:
At a $3T+ market capitalization, incremental price appreciation requires exponentially higher capital inflow compared to lower market cap regimes. Institutional position limits and portfolio rebalancing naturally slow upside velocity.
3. RSI & Volume Divergence:
The weekly timeframe highlights a clear momentum deceleration. While price tested upper range bounds, weekly RSI has formed lower highs alongside waning volume. This indicates institutional distribution/rebalancing rather than aggressive accumulation.
4. Base Building:
Current price action reflects a high level consolidation above key weekly EMAs. Media often mislabels healthy technical digests following multi hundred percent rallies as structural weakness.
Rubrik (RBRK) — Leading the Next Generation of Cyber ResilienceRubrik, Inc. NYSE:RBRK is a leading cyber-resilience company delivering zero-trust data protection, ransomware recovery, identity security, and AI-powered threat detection through its Rubrik Security Cloud platform.
Key Catalysts:
Strong recurring revenue growth:
Subscription Annual Recurring Revenue (ARR) reached $1.57 billion, increasing 32% year over year, highlighting strong enterprise demand and continued platform adoption.
High customer retention:
Approximately 120% net revenue retention reflects successful customer expansion, cross-selling opportunities, and the mission-critical nature of Rubrik’s cybersecurity solutions.
Platform expansion:
Rubrik continues evolving beyond traditional backup by expanding into identity resilience, cloud security, automated cyber recovery, and AI-driven threat detection, creating additional long-term growth opportunities.
Improving profitability:
Ongoing operating leverage is driving margin expansion and stronger free cash flow, reinforcing the scalability of its subscription-based business model.
Cybersecurity tailwinds:
Rising ransomware attacks, stricter regulatory requirements, and growing enterprise focus on cyber resilience continue to increase demand for comprehensive data protection platforms.
Investment Outlook:
Bullish above: $74.00–$76.00
Upside target: $135.00–$140.00
Supported by strong ARR growth, expanding cybersecurity capabilities, and improving financial performance, Rubrik is well positioned to capitalize on the growing global demand for cyber resilience solutions.
📢 RBRK — Helping enterprises protect, recover, and secure their data in the age of AI and cyber threats.