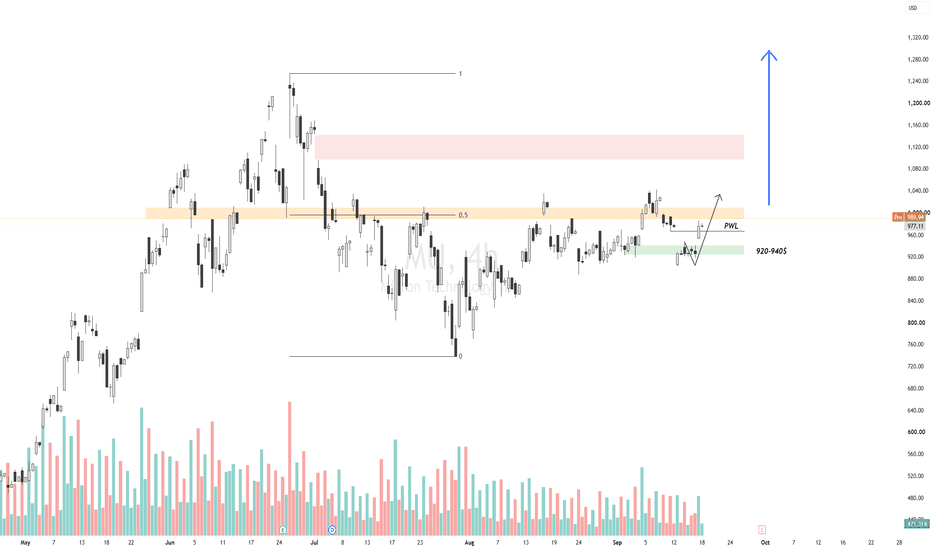
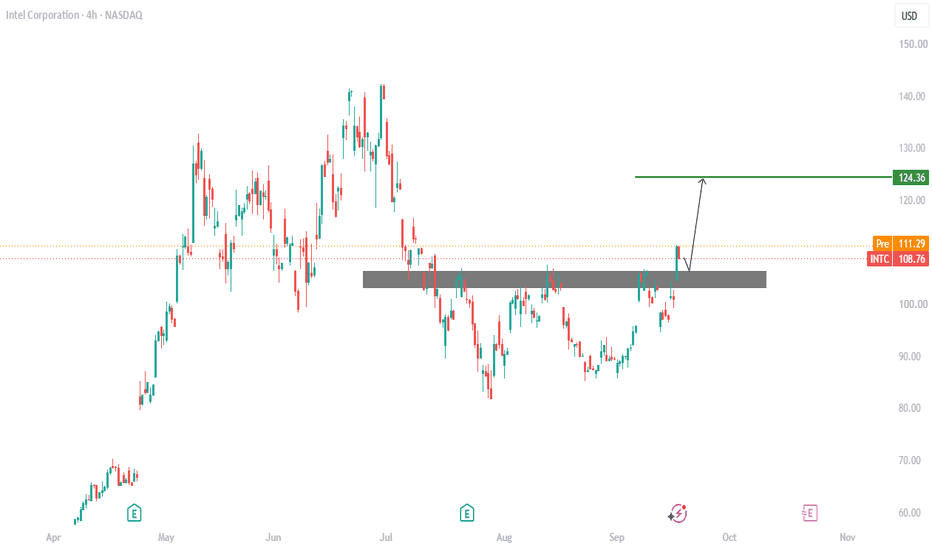
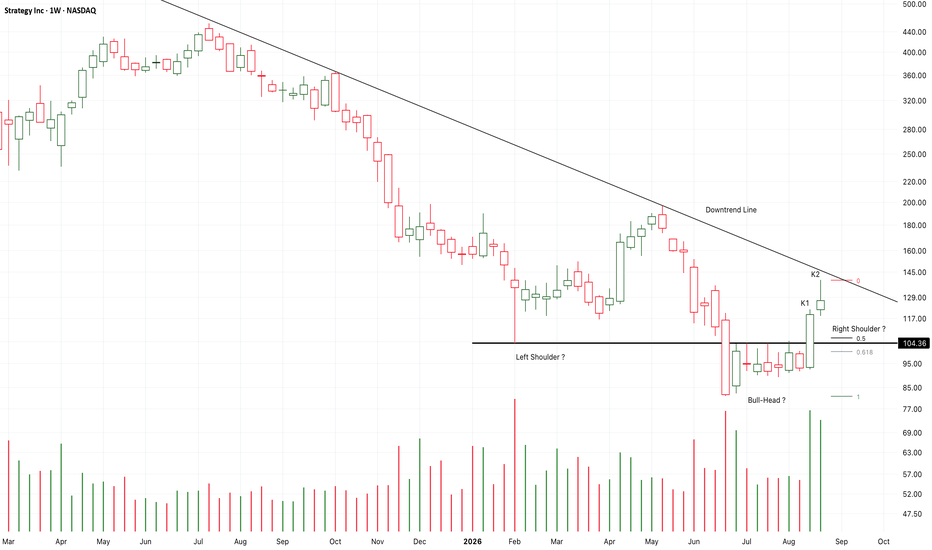
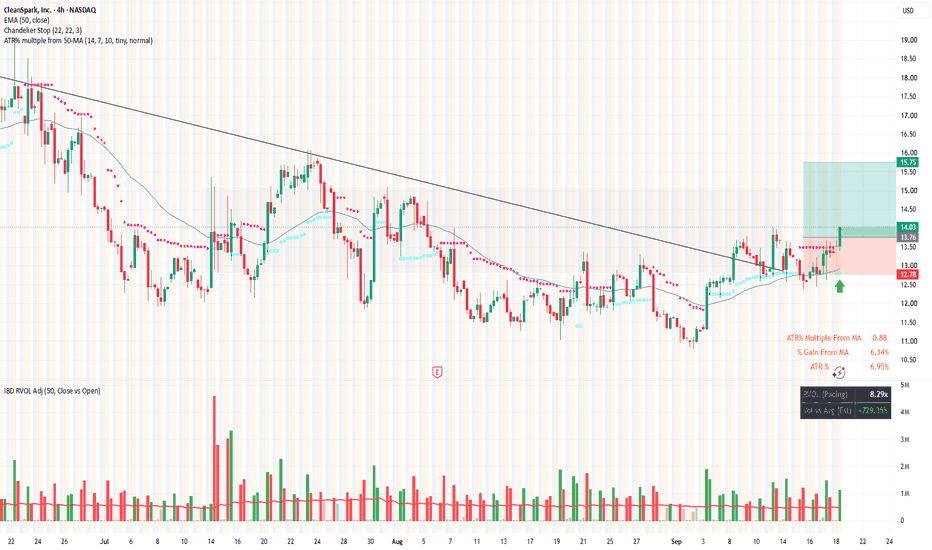
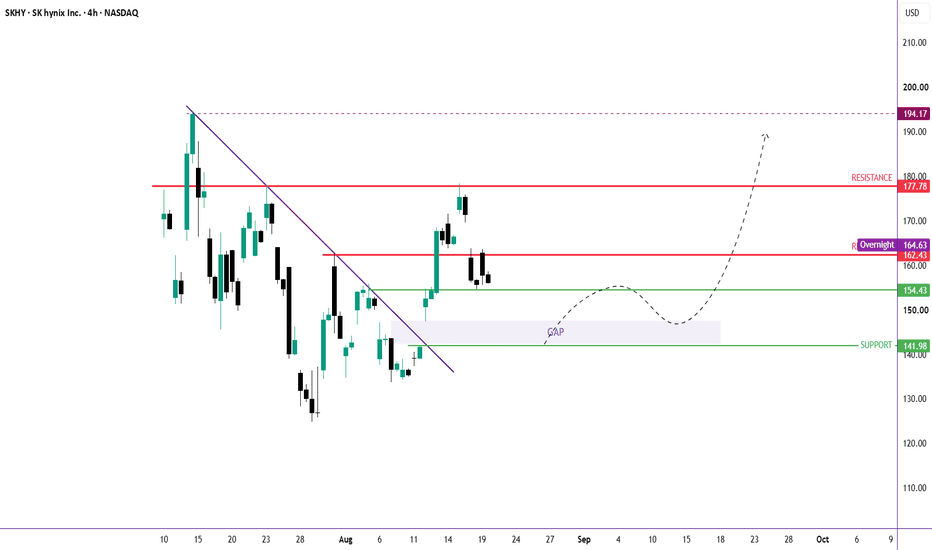
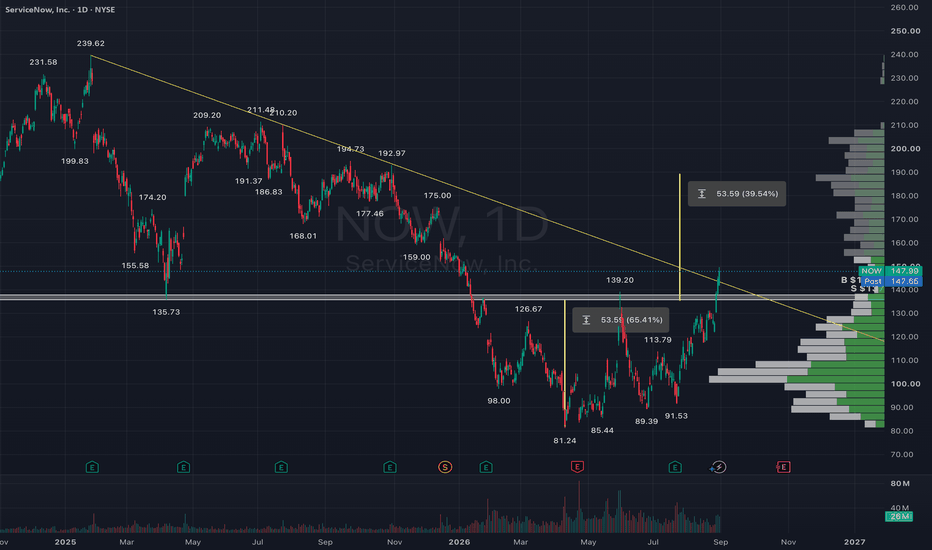
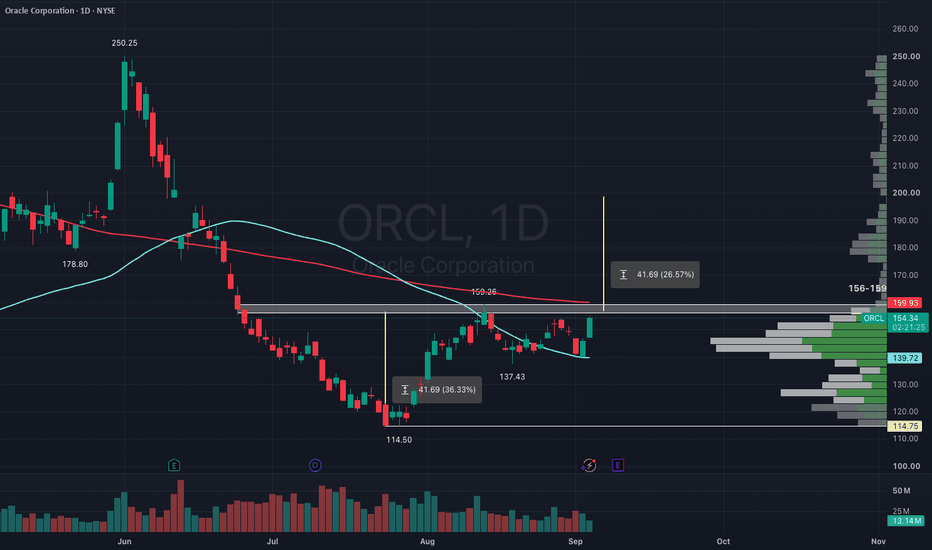
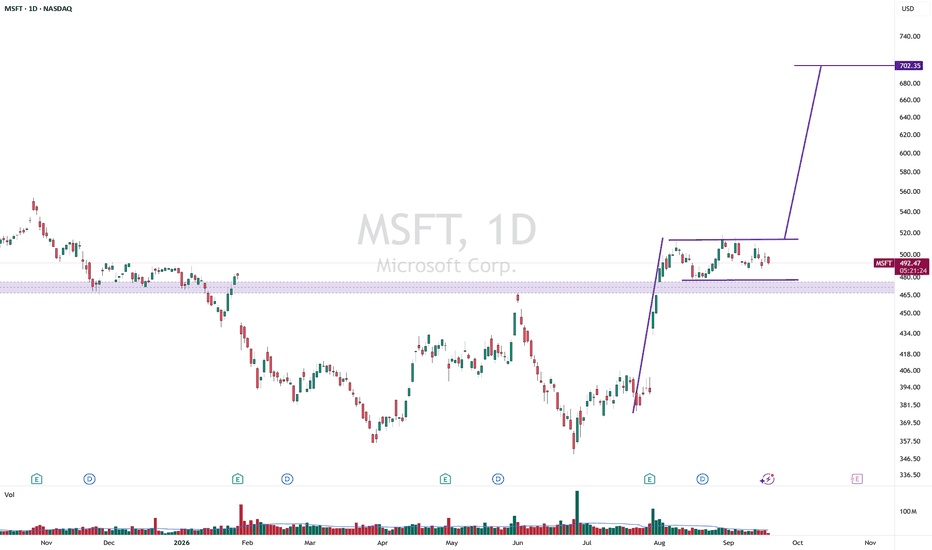
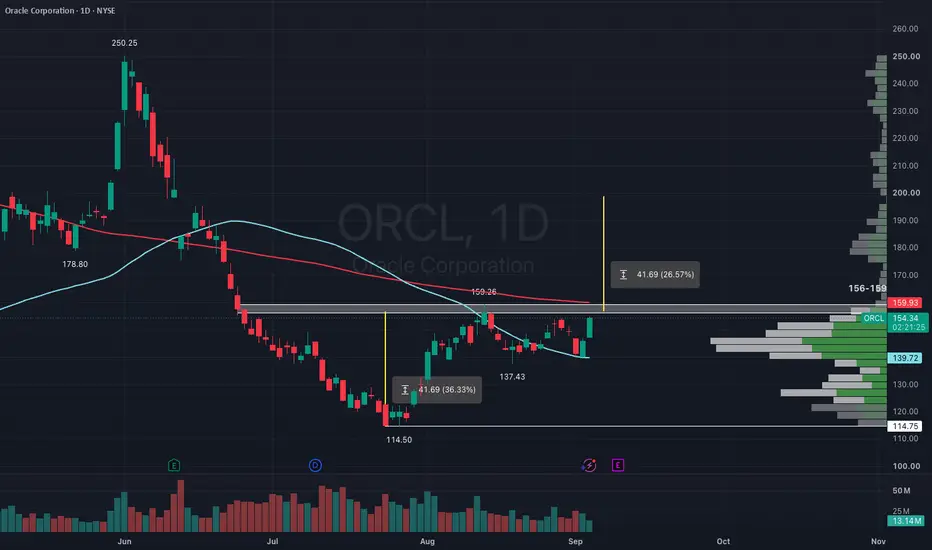
META failed trendline will it hold the 200 sma?$480-460 has been and still is my target despite their BS news of selling excess compute. Look at their balance sheet, cash flow is being absorbed on capex, they'll have to issue debt or raise money in the bond market to keep this going.. Lets wait and see what earnings announcement does.....
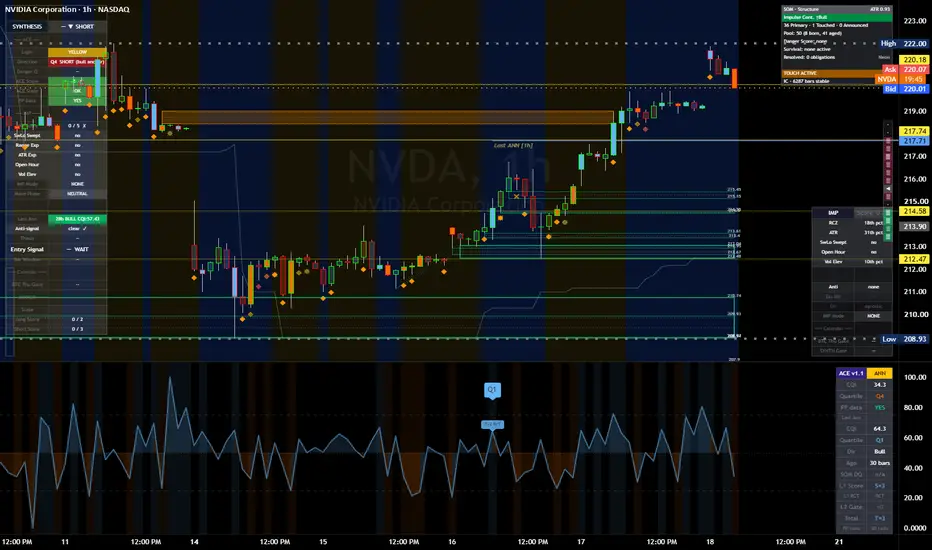
UNH Long — Analysts are racing to hike price targets after UNH'sUNH is pulling back in an aligned 4h structure only 0.14 ATR extended, offering a clean long entry toward the 461 resistance with 3.1 R. A wave of fresh analyst upgrades and PT hikes to 500+ after better-than-expected results supplies the catalyst that aligns with the bullish bias.
📍 Entry: 423.90
🛑 Stop: 411.93
🎯 Target: 461.00
⚖️ R:R: 3.10
ExxonMobil Could Be AcceleratingExxonMobil pulled back after rallying in the first quarter, and some traders may think it’s accelerating again.
The first pattern on today’s chart is the series of lower highs since late March. The energy giant has returned to that falling trendline as oil rises. Could it break out?
Second, prices bounced earlier this month at the rising 200-day simple moving average. That may reflect a bullish long-term trend.
Next, MACD is rising and the 8-day exponential moving average (EMA) has crossed above the 21-day EMA. That may suggest short-term momentum is turning bullish.
Finally, XOM is an active underlier in the options market. (Its average daily volume of 60,200 contracts ranks first among energy stocks in the S&P 500, according to TradeStation data.) That could help traders take positions with calls and puts.
TradeStation has, for decades, advanced the trading industry, providing access to stocks, options and futures. If you're born to trade, we could be for you. See our Overview for more.
Past performance, whether actual or indicated by historical tests of strategies, is no guarantee of future performance or success. There is a possibility that you may sustain a loss equal to or greater than your entire investment regardless of which asset class you trade (equities, options or futures); therefore, you should not invest or risk money that you cannot afford to lose. Online trading is not suitable for all investors. View the document titled Characteristics and Risks of Standardized Options at www.TradeStation.com . Before trading any asset class, customers must read the relevant risk disclosure statements on www.TradeStation.com . System access and trade placement and execution may be delayed or fail due to market volatility and volume, quote delays, system and software errors, Internet traffic, outages and other factors.
Securities and futures trading is offered to self-directed customers by TradeStation Securities, Inc., a broker-dealer registered with the Securities and Exchange Commission and a futures commission merchant licensed with the Commodity Futures Trading Commission). TradeStation Securities is a member of the Financial Industry Regulatory Authority, the National Futures Association, and a number of exchanges.
TradeStation Securities, Inc. and TradeStation Technologies, Inc. are each wholly owned subsidiaries of TradeStation Group, Inc., both operating, and providing products and services, under the TradeStation brand and trademark. When applying for, or purchasing, accounts, subscriptions, products and services, it is important that you know which company you will be dealing with. Visit www.TradeStation.com for further important information explaining what this means.
SPCXHow to become successful in forex and stock trading: 1.Master fundamentals and technical analysis. 2,Build and follow a solid trading plan. 3.Apply strict risk management (1–2% rule). 4.Stay disciplined—control fear and greed. 5.Record and analyze every trade. 6.Focus on high-quality setups only. 7.Diversify across assets and markets. 8.Keep evolving—study, adapt, and grow daily.
McDonald's (MCD)There’s a lot of cash flow: cash generation is funding expansion of the store base, while servicing debt, retiring common stock, and increasing the dividend.
The debt balance ought to stay at a reasonable level over the long run.
McDonald’s shares are an interesting investment for year-ahead price performance.
Good dividend return at 2.70%
LLY | Continued stock growth- Timeframe: Weekly
- Trade type: Buy stop order
- Price: 1,196.29
- Take Profit: Open
- Stop Loss: 1,134.40 (-5.20 %)
Idea: Long on a breakout above last week's high - bullish momentum continuation.
Entry: Buy stop above last week’s high.
Stop-loss: Below the low of the same candle.
If the weekly candle closes below this level, the trade is invalidated.
Take Profit: Trailing stop following the lows of new weekly candles.
Devastating setupMarket leader in the AI agent sector, which I already described in the previous idea
+++++
Analysis
The price is approaching earnings (Wednesday) with a clear W-formation.
The key breakout for the start of the bullish move is a close above $110, accompanied by increasing volume.
Good earnings could push it higher as early as Wednesday, while a negative report will bring the price back to retest the blue support level.
Devastating target in the $150 area, and maybe even $170 to fill the GAP.
I'd say let's set our alerts properly to maximize the loot.
APA | Oil Correlation Long Setup
**Technology Overview**
APA Corporation is one of the largest U.S. energy companies, focused on the exploration, production, and development of oil and natural gas. Its performance is closely tied to energy prices, making it highly sensitive to changes in the global energy market and geopolitical developments.
**Technical Analysis**
On the 1-hour chart, the price is currently in a **return-to-value** process following a period of weakness. We'll only consider a long position if the price holds the marked area, completes the return-to-value move with clear confirmation, and shows continuation. Until those conditions are met, there is no trade.
Given the current geopolitical environment, we'll place less emphasis on the broader stock market and focus more on the **oil market**. Since APA operates in the energy sector, strength in crude oil prices could significantly increase the probability of this setup succeeding. Even so, it's essential to wait for full confirmation and make sure the move isn't simply a liquidity sweep or a false breakout before entering.
The target shown on the chart is an **initial target only**. Trade management and any additional targets will depend on price action and market structure. As always, manage the trade according to your predefined risk unit and advance your stop-loss as soon as the market structure allows.
**Disclaimer:**
This analysis is for educational and informational purposes only and should not be considered financial or investment advice. Always conduct your own research and manage your risk before making any trading decisions.
**Good luck to all of us!**
**Yours, The Chief.**
SpaceX IPO: Bearish Gann Roadmap Targets 121.55SpaceX remains in price discovery following its IPO, making traditional support and resistance analysis difficult. To create structure, I mapped Gann levels from the all-time high at 225.75 and used those levels as a framework for identifying potential downside targets.
Price continues to trade below multiple key resistance levels and has failed to establish a sustained recovery. Until proven otherwise, the path of least resistance appears lower.
Key Gann Levels
All-Time High: 225.75
Resistance Levels:
210.98 (90°)
196.70 (180°)
182.93 (270°)
169.65 (360°)
Support Levels
144.60 (540°)
132.83 (630°)
121.55 (720°)
Bearish Thesis
Since the IPO peak, price has continued to produce lower highs while remaining beneath major resistance levels derived from the all-time high.
The inability to reclaim the 360° level at 169.65 suggests sellers remain in control.
As long as price remains below:
169.65
182.93
196.70
I favor continuation toward lower Gann support levels.
Downside Roadmap
First Objective
144.60
Secondary Objective
132.83
Primary Bearish Target
121.55
The 720° level represents the most significant downside target currently visible on my chart.
-
Bullish Invalidation
This idea becomes increasingly weaker if price can reclaim:
169.65
182.93
A close above 196.70 would force a complete reassessment of the bearish outlook and suggest the IPO may be establishing a stronger base than initially expected.
Because SpaceX is still a young chart, I am treating the current low as provisional rather than assuming it is the ultimate cycle low. My focus remains on how price reacts to these major Gann levels as the market continues building its long-term structure.
For now, I remain bearish while price trades beneath resistance, with 121.55 serving as the primary downside objective.
Darvas Box Breakout?The market has been in a Darvas box pattern for some time. Based on Friday's candle, it appears we are at the bottom of this range. If buyers enter the market at the start of trading, there is potential for a 20% move to the top. This would be an interesting development, especially considering the upcoming CPI and PPI reports which could lead to a positive period for the market. The reasoning behind this setup is the potential for a breakout from the current range, which could indicate a shift in market sentiment. Not financial advice.
Can SpaceX Master Space, Compute, and Global Power?SpaceX is executing one of the most audacious expansions in corporate history. The company now dominates rocket launches, global satellite connectivity, and off-earth artificial intelligence infrastructure. Wall Street analysts forecast its long-term enterprise valuation reaching trillions of dollars. Let us examine how SpaceX reshapes global dynamics across multiple key domains.
Geopolitics and Geostrategy
SpaceX now shapes modern global geopolitical strategy. Starlink satellite constellations provide secure communications in conflict zones. National governments increasingly rely on commercial space infrastructure for sovereign security. Orbital dominance grants unprecedented strategic leverage across international defense networks. Space is now the primary national security frontier.
Macroeconomics and Economics
The public market debut of SpaceX creates immense capital market shifts. Wall Street analysts forecast massive revenue growth reaching trillions over the coming decades. High-capacity launch economics significantly reduce the cost of orbiting commercial payloads. Lower launch costs stimulate rapid economic expansion across the space economy. Space infrastructure now directly drives long-term global economic growth.
Industry Trends and Business Models
SpaceX combines reusable launch hardware with satellite connectivity and data infrastructure. This vertically integrated business model captures unprecedented market share globally. Unmatched launch cost structures prevent legacy aerospace firms from competing effectively. Meanwhile, recurring Starlink subscription revenues fund aggressive capital expenditures. This flywheel model redefines high-growth tech valuation standards.
Management and Leadership
Elon Musk maintains extreme strategic alignment across his corporate ecosystem. Proactive management sets aggressive engineering timelines to accelerate operational velocity. Executive leadership embraces calculated risks to deploy next-generation technologies rapidly. Decisive decision-making turns daunting capital requirements into sustainable enterprise value. Strong leadership maintains complete authority over long-term strategic direction.
Company Culture and Innovation
A culture of rapid iterative development drives continuous breakthrough innovation. Failure during early testing phases yields critical data for hardware improvement. Teams rapidly prototype new Starship architectures and advanced orbital hardware. This intense operational pace forces traditional defense contractors to adapt or fail. Continuous innovation remains the core foundation of company growth.
Technology and High-Tech
Next-generation Starship vehicles deliver unprecedented payload capacity to orbit. Advanced satellite hardware enables high-bandwidth, direct-to-cell global communication networks. Furthermore, orbital compute clusters herald a breakthrough in AI data centers. Space-based supercomputing circumvents terrestrial land and energy constraints cleanly. High-tech engineering merges launch dynamics with cutting-edge artificial intelligence.
Cybersecurity and Patent Analysis
Operating global orbital networks requires impenetrable defense against sophisticated cyber threats. State-sponsored hackers continually attempt to disrupt critical space communication channels. Consequently, advanced cryptographic protection shields satellite telemetry and global data streams. Patent analysis reveals strategic filings covering satellite routing and propulsion tech. Defensive patenting protects key architectural inventions against global competitors.
Pharmaceuticals and Science
Microgravity environments on orbital stations enable groundbreaking scientific research. Pharmaceutical researchers utilize weightlessness to grow flawless protein crystals for drug discovery. SpaceX provides affordable, frequent orbital access for advanced biomedical research. Frequent payload delivery accelerates complex clinical trials and novel drug manufacturing. Space-based science unlocks revolutionary medical treatments for global healthcare.
Conclusion
SpaceX has transformed from a launch provider into a global infrastructure titan. Its integration of launch, connectivity, and compute reshapes global power. Industry leaders must navigate this new era of orbital economic dominance.
SpaceX falls nearly 46% from its peak assessing Starship impact SpaceX falls nearly 46% from its peak as the market assesses the impact of Starship
Ion Jauregui – ActivTrades Analyst
SpaceX (NASDAQ: SPCX) closed Friday’s session at $123.99, below its $135 IPO price for the first time since its market debut, as investors assess the impact of delays to the Starship program and the sharp correction recorded from its initial highs.
The company, which reached an all-time high of $225.61 shortly after its market debut, has accumulated a decline of more than 45%, after selling pressure significantly reduced its market valuation from the highs reached following the initial public offering.
In overnight trading, the stock is attempting to stabilize around $125.51, although it remains below the $135 level, a relevant technical and psychological reference as it coincides with the IPO price.
The deterioration in sentiment accelerated after SpaceX aborted the thirteenth Starship test flight minutes before launch. The automatic system interrupted the operation after detecting issues during the ignition sequence of several Raptor 3 engines on the Super Heavy booster. Elon Musk later confirmed that two engines will need to be replaced before the next launch attempt.
The incident increases pressure on a program considered a key component of SpaceX’s future valuation, as Starship is designed to expand the company’s launch capabilities, support Starlink’s growth and develop new commercial applications in the space sector.
The share price was also affected by the circulation of information later denied by Musk regarding an alleged $52 billion contract involving Foxconn and Nvidia, which the entrepreneur described as false information. The clarification allowed for a partial recovery in pre-market trading, although it did not alter the stock’s bearish structure.
Market positioning also reflects significant selling pressure. Nearly 49% of the free float is reportedly being lent for short-selling operations, according to market data, allowing bearish investors to accumulate approximately $8.7 billion in potential profits from the highs reached after the IPO.
Technical Analysis
From a technical perspective, SpaceX maintains a corrective structure after losing the support level at $135.
The Volume Point of Control (POC) is currently located around $158.85, slightly below the 38.20% Fibonacci retracement level at $161.79. This area coincides with the previous support range between the 25% Fibonacci level at $148.16 and the 38.20% retracement, making it the main technical resistance zone.
A recovery of the $148-$162 range would be necessary to improve the short-term structure, while the $135 level represents the first relevant resistance after losing the IPO price.
Momentum indicators continue to show weakness. The MACD maintains both the signal line and the moving average below the histogram, which remains in negative territory, although with a slight moderation in bearish pressure following the recent sharp correction.
The RSI stands at 25.34%, reflecting highly oversold conditions. Although this level may support short-term technical rebounds, it does not necessarily indicate a trend reversal while the price remains below its main moving averages.
The moving average structure confirms a corrective trend, with a sequence of lower highs and lower lows since the all-time high of $225.61.
The ActivTrades US Market Pulse indicator shows that, after several sessions of strong bullish moves, the asset is currently in a neutral risk zone, reflecting a loss of momentum following the sharp adjustment recorded.
Key Upcoming Catalysts
The market remains focused on SpaceX’s upcoming operational milestones, particularly the new Starship launch attempt, scheduled after technical corrections were made to the propulsion system.
A successful execution could help reduce bearish pressure and support a recovery toward lost technical levels. However, further delays or operational issues could maintain pressure on a stock that is currently trading below its initial market price.
Until SpaceX manages to recover the $135 level, the technical structure will continue to favor sellers, although the elevated level of short positioning could increase volatility in response to any positive news.
*******************************************************************************************
The information provided does not constitute investment research. The material has not been prepared in accordance with the legal requirements designed to promote the independence of investment research and such should be considered a marketing communication.
All information has been prepared by ActivTrades ("AT"). The information does not contain a record of AT's prices, or an offer of or solicitation for a transaction in any financial instrument. No representation or warranty is given as to the accuracy or completeness of this information.
Any material provided does not have regard to the specific investment objective and financial situation of any person who may receive it. Past performance and forecasting are not a synonym of a reliable indicator of future performance. AT provides an execution-only service. Consequently, any person acting on the information provided does so at their own risk. Political risk is unpredictable. Central bank actions can vary. Platform tools do not guarantee success.
ASMLTechnical Note: Let the market come to your zones and show its hand. Trade safely and manage your risk! Always wait for your own confirmations before entering the market.
Risk Disclaimer: This analysis is for educational purposes only and does not constitute financial advice. Always practice proper risk and position sizing. Stop Loss Must if you want to be a profitable Trader.
Netflix And Chill... Until The Buy Zone!Netflix topped in 2022 out of a diagonal — a reversal pattern that appears at the end of a trend. The drop that followed was sharp and fast, which is exactly how diagonals resolve.
From that low, price built a clean five-wave impulse into the 2026 high. That impulse is complete, and Netflix is now correcting it.
The correction is a simple ABC. Wave (A) dropped, wave (B) retraced into the 0.618, and wave (C) is now driving price lower into the buy zone.
The buy zone is where it gets interesting. The 0.382–0.5 retracement of the entire impulse lands directly on the long-term trendline that has held since 2018. Two independent levels pointing at the same area.
Once wave (C) completes there, the next impulsive leg higher begins.
Targets
- Take Profit 1: $134
- Take Profit 2: $236
Plan
- Wait for price to reach the buy zone
- Watch for wave (C) to complete
- Trendline break confirms the entry
Goodluck and as always, trade safe!
Could this be E-Lie Lilly? Institutions Just Showed Their Hand!There's an old saying we have in the South..."A lie doesn't care who tells it." That just simply means that when a lie wants to get out and be believed as truth, it doesn't care what method is used to accomplish that. Over the years, I've made my own addition to that..."A lie doesn't care who tell it, but it has its favorites". By that, I mean that some people (or institutions, systems, etc.) seem to be the chosen favorites to spread a lie. And I've come to learn in the trading world, that Market Makers are the #1 favorite choice of the Father of Lies.
Right now, I think that's exactly where a lot of traders find themselves with Eli Lilly. The story being told is "don't worry, this is just another pullback."
Well...that's not what the chart has been telling us. A couple of weeks ago, we pointed out the first major clue when Eli Lilly broke structure on the H1 chart. At the time, we expected price to work its way down into the H1/H4 Fair Value Gap around $1,145-$1,150, eventually reaching the H4 Demand Zone between $1,127 and $1,133.
That's exactly what happened. And, now the conversation has changed. Why? Because this is no longer just an H1 setup anymore. The H4 has now produced its own Break of Structure, and more importantly, the Daily chart has joined the party. That's a much bigger deal!
On the Daily chart, the market broke its Demand Zone on July 13, and since then we've watched price begin working its way back into that broken structure. That's exactly what I expect to see when institutions are rebalancing positions before making their next decision.
Now comes the question you should be asking when these seemingly bullish bounces. Is this really a recovery... or is it simply a Return to the Source to confirm the bearish Break of Structure. Those are two very different things.
This Return to the Source could push LLY back into this Daily Demand Zone or even back as high as the BOS Supply Source, BUT, If sellers defend this retest, the fall will likely continue. The next area I'm watching is the Daily Fair Value Gap, which sits around $965-$975. There is also an internal area around 1080 - 1100 that could temporarily hold this up until Earnings. I have that marked as possible, but not likely. If that imbalance is compromised, then the larger institutional objective becomes the Daily Demand Source between approximately $850 and $870. Wow! That's a long way from where we are today, and a Big Fat Whopping Lie away from where the market wants us to think it is going.
Now, am I saying the market has to go there? Absolutely not. Markets don't owe us anything. What I am saying, though, is that the structure has changed, and when structure changes, my expectations change with it. So, could buyers prove me wrong? Of course...but it has to be structural, and not hopeful expectations.
If bulls can reclaim the broken Daily Demand Zone (get a daily close back up above ~$1215) and eventually push back into the Daily BOS Supply Source with convincing closes, then I'll gladly reassess the bearish outlook. But until then, every rally has to be viewed through a different lens. Not as proof that the bulls are back...But as a possible institutional retest before another leg lower.
I would expect for this coming week to show us some twists and turns inside of these already identified areas, mostly with the purpose of trapping over-anxious buyers and option chasers who don't understand that the trap has been set. One of the biggest mistakes traders make is confusing a bounce with a reversal. Those aren't the same thing. Price doesn't move because we hope it will. Price moves because institutions reposition capital.
Our job is simply to recognize when they're leaving footprints and act on it. Reading those footprints are never a guarantee of course, but most of the time, they tell enough of the story to expose the Lie, and get you out of trouble!
What do you think? Is Eli Lilly building a base for another run higher...
Or is this simply a pause before the next move down?
If this helped you in any way, please give us a like or boost and leave your comments. Follow @AkeelahTraders here on TradingView if you'd like to continue following this analysis as the story unfolds. And check out our other posts for more market insights.
DPZ | Domino's Pizza Inc | Q3 2026 - Day Chart Domino's Pizza Inc - Engages in Pizza
----------------------------------
MARKET-BEATING SCORE = 2/10
Earnings coming in hot tomorrow.
-----------------------------------
Multiple Time-Frame Analysis; Color Code | Strength favors the higher timeframe.
Yearly timeframe = black
Monthly timeframe = pink
weekly = grey
daily = red
4hr = orange
1hr = yellow
15min = blue
5min = green if they are shown. (Level visibility on intervals is set to timeframe the level was found on and below to keep chart view organized.)
** Candle Science explained **
A Range = two or more consecutive color candles.
There are two types of ranges - accumulation and distribution.
DISTRIBUTION RANGES DEFINED:
When price is above a distribution range, these candles/levels act as support.
(BS) BACKSIDE Candle - First distribution candle in a distribution range. Expectation = strong reaction to price. long wicks reaching to or away from level.
(FS) FrontSide Candle - Last distribution candle in a distribution range. Expectation = reversal, create a trend in the opposite direction. Distribution candles are used as support.
ACCUMULATION RANGES DEFINED: When price is below an accumulation range, these candles/levels act as resistance.
INVERSE BACKSIDE (Inv.BS) - First Accumulation candle in an accumulation range. Expectation. = strong reaction to price. long wicks reaching to or away from level.
INVERSE FRONTSIDE (Inv.FS) - Last accumulation candle in an accumulation range. Expectation = reversal, create a trend in the opposite direction. Accumulation candles are used as resistance.
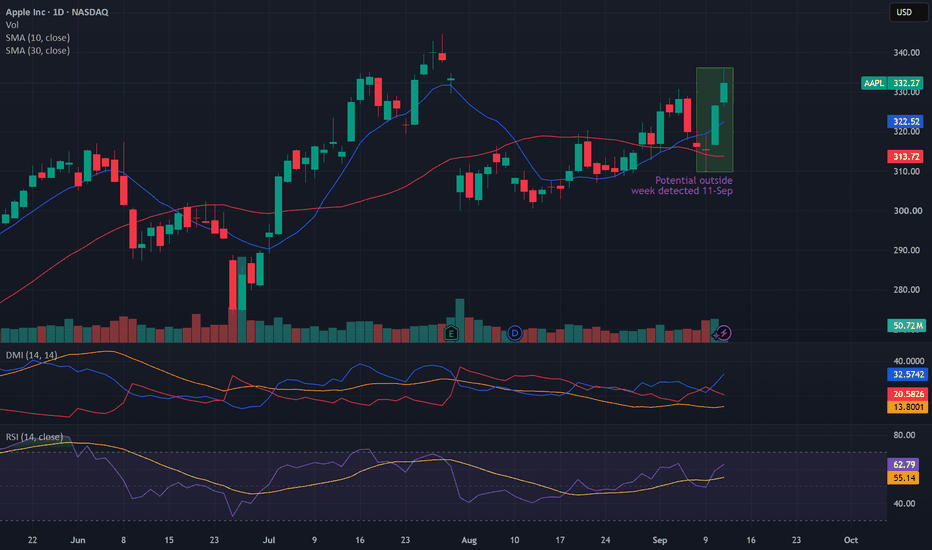
AAPL 4H — Bullish Pennant BreakdownAAPL on the 4‑hour chart is forming a clean bullish pennant after a strong impulsive move. Price is compressing tightly, volume is confirming momentum, and ATR shows healthy volatility. This breakdown highlights the structure, levels, and target zone to watch.
Key Levels:
• Support: 289
• Resistance: 308–310
• Target: 334.11
• Pattern: Bullish Pennant
• Timeframe: 4H
Clean, no‑noise technical analysis from Taxpayer Trades.
PINS. Interesting level at the lows.Advertising and media, maybe boosted by the bots and agents, of AI in the near future.
They have enough,expertise to capture a share in the market.
Should the market support the price incursion to new levels, there is a strong possibility for recovery from the bear sleep.
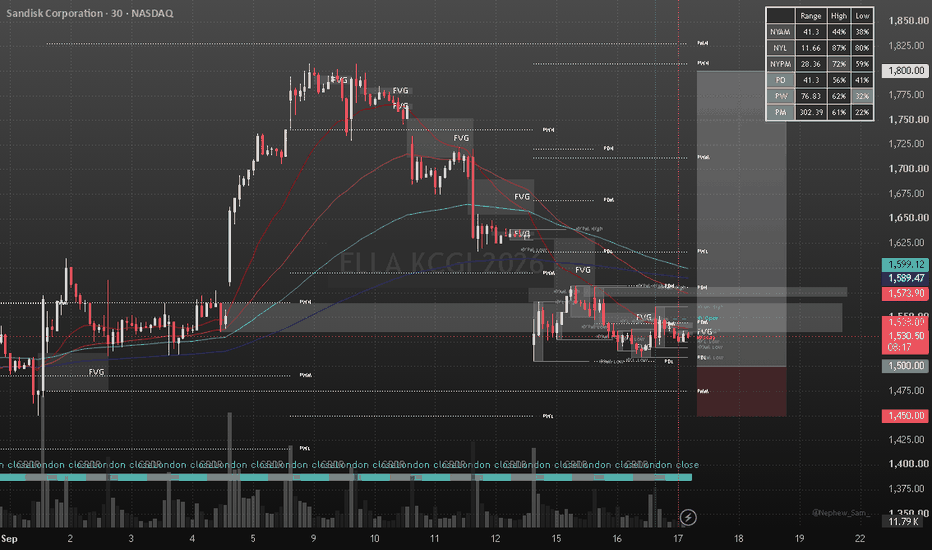
SNDK: The Retracement We’ve Been Waiting For?🚀 SNDK: The Retracement We’ve Been Waiting For? 📉🔍
The market has been absolutely electric with **Sandisk Corporation (SNDK)** in the first half of 2026. After an explosive run that saw the stock soar over 500% year-to-date, we are currently witnessing a healthy, albeit rapid, retracement. For those of us who missed the initial vertical move, this is exactly the kind of setup we look for to join the trend at a discount. 💎
---
📊 Technical Overview & The "Reset"
SNDK recently sliced through the **Fibonacci 50% retracement level** ($1,456.61), signaling that the market is aggressively testing the strength of the previous move. While a "rapid retracement" can feel intimidating, in the context of such a massive 2026 rally, this is often just the cooling-off period required to build a base for the next leg higher.
Currently, we are keeping a laser focus on the **support confluence** forming below us.
🎯 The Game Plan: Key Levels to Watch
We are looking for a potential bounce or consolidation zone between the **0.618 and 0.786 Fibonacci levels**. Here is why this zone is critical:
* **0.618 Fib Level ($1,244.89):** A classic technical support level where buyers often step back into the market.
* **0.786 Fib Level ($943.45):** The "deep value" zone. If we see price action reach here, we are effectively looking at a significant discount from the recent highs of $2,354.39.
* **Order Block & Volume:** We have a clearly marked **Order Block with high volume** residing in this area. This indicates where institutional interest was previously heavily concentrated—where the big money was "buying the dip" earlier this year.
* **MA 100:** The 100-day Moving Average is curving up toward this support pocket, providing dynamic support that often acts as a floor for high-growth tech stocks.
---
📅 The Catalyst: Earnings Watch
We are playing this smart. With **Earnings scheduled for August 5, 2026**, there is no need to rush in blindly.
Historically, Sandisk has shown explosive revenue growth driven by the massive demand for NAND in AI infrastructure. Last quarter, they beat guidance significantly, and with long-term contracts worth billions already locked in, the fundamental story remains incredibly strong despite the recent price compression.
**My Strategy:**
1. **Patience is Key:** I am waiting for the price to stabilize within the demand zone between $1,244 and $943.
2. **Volume Confirmation:** I want to see a drop in selling pressure and a "climax" candle on high volume before committing capital.
3. **Earnings Setup:** I’ll be looking for a tight consolidation pattern right into the August 5th earnings print. A strong reaction to earnings from this support level would be the ultimate "Green Light" for a long entry.
---
🧠 Final Thoughts
Don't let the red candles fool you. SNDK’s pullback is not a sign of a broken business; it’s a valuation reset. As the memory chip market remains supply-constrained due to AI capacity requirements, the underlying bullish thesis for Sandisk is arguably stronger than ever.
**Are you buying the dip, or waiting for more confirmation? Let me know your thoughts below! 👇**
*Disclaimer: This is for informational purposes only and does not constitute financial advice. Always do your own research before placing a trade!*
#SNDK #TradingView #StockMarket #TechnicalAnalysis #NAND #AI #Investing #Bullish