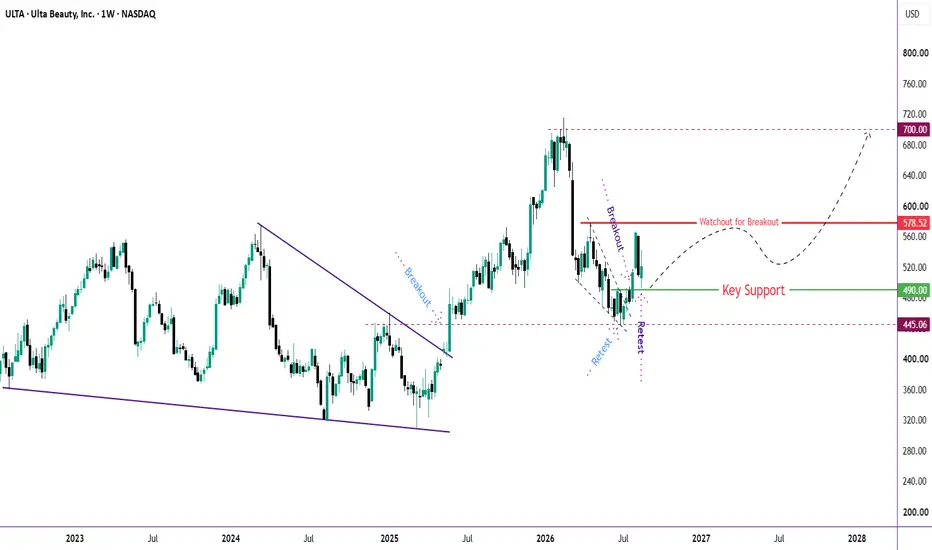
Long
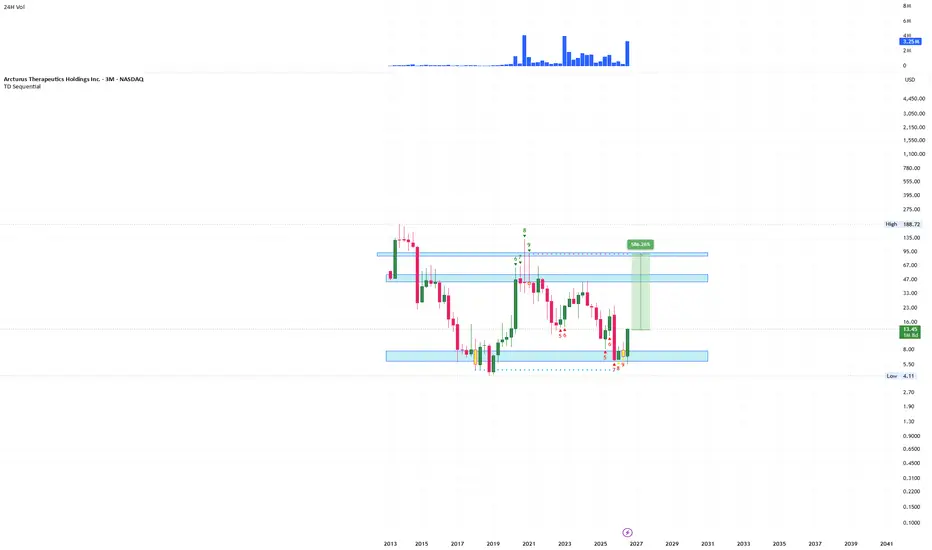
Long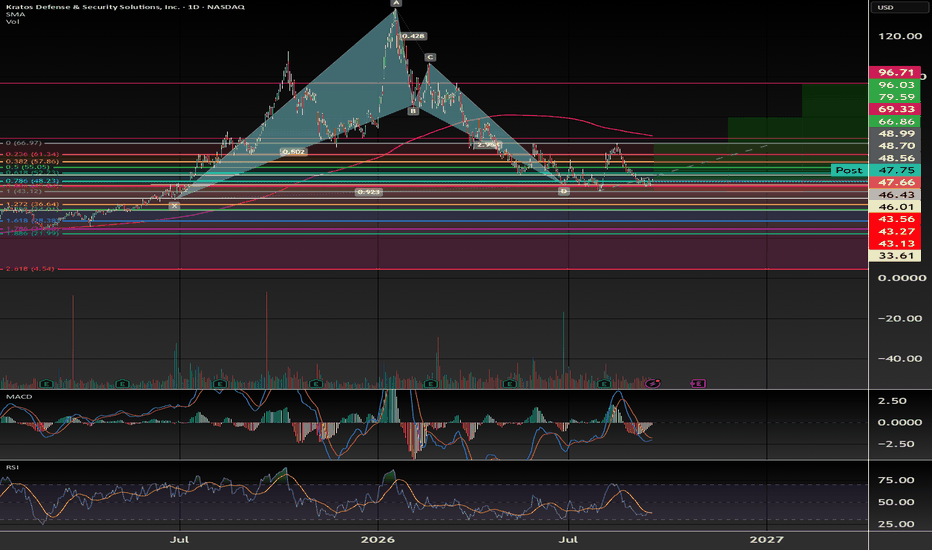
 Short
Short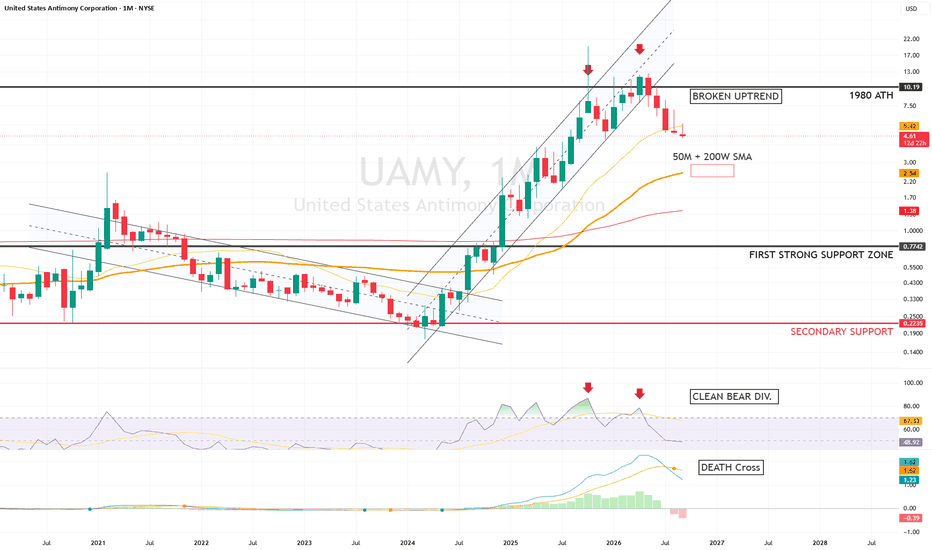
ORB for Swing Traders. The Quarterly Range Breakout (QRB) MethodTaking the principles of the 15-Minute ORB and applying them to swing trading
For years, one of the most popular approaches to intraday trading has been the Opening Range Breakout, or ORB.
The concept is beautifully simple:
Allow the market to establish an initial range.
Mark the high and low of that range.
Wait for price to break outside of it.
Use the breakout, market structure, momentum, and available space to determine whether a new directional move is developing.
I have spent a lot of time studying and trading the 15-minute ORB, and eventually I started wondering:
Could the same market principle be used for swing trading?
I wasn't interested in simply using a larger intraday opening range.
I wanted something that could potentially identify major directional moves lasting weeks or months.
That question eventually led to what I call the:
QRB — Quarterly Range Breakout
The idea started with something very simple.
Instead of asking:
- "What happens when price breaks the first 15 minutes of the trading day?"
I asked:
- "What happens when price breaks the established range of an entire quarter?"
And that is where things became very interesting.
__________________________________________________
Why the Quarterly Candle?
A calendar quarter represents roughly three months of price discovery.
During that period, the market has time to establish:
a significant high,
a significant low,
areas of acceptance and rejection,
support and resistance,
institutional positioning,
and a defined trading range.
In equities, the quarterly structure also naturally lines up with the rhythm of corporate reporting and portfolio positioning.
But the concept itself doesn't depend on earnings.
That distinction is important.
QRB is a price-action strategy, not an earnings strategy.
The quarterly candle simply gives us a large, clearly defined piece of market structure.
Its:
High = upper boundary of the quarterly range
Low = lower boundary of the quarterly range
Then, during the following quarter, I watch how price reacts to those boundaries.
That is remarkably similar to what we do with an intraday ORB.
_______________________________________________________________
From 15 Minutes to 3 Months
This was the part that really caught my attention.
If you hide the timeframe and simply study the structure, a quarterly breakout can look surprisingly similar to a 15-minute ORB breakout.
The timeframe changes.
The underlying auction behavior doesn't.
A 15-minute ORB might look like:
Opening range → breakout → acceptance → continuation → target
The QRB often develops in the same basic sequence:
Quarterly range → breakout → acceptance → continuation → larger target
That realization became the foundation of the strategy.
We're essentially taking an intraday market-structure concept and fractalizing it upward into a swing-trading framework.
___________________________________________________________________________
How the QRB Works
At the beginning of a new quarter, the previous completed quarter gives us our reference range.
We mark:
Quarterly High
and
Quarterly Low
Those levels remain important throughout the following quarter.
From there, I am primarily looking for one of two situations:
Bullish QRB
Price breaks above the previous quarterly high.
I then want evidence that the market is actually accepting prices above the range rather than simply producing a temporary wick or false breakout.
If momentum, structure, and price action remain bullish, the breakout can become the beginning of a larger swing move.
Bearish QRB
Price breaks below the previous quarterly low.
Again, the breakout itself is not enough.
I want price to demonstrate acceptance below the range along with bearish structure and momentum.
The quarterly low then becomes the equivalent of the lower ORB boundary.
_________________________________________________________
The Breakout Is Not the Trade
This is one of the biggest lessons I learned from trading ORBs.
A line getting crossed does not automatically create a good trade.
The range is the location.
Price action tells us whether the breakout is legitimate.
That means I still want to evaluate things like:
momentum,
market structure,
breakout candle quality,
follow-through,
rejection versus acceptance,
nearby support and resistance,
trend direction,
volume where appropriate,
and whether price has enough open space to move.
That is exactly the same mentality I use with an intraday ORB.
The QRB gives me the battlefield. Price action tells me whether the breakout is worth hunting.
________________________________________________________
Quarterly Range Targets
Another concept transferred directly from ORB trading was using the size of the opening range to project potential targets.
With QRB, we can do the same thing.
First calculate the quarterly range:
Quarterly High − Quarterly Low = Quarterly Range
That range can then be projected above and below the original boundaries.
For example:
0.5× range
1.0× range
1.5× range
2.0× range
additional Fibonacci-based extensions
This creates objective areas where price may encounter resistance, support, profit-taking, or consolidation.
Instead of randomly deciding where a swing trade should end, the range itself helps build the roadmap.
And that is why I eventually developed the Quarterly Range Breakout with Targets indicator.
____________________________________________________________
Something Else Surprised Me
Originally, I was thinking mostly about stocks.
Then I started applying the same concept to other markets.
And the structure kept appearing.
I found compelling examples in:
Stocks
Futures
Forex
That was important because it suggested something deeper was happening.
The concept wasn't necessarily dependent on a stock market opening bell or quarterly earnings.
It appeared to be capturing a more fundamental market behavior:
Markets establish ranges, liquidity develops around those ranges, and meaningful breaks from
established ranges can lead to price expansion.
That principle exists across markets.
_____________________________________________________________
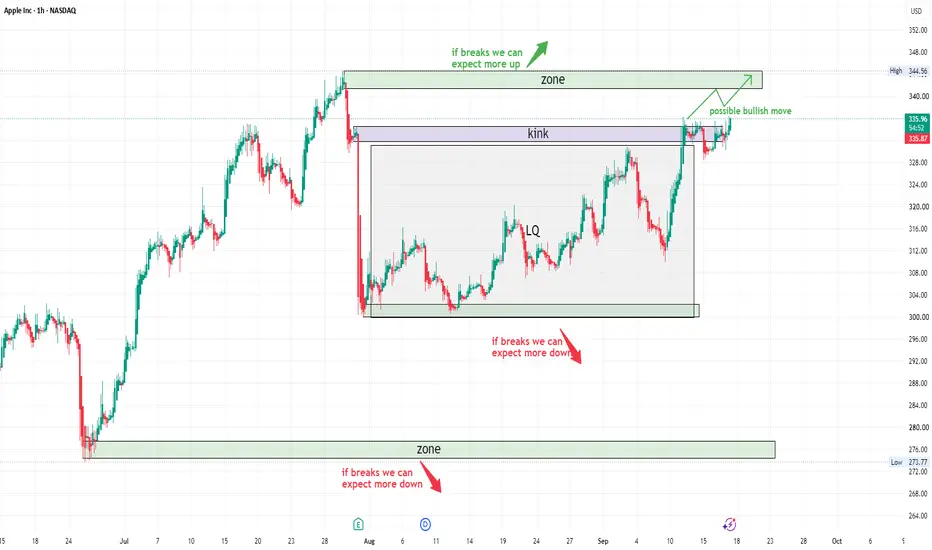
Apple Is a Great Example
The Apple chart shown here demonstrates why this caught my attention.
Each completed quarterly range creates clearly visible structural levels.
Then you can watch the following quarter interact with them.
Price may:
break the range → establish acceptance → expand
or
test the range → reject → rotate back inside
When viewed this way, the chart begins to resemble an ORB chart — only the resulting moves can last weeks or months instead of minutes.
That was the moment where the concept really clicked for me.
How I Prefer to Trade QRB
I don't want to predict which direction the next quarter will go.
That defeats the purpose.
The QRB gives me two predefined boundaries and allows the market to show its hand.
My basic process is:
Let the quarter complete.
Mark its high and low.
Enter the next quarter with no directional assumption.
Wait for price to approach a QRB boundary.
Watch for a legitimate breakout rather than simply a wick through the level.
Confirm momentum and market structure.
Make sure there is clear space beyond the breakout.
Use the quarterly range projections as potential targets.
Manage risk around market structure rather than forcing an arbitrary stop.
That last point matters.
The goal isn't to catch every breakout.
The goal is to catch the clean expansions after a meaningful quarterly range has been broken.
___________________________________________________________
ORB and QRB Are Different Timeframes of the Same Idea
This is ultimately the philosophy behind QRB.
A 15-minute Opening Range Breakout asks:
Where does price go after breaking an important intraday range?
QRB asks:
Where does price go after breaking an important three-month range?
One might produce a 20-point intraday move.
The other might produce a move lasting several weeks.
But structurally, the thought process can be remarkably similar.
Range → Break → Confirmation → Expansion → Target
That's QRB.
_______________________________________________________________
What QRB Is — and What It Isn't
QRB isn't designed to predict tops or bottoms.
It isn't designed to forecast earnings.
And it isn't based on blindly buying every quarterly high or shorting every quarterly low.
It is a market-structure framework.
The range tells us where something important may happen.
Momentum and price action help tell us whether something important is happening.
And the range projections give us a logical framework for where that move could travel.
____________________________________________________________________
The Bigger Idea
What started as an attempt to turn the 15-minute ORB into a swing-trading strategy became something much more interesting to me.
It showed me that good trading concepts don't necessarily belong to one timeframe.
Sometimes the timeframe is simply the lens.
The underlying behavior of buyers, sellers, liquidity, ranges, breakouts, acceptance, rejection, and expansion remains.
That's the idea behind the Quarterly Range Breakout — QRB.
Take a proven concept of range expansion.
Scale the timeframe.
Let price establish the battlefield.
Then wait for the market to show which side wins.  Education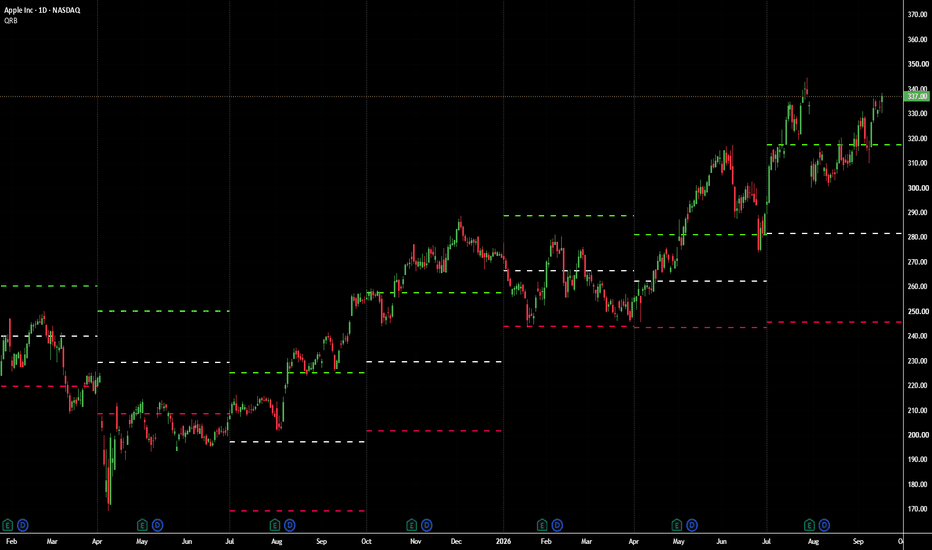
 Long
Long
 Long
Long
 Long
Long
$7 Zone Hit Early, But the Setup Just ChangedSetup:
Called the $7 zone as the next real technical level after $12 broke. Didn't expect to be here this fast. Today's guidance cut got it there in one session:
-> FY revenue cut from ~$3B to $2.4B
-> adjusted EBITDA guidance flipped from a $10M loss to a $200M loss.
Price is trading at $7.60, essentially already inside the zone.
Technical Picture:
-> Weekly structure: $31 high (2026), $26 resistance, $12 was the prior key support, now broken
-> $7 is the 2025 low, the last real structural level before price is in open air
-> Weekly 200 SMA still sits well above current price, downtrend structure intact
Bias:
Leaning bearish short-term, not neutral. A guidance cut this size (EBITDA loss guide moving 20x worse) usually forces a multi-week re-rating as models get rebuilt, not a one-day drop and bounce. Truist cut to $10, Baird cut to $3, both after today's numbers, so the repricing isn't finished.
Entry:
Not chasing a long here. Watching the $7 zone for how price reacts (a bounce/reaction candle vs. a clean breakdown through it) before considering any entry, per the fundamental check below.
Target:
If $7 holds and a reaction develops, first reference target is back toward the $9-10 zone (former support, now the level that needs to be reclaimed). If $7 breaks, there's no printed swing low below it on this chart, it's open until one forms.
Timeframe:
Swing setup. Expecting this to resolve over the next several weeks as the guidance-cut repricing plays out, not a single-session move.
Fundamental Check:
Not treating the $7 zone as an automatic buy. A ~$6.4B backlog means nothing if it can't be built at a profit, and that's exactly what today's numbers just confirmed is happening. Want to see what margin actually looks like once price is in the zone, not before.  Short
Short
 Long
Long
 Long
Long
### CRWD — Two Months Later, the 2.618 Target Is in SightBack in June, I posted a CRWD chart using a Fibonacci extension to identify a longer-term target around the old $1,000 level pre-split.
Two months later, CRWD has traded above $250, putting it within touching distance of the actual 2.618 Fib extension at $254.35
Of course, I trimmed the position on the way up and locked in some gains, but I've maintained a core position throughout. For me, that's an important part of the process — participate in the longer-term thesis while still managing risk and taking profits when the market offers them.
What makes the level particularly interesting now is the confluence. The current weekly R5 pivot sits at $254.80, almost directly on top of that original 2.618 extension.
So for me, $254–255 is now a decision zone rather than an automatic sell target.
I'll be watching how price behaves when it gets there. A sharp rejection on volume would suggest the extension is acting as resistance and could justify another trim. Consolidation around the level followed by acceptance above $255 would be a very different signal and potentially open the door to the next Fib extension at 3.618 around $290.72.
The useful lesson for me isn't that Fibonacci predicts where a stock will go. It doesn't. But major extensions can provide objective levels identified well in advance where you know to stop, observe the price action, and make a decision.
CRWD: $254–255 is the next level I'm watching.  Long
Long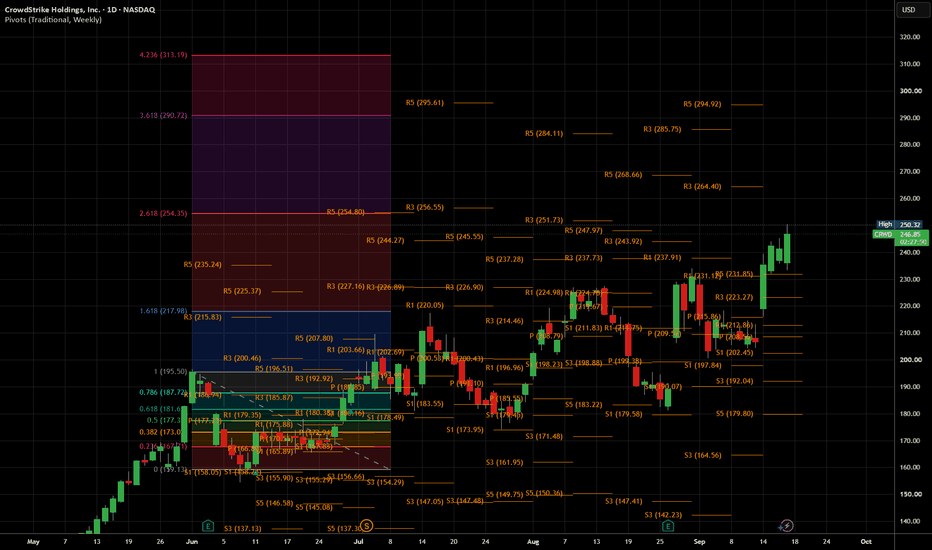
 Long
Long
Oracle May Have BottomedOracle has struggled for the last year, but there could be signs of the software company bottoming.
The first pattern on today’s chart is the August 6 low near $139. ORCL bounced at that level in mid-August, early September and again this week. Is support confirmed?
Second, the level could represent a higher low compared with July’s trough. Combined with the earlier low in February, some traders may see a long and rounded basing pattern. (See the yellow arrows.)
Third, stochastics are trying to turn up from an oversold condition.
Next, prices bounced at the 50-day simple moving average and are now back above the 21-day exponential moving average.
Finally, ORCL is an active underlier in the options market. (Its average daily volume of 296,200 contracts ranks 12th in the S&P 500, according to TradeStation data.) That could help traders take positions with calls and puts.
TradeStation has, for decades, advanced the trading industry, providing access to stocks, options and futures. If you're born to trade, we could be for you. Learn more here about TradingView’s Broker of the Year!
Past performance, whether actual or indicated by historical tests of strategies, is no guarantee of future performance or success. There is a possibility that you may sustain a loss equal to or greater than your entire investment regardless of which asset class you trade (equities, options or futures); therefore, you should not invest or risk money that you cannot afford to lose. Online trading is not suitable for all investors. View the document titled Characteristics and Risks of Standardized Options at www.TradeStation.com . Before trading any asset class, customers must read the relevant risk disclosure statements on www.TradeStation.com . System access and trade placement and execution may be delayed or fail due to market volatility and volume, quote delays, system and software errors, Internet traffic, outages and other factors.
Securities and futures trading is offered to self-directed customers by TradeStation Securities, Inc., a broker-dealer registered with the Securities and Exchange Commission and a futures commission merchant licensed with the Commodity Futures Trading Commission). TradeStation Securities is a member of the Financial Industry Regulatory Authority, the National Futures Association, and a number of exchanges.
Options trading is not suitable for all investors. Your TradeStation Securities’ account application to trade options will be considered and approved or disapproved based on all relevant factors, including your trading experience. See www.TradeStation.com . Visit www.TradeStation.com for full details on the costs and fees associated with options.
Margin trading involves risks, and it is important that you fully understand those risks before trading on margin. The Margin Disclosure Statement outlines many of those risks, including that you can lose more funds than you deposit in your margin account; your brokerage firm can force the sale of securities in your account; your brokerage firm can sell your securities without contacting you; and you are not entitled to an extension of time on a margin call. Review the Margin Disclosure Statement at www.TradeStation.com .
TradeStation Securities, Inc. and TradeStation Technologies, Inc. are each wholly owned subsidiaries of TradeStation Group, Inc., both operating, and providing products and services, under the TradeStation brand and trademark. When applying for, or purchasing, accounts, subscriptions, products and services, it is important that you know which company you will be dealing with. Visit www.TradeStation.com for further important information explaining what this means.  Long
Long
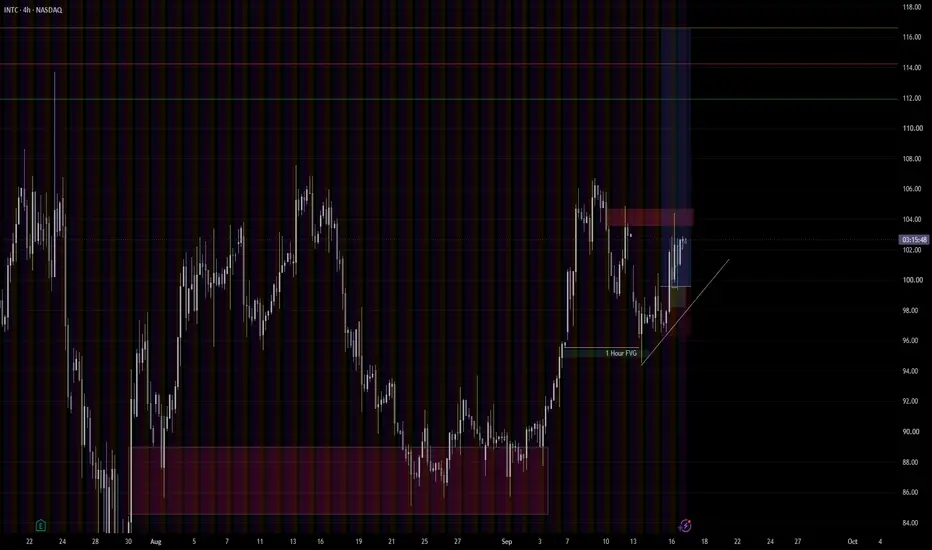
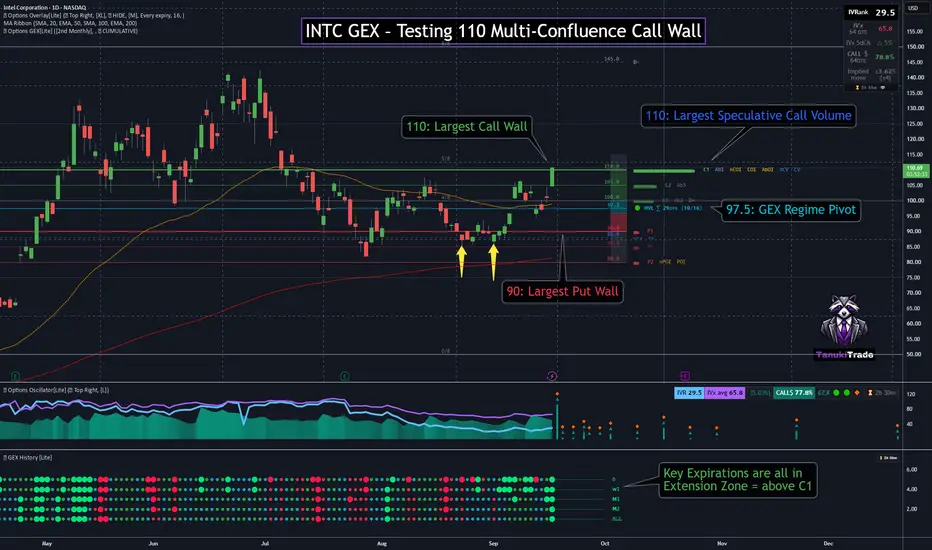
INTC GEX – Testing 110 Multi-Confluence Call WallINTC is pressing into 110 on the daily chart after a strong momentum expansion. Spot is only marginally above the level, so this remains a test rather than confirmed acceptance.
The October 16 cumulative GEX profile makes 110 the central decision point. It is the highest call wall and also overlaps a technically important reaction area visible on the daily chart.
🔶 Regime Context 🔶
With price above the 97.5 HVL and the 100 call-cluster boundary, INTC remains in a positive GEX regime.
GEX History shows 0, W1, M1, M2, and ALL aligned in large-green positive extension. This is a dampening-volatility backdrop rather than a directional signal. The current momentum candle is testing C1, but acceptance still requires a sustained hold above 110.
🔶 Options Structure Context 🔶
👉 110 – C1 multi-confluence wall
Confluence at 110:
C1 — highest call NETGEX
Ab1 — largest absolute gamma
nCOI / COI / AbOI — dominant call and absolute open-interest concentration
CV / PV — largest cumulative call- and put-volume peaks
This makes 110 a major reaction zone rather than merely a round-number resistance. Since both call and put volume peak here, the volume concentration is two-sided and should not be treated as a standalone bullish flow signal.
🔶 Key Structure to Watch 🔶
Above 110 — sustained acceptance keeps INTC in positive extension, with gamma squeeze potential toward the 115 and 120 secondary NETGEX references
Below 110 — rejection returns price toward 105, followed by the 100 call-cluster boundary
97.5 — HVL and GEX regime pivot
90 — strongest put wall (P1)
For now, 110 is where the technical structure, C1, absolute gamma, open interest, and volume all meet.
The key question is whether INTC can turn 110 from resistance into support—or whether this extension test ends in rejection.  Long
Long
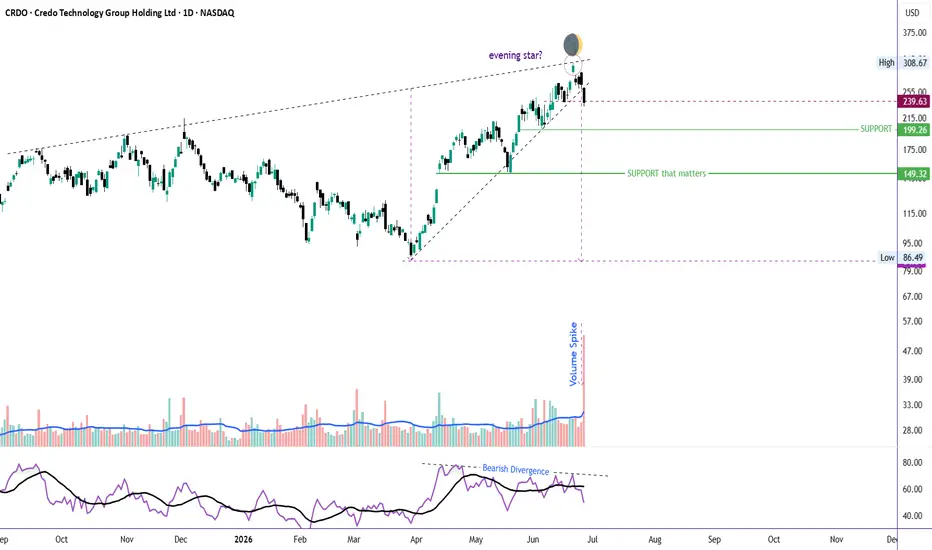
CRDO: Multi-TF Bearish Divergence Signals a Major CorrectionCRDO has hit the target shared previously (see attached post).
Now it appears to be entering a significant corrective phase after an extended bullish run.
The stock has developed bearish divergence on both the Daily and Weekly timeframes, indicating that bullish momentum has been fading despite price making new highs. It recently reached the upper boundary of a rising wedge near 308, where sellers stepped in aggressively.
Adding to the bearish case, price formed an Evening Star reversal pattern, followed by a gap-down session that confirmed the shift in momentum. The subsequent breakdown below the wedge occurred on nearly four times the average daily trading volume, suggesting strong institutional selling rather than routine profit-taking.
In the short term, CRDO could attempt a throwback to retest the breakdown area around 260. However, unless that level is reclaimed decisively, the path of least resistance remains to the downside.
Key support levels to watch are:
199 – First major support
149 – Secondary support
86–90 – Long-term measured target based on the wedge breakdown
Bearish thesis invalidation: A strong daily close above 310 would invalidate the current bearish setup and shift the outlook back in favor of the bulls.
While short-term bounces are always possible, the combination of multi-timeframe bearish divergence, a completed rising wedge breakdown, heavy distribution volume, and a confirmed reversal candlestick pattern suggests that the correction may have only just begun.  Short
Short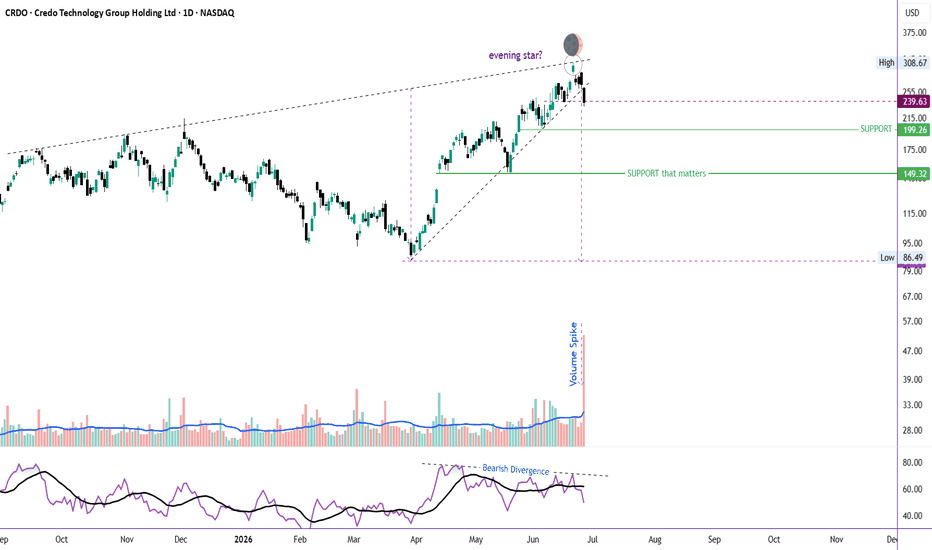
 Long
Long
 Long
Long
 Long
Long