Max Power, a high risk/reward playIf this is a wave 3 it could unfold in parabolic fashion. Continued drill results with high concentrations of hydrogen and helium coupled with flow rate findings that suggest commercial viability could do the trick.
A quick google search turns up the following major investors:
Major Shareholder BreakdownEric Sprott: 24.35% equity stake. Operating through his investment vehicle, 2176423 Ontario Ltd., Sprott significantly deepened his position following a major warrant exercise. He holds roughly 47 million shares and controls over 58% of the company's remaining warrants.
Big Energy Joint Stock Company: 14.5% ownership. The Vietnam-based strategic affiliate completed its massive 25-million-warrant exercise, infusing capital to support exploration at the Lawson Complex.REV Exploration (TSXV: REVX): 3.5% ownership. Holds approximately 6 million common shares of the company.Raymond Dunlop: 1.18% ownership. Holds approximately 2.03 million shares.
Management & Insider OwnershipOutside of these large blockholders, key management personnel maintain minor direct equity stakes alongside options and RSUs to align themselves with performance:
Chad Justin Levesque (President): ~0.16% (270,000 shares)
Tom Kishchuk (Director): ~0.13% (220,500 shares)
Allan Neil McMillan (Director): ~0.09% (157,700 shares)
As of the company's latest corporate updates, MAX Power has 193,505,888 common shares issued and outstanding.
 Long
Long
 Long
Long
Bank of Montreal — Downside Structure Targeting 216Bank of Montreal is currently exhibiting a weakening price formation, with recent trading behavior leaning decisively toward the downside. The balance between buyers and sellers appears to be shifting in favor of the latter, creating room for another decline toward the 216 region.
The present chart suggests that upside recoveries are struggling to regain meaningful traction. Instead of establishing a convincing reversal, price remains exposed to additional depreciation as bearish momentum continues to influence the broader structure.
The 216 level represents the principal downside objective for this setup. A continuation of the current pattern could gradually take the stock through lower price zones, with intermittent rebounds possible during the journey. Such counter-moves would not necessarily alter the broader view unless they develop into a sustained structural recovery.
This analysis is centered on the behavior of price rather than short-term noise. The market is currently showing signs of reduced bullish conviction, while selling activity is becoming increasingly influential. That imbalance keeps the bearish thesis active and places greater emphasis on the lower levels ahead.
Bank of Montreal may also respond to changes in Canadian interest-rate expectations, economic growth, credit conditions, banking-sector sentiment, housing activity, currency movements, and broader financial-market risk appetite. These variables can affect volatility, but the current technical configuration continues to point toward a weaker trajectory.
Projected sequence:
Loss of upside strength → increasing downside pressure → continuation of the decline → 216 target area.
📍 Market Bias: Bearish
📉 Trade View: Sell
⚠️ Current Condition: Weakening structure
🎯 Projected Objective: 216
🔻 Expected Direction: Lower
The chart remains vulnerable beneath its current structure, with 216 standing as the key downside destination while sellers retain influence over the price action.  Short
Short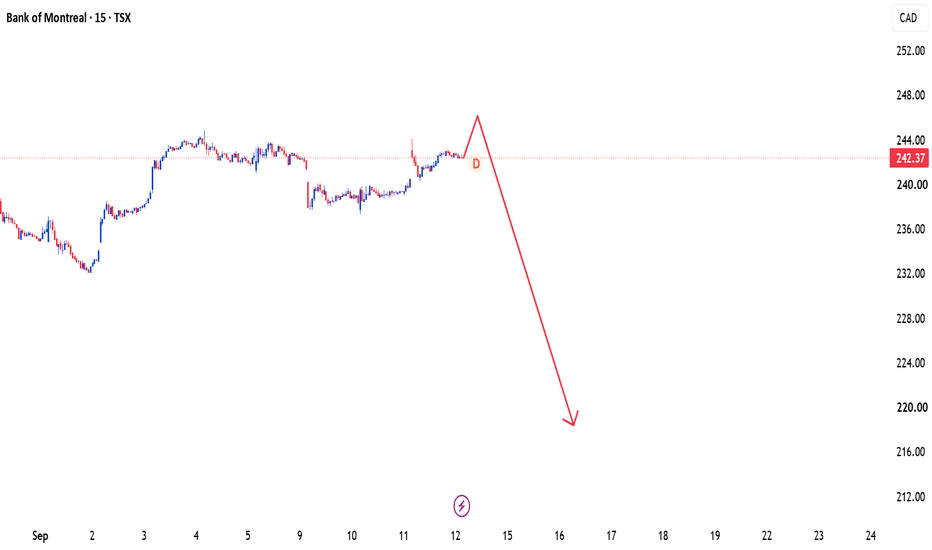
Shopify — 160 Pullback Before the Bigger Move Toward 250📈 Shopify — Strategic Pullback Before the Next Major Upside Leg
Shopify is presenting an interesting bullish setup, but the projected path is not a straight-line advance. The current analysis suggests that price may first retrace toward the 160 region, creating a deeper corrective phase before the larger upward movement develops.
The 160 area is therefore an important part of the roadmap. Rather than interpreting the projected decline as a complete change in direction, this scenario views it as an intermediate retracement within a broader bullish thesis. Once this phase is completed and the market regains upward traction, Shopify could begin a much stronger expansion toward the 250 target zone.
The key feature of this setup is the sequence of the move:
Current price action → retracement toward 160 → bullish transition → major expansion toward 250.
From a technical perspective, the anticipated pullback could provide the market with an opportunity to reset before another substantial advance. The reaction around 160 will therefore be an important area to monitor, as the subsequent price behavior can determine how quickly the larger bullish leg develops.
The broader outlook for Shopify can also be influenced by e-commerce growth, consumer spending, merchant activity, technology-sector sentiment, interest-rate expectations, and developments across global equity markets. These variables can affect volatility and timing, while the projected technical roadmap remains centered on the 160-to-250 sequence.
The larger objective is 250, but the route toward that destination may begin with a temporary move lower. This distinction is important: the projected dip does not necessarily invalidate the bullish thesis; instead, it forms part of the expected market structure.
📍 Initial Pullback Area: 160
📈 Overall Bias: Bullish
🔄 Expected Intermediate Move: Downward retracement
🚀 Major Upside Objective: 250
🎯 Projected Roadmap: 160 → 250
The setup is built around patience with the broader direction — first the anticipated retracement toward 160, then the potential bullish expansion toward 250.  Long
Long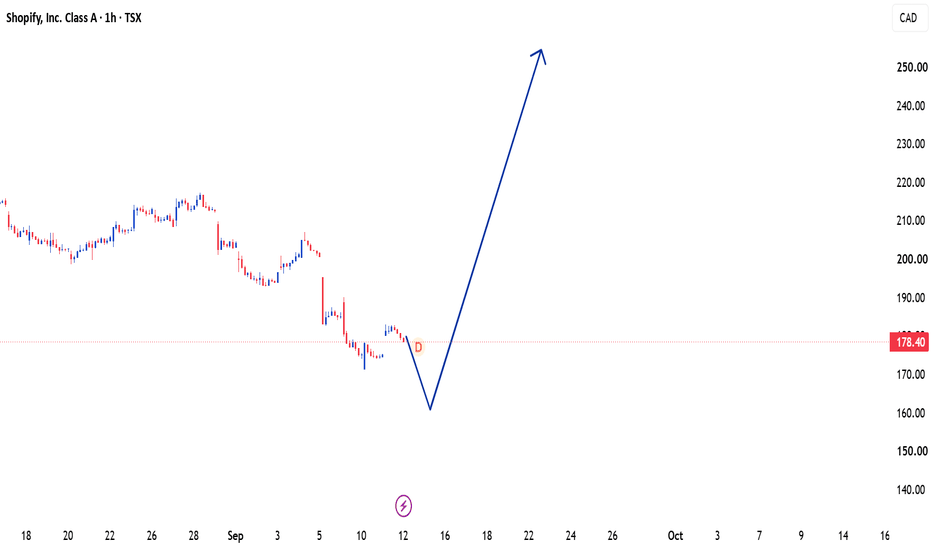
Royal Bank of Canada — Downside Scenario Targeting 278Royal Bank of Canada is currently presenting a deteriorating market picture, with recent price behavior suggesting that downside pressure could continue to influence the stock. The balance appears to be shifting away from the buying side, creating conditions for a further decline toward the 278 area.
The current technical landscape reflects a loss of upward strength, while lower levels are becoming increasingly exposed. Attempts to recover may face difficulty in establishing a sustained change of direction, leaving the market susceptible to another phase of depreciation.
The 278 level represents the central downside objective for this setup. If the prevailing negative structure continues to develop, price could gradually extend its decline and work toward this projected destination.
This trade idea is based on the evolving market formation rather than reacting to individual price fluctuations. Short-term volatility may create temporary upward movements, but the broader picture continues to favor the selling scenario as long as the existing bearish conditions remain present.
Royal Bank of Canada's movement may also be affected by interest-rate expectations, Canadian economic developments, banking-sector performance, credit-market conditions, corporate news, and wider global sentiment. These influences can change the pace of price movement, while the current analytical outlook remains focused on lower levels.
Projected market path:
Current weakness → further loss of momentum → sustained downward movement → 278 target zone.
📍 Market View: Bearish
📉 Trade Direction: Sell
⚠️ Current Tone: Downside pressure
🎯 Projected Target: 278
🔻 Expected Outcome: Continued decline
The structure is keeping the selling side in control, and 278 remains the major level on the chart as the next potential destination.  Short
Short
SHOP | Weekly Bullish, Daily Flip Zone DecidesBy analyzing the #SHOP (Shopify) chart, we can see a market where the weekly has already made its decision and the daily is deciding when.
1W Timeframe
Weekly chart:
The recovery from the 2022 lows was built internally — an i CHoCH , then repeated i BOS . In 2025 price broke the external swing high and printed a real CHoCH above CAD 220 . Internal breaks say a correction is progressing. An external break says the trend has changed hands.
Two protected lows frame the risk: CAD 33.26 external, CAD 99.87 internal — the working invalidation. Between them sits the weekly Order Block at CAD 123.03 – CAD 136.88 , which price returned into, reacted from, and rallied out of. That reaction is why the case is live.
Above, the resting liquidity at CAD 252.59 is the objective. Price is at CAD 178.41 — a correction inside an intact uptrend.
1D Timeframe
Daily chart:
Price ran out of the weekly block, printed a daily CHoCH , swept CAD 252.59 , and rolled over. It has now arrived at the Daily flip zone (CAD 155.69 – CAD 185.95) — resistance through July and August, support now — trading in the upper third of it.
The weekly says the direction. The daily says when.
The Bias
Bullish while price holds above CAD 99.87.
Scenario A. The flip zone holds and price continues toward CAD 252.59 . I want confirmation on the daily close first — an MSS from inside the zone, or a decisive bullish engulfing. A touch of the top edge is not a reaction.
Scenario B. Price works toward CAD 155.69 before turning. Same trade, better price.
Scenario C. A close beneath CAD 155.69 puts the weekly Order Block back in play as the deeper entry — not an invalidation.
Invalidation: a decisive close beneath CAD 99.87 .
And the rule: a break is a candle close, not a wick.
Fundamental Backdrop
Q2 2026 revenue of $3.58 billion , up 34% year over year, net income up 66%, margin expanding to 42%. AI-referred orders nearly 13x higher with conversion around 50% above organic search. Bernstein initiated at Outperform, Piper Sandler raised to $180, consensus near $171.
The counterweight: the stock fell nearly 8% in one session in early September on rotation out of high-multiple growth names — despite those earnings. P/E near 87 , down roughly 21% year to date.
A company compounding revenue in the thirties, repriced for multiple rather than performance. That is what produces a retracement this deep into structure — and why the confirmation matters more than the level.
This analysis will be updated as the market evolves.
Best Regards, BigBeluga 🐳  Long
Long
Wheaton Precious Metals CorpWheaton Precious Metals Corp. is one of the largest precious-metals streaming companies in the world, generating revenue primarily through long-term agreements that provide exposure to gold and silver production from mining operators. Unlike traditional miners, the company generally avoids many direct operating and development risks associated with mine ownership, allowing it to maintain a relatively asset-light business model with strong cash-flow characteristics.
From a strategic perspective, Wheaton's business is closely linked to long-term trends in precious-metals prices, inflation expectations, monetary policy, and investor demand for defensive assets. As a result, the company may benefit during periods of economic uncertainty, currency debasement concerns, or increased demand for portfolio diversification.
Looking at the technical landscape, the higher-timeframe structure remains constructive and continues to support a favorable long-term outlook. The broader pattern suggests that the stock may be building a foundation for continued upside development and potentially higher valuation levels over time. However, despite the encouraging long-term structure, lower-timeframe confirmation signals are not yet fully established.
As emphasized in previous analyses, patience and confirmation may provide a more disciplined approach than attempting to anticipate the next move. Investors may prefer to wait for stronger buyer participation and improved trend alignment on lower timeframes. One commonly monitored signal is the 200-period moving average shifting beneath current price action, which may indicate strengthening momentum and increasing buyer control.
From a fundamental perspective, several areas may deserve ongoing attention:
• Revenue growth trends and sensitivity to precious-metals prices
• Operating cash-flow generation and earnings quality
• Free Cash Flow to Firm (FCFF) and Free Cash Flow to Equity (FCFE)
• Growth or decline in Earnings Per Share (EPS) over multiple business cycles
• Capital allocation discipline and balance-sheet strength
• Diversification and quality of streaming agreements
Investors may also evaluate whether:
• Revenue growth is translating into sustainable earnings growth
• Cash-flow generation is supporting shareholder value creation
• Operating costs remain controlled relative to industry peers
• Long-term contracts continue to provide competitive advantages
To estimate a reasonable intrinsic value range, fundamental tools such as Discounted Cash Flow (DCF) analysis, Dividend Discount Models (DDM), Gordon Growth Model (GGM), and cash-flow-based valuation frameworks may complement technical analysis and improve investment decision-making.
While the long-term outlook appears constructive, disciplined risk management, portfolio allocation limits, and confirmation-based entries remain essential. Technical analysis may assist with timing, while fundamental analysis helps determine whether the underlying business justifies long-term capital commitment.
This analysis reflects a personal interpretation of market structure and publicly available information. It is intended solely for educational and informational purposes and should not be considered financial advice or a recommendation to buy or sell any security. Independent research, valuation analysis, and prudent risk management remain essential before making any investment decision.
 Long
Long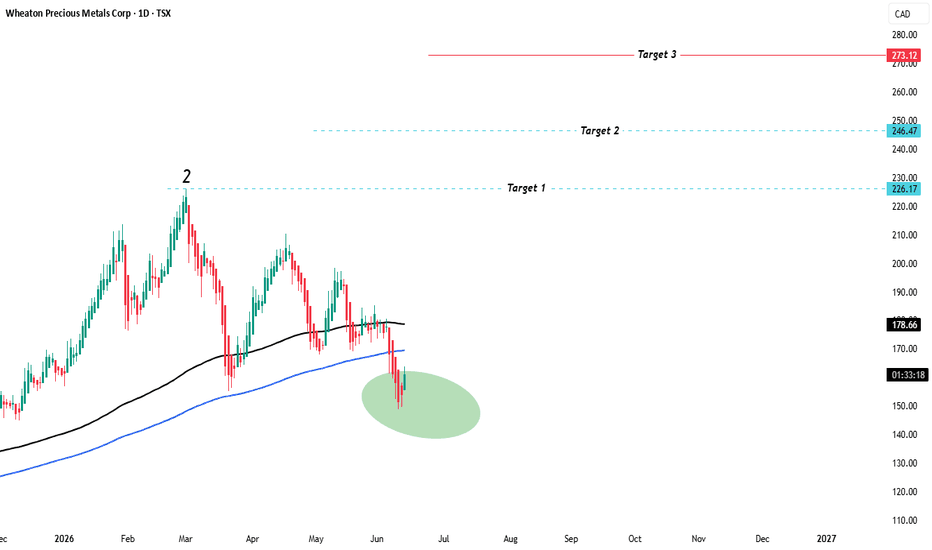
Your not late to this party! on the guest list? 157xThis was my pick for 2025 — and I was early.
I feel a little like Homer Simpson. He gets things wrong, but he has a good heart, means well and has certainly stood the test of time. Most episodes work out in the end, usually with a little help from family and friends, and he always goes home with the right girl.
But boy, can she misbehave!
That’s trading.
I was convinced this one would eventually move with the other commodities, and I still believe the bigger picture is compelling.
Just look at the move that began in 2002 — around 156,000% at its peak.
Read that again.
There are still people out there who participated in that rally and remember exactly what this stock is capable of. If the conditions line up again, perhaps they’ll be ready to put it back into “eat, sleep, repeat” mode.
The macro backdrop is becoming increasingly interesting too.
Oil and gas are moving higher, AI is creating enormous demand for electricity, and nuclear power is becoming an increasingly sensible part of the energy conversation. This stock looks well positioned if that theme really takes off.
At the same time, the yearly trading triangles are coiled up beautifully. We’re getting closer and closer to that apex.
We’re also seeing billionaires and major technology companies increasingly focused on securing long-term energy supplies. Nobody wants to be left out in the cold as the demand for power accelerates.
Trump has been highly critical of wind turbines — the “bald eagle shredders” — while scaling solar brings its own challenges, from thermal events to its significant demand for silver. If silver becomes considerably more expensive, those economics become even more interesting.
Against that backdrop, uranium stocks still feel almost out of season.
And that’s exactly what interests me.
Sometimes you want to be positioned before the season changes.
If the uranium theme really gets going, this could become a long-term slingshot trade. With so much discussion about a new commodity supercycle, imagine if this manages even a fraction of that extraordinary historical move.
We’d all be smiling.
This chart screams bull to me in much the same way XRP did years ago.
I still want diversification, but I keep coming back to Stanley Druckenmiller’s philosophy: concentrate on your best ideas and watch them like a hawk.
After all, copy what works.
Then there’s the question I always come back to:
What is my downside versus my upside?
If the setup fails, I want the chart to tell me I’m wrong before the damage becomes significant. Trading triangles are particularly useful for defining those levels and managing that risk.
But if it isn’t going lower — and, of course, it still may — the potential upside becomes very interesting.
A return towards the previous ATH alone would represent a huge move.
And if the bigger thesis plays out, this is the kind of equity that has the potential to produce a retirement-sized move. If that happens, everyone will be talking about it.
The trick is being on board before they are.
I was early on this one and chose not to cut it. Now we’re approaching that apex, and after digesting that extraordinary historical rise, perhaps she’s getting close to being seriously mispriced again.
There’s also another possibility: she may still be building a much larger macro triangle before eventually making a run towards that long-term $74 target.
We’re around $1 at the moment.
How many opportunities do you find where the chart presents theoretical upside of that magnitude — potentially 150x depending on when you jump on board — while the underlying physics of the energy story may also be working in your favour?
That doesn’t mean it gets there. A target is a target, not a promise.
But this stock has a history of making extraordinary moves.
And history has a funny habit of rhyming.
For now, we’re approaching the apex.
Let’s see which way she breaks.  Long
Long
Shopify’s Pullback Holds Above Key Trend SupportSHOP is seeing buying interest following a retracement after breaking above the $187 level from a consolidation base. The stock remains in an uptrend, trading above both the 20-day and 50-day moving averages, which supports the prevailing bullish trend.
Shopify, Inc. is a $275bn market-cap global commerce company providing infrastructure and tools that enable businesses to start, scale, market, and operate across online and physical sales channels. Its integrated platform supports storefronts, payments, inventory and order management, fulfillment, customer relationships, analytics, financing, and other essential commerce functions through a single platform.
SHOP is a Narrow Moat company with revenue growth in each of the last three quarters and EPS growth in two of the last three quarters, with recent growth of 34% and 66%, respectively. Operating and net margins stand at 18% and 42%, while ROE and ROIC are 16% and 15%. The company also maintains a strong balance sheet, with current and debt-to-equity ratios of 5.4x and 0.01x.
Revenue and EPS are forecast to grow over the next three quarters, with next-quarter growth estimated at 37% and 40%, respectively. The average analyst target price is approximately $172.46, implying about 13% upside potential. Long 
Current HIVE.TO thoughtsI've been looking more closely at HIVE.TO because several factors are starting to line up at the same time. I don't think this means HIVE is guaranteed to break out or reach $10, but I do think the setup is becoming increasingly interesting.
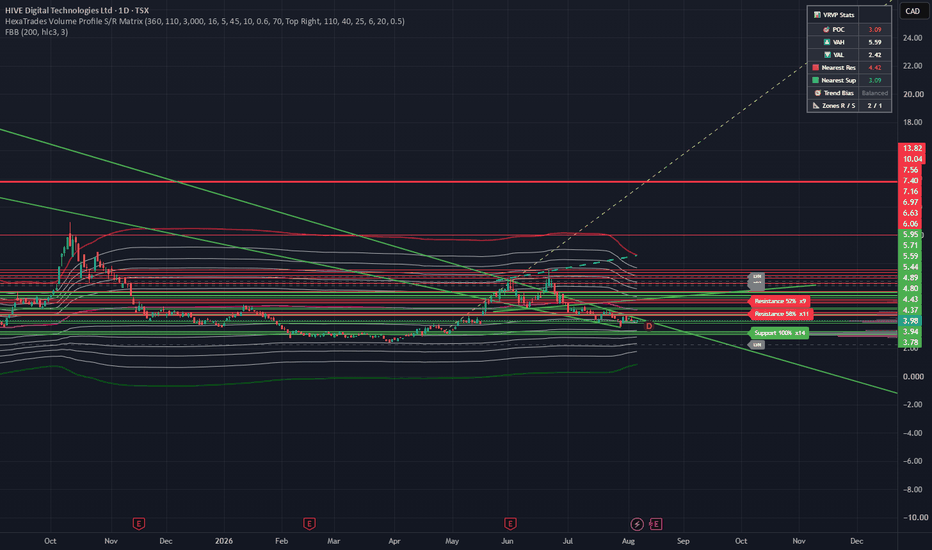
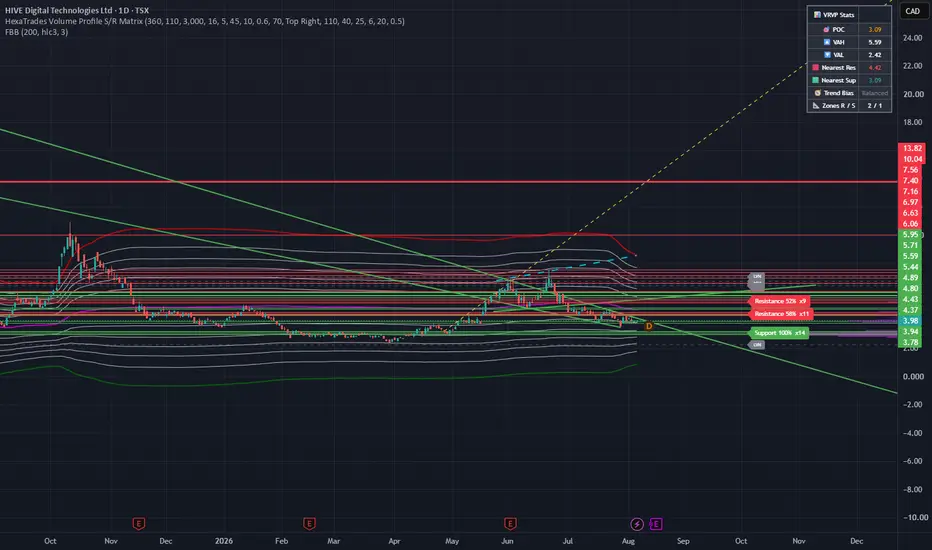
HIVE is currently trading around the **C$4 range**, with a recent high around **C$4.54**. On the technical side, the Bollinger/Fibonacci Bollinger Bands have tightened considerably, suggesting volatility has compressed. That type of compression can precede a large move, although it doesn't predict the direction. For me, the first important confirmation would be a move above the recent **C$4.54 high with strong volume**.
-- The crypto market is adding to the setup
The broader crypto market has recently turned much more constructive. Bitcoin has recovered sharply and has been trading around the **US$80,000 area**, after briefly pushing above that level. Bitcoin also recently posted a very strong weekly gain, while crypto-related equities have been moving higher alongside it.
More importantly, **institutional demand appears to be returning to Bitcoin ETFs**. Investors put approximately **US$2.5 billion into spot Bitcoin ETFs over the seven trading days leading into August 27**, according to Dow Jones Market Data. That was the strongest seven-day inflow period since October.
Another data set shows U.S. spot Bitcoin ETFs recording **eight consecutive days of net inflows**, totaling roughly **US$2.8 billion**.
That doesn't mean Bitcoin can't pull back. In fact, the US$80K area is an important test after such a rapid recovery. But the current combination of Bitcoin strength and renewed ETF demand is a much more supportive environment for Bitcoin miners than a declining crypto market would be.
----- Why that matters for HIVE
HIVE remains heavily exposed to Bitcoin mining, so a stronger Bitcoin environment can potentially improve mining economics and investor sentiment toward the sector.
But HIVE also has another potential growth story through its **AI/HPC infrastructure business**.
The company announced a three-year, approximately **US$220M GPU cloud contract with Bell AI Fabric for Cohere**, involving 2,304 NVIDIA Grace Blackwell GPUs. HIVE also announced a separate **US$350M, five-year AI cloud-services agreement** in August. These contracts don't guarantee profitability or a higher share price, but they give HIVE another potential growth narrative beyond Bitcoin mining.
That leaves HIVE with two major narratives:
**Bitcoin mining + AI/HPC infrastructure.**
If Bitcoin continues higher while HIVE continues expanding its AI/HPC operations, there is potentially a stronger fundamental backdrop for the stock than there would be for a company relying solely on Bitcoin mining.
--- Institutional participation
HIVE had approximately **274.28M shares outstanding as of August 14, 2026** according to its latest SEC filing.
The latest institutional filings show substantial positions from firms including **Invesco, Citadel, Millennium Management and Situational Awareness**, among others.
There is evidence of institutional buying in the available 13F data, but I would be careful about calling it "current accumulation." The filings are delayed, and some institutions may hold HIVE for hedging, options, arbitrage or market-making purposes.
So I view the institutional data as **supportive evidence of significant institutional participation**, rather than proof that institutions are currently buying HIVE because they expect it to reach a particular price.
### The short-interest setup
This is probably the most interesting potential accelerator.
As of the latest official reporting date, **August 14, 2026**, HIVE had approximately:
**59.75M shares sold short**
**21.78% of the reported public float**
**3.36 days to cover**
The short position has increased substantially from approximately **27.65M shares at the end of March** to nearly 60M by August.
That is a meaningful amount of potential short-covering fuel.
If HIVE breaks higher while a large short position remains outstanding, some short sellers may eventually have to buy shares to close their positions. That buying could amplify an already strong move.
However, I would **not call HIVE a confirmed short squeeze**. The latest report actually showed short interest declining slightly from approximately 60.44M to 59.75M shares, and 3.36 days to cover isn't an extreme figure.
Also, the August 14 figure is not today's figure. We don't know exactly how many shorts remain as of August 27. The next official short-interest report will be important.
### Putting the thesis together
What interests me is the combination of several factors:
**Technical compression**
Bollinger/Fibonacci Bollinger Bands are tightening.
**Nearby resistance**
HIVE recently reached approximately **C$4.54**, giving us a clear level to watch.
**Significant short interest**
Nearly **60M shares**, or roughly **22% of reported float**, were short as of August 14.
**Institutional participation**
Large institutions hold substantial reported positions, although the data is delayed.
**Improving crypto environment**
Bitcoin is back around US$80K and spot-Bitcoin ETF inflows have strengthened significantly.
**AI/HPC expansion**
HIVE is building a second potential growth engine alongside Bitcoin mining.
----- What would make me more bullish?
For me, the most important confirmation would be:
**C$4.54 breaks + strong volume + Bitcoin continues holding its recent gains.**
If that happens while the next short-interest report still shows approximately 60M or more shares short, the potential squeeze component becomes considerably more interesting.
I'd then look at the move in stages rather than immediately assuming $10:
**C$4.54:** breakout/confirmation
**C$5–C$6:** first potential momentum zone
**C$6–C$8:** stronger continuation scenario
**C$10:** aggressive bull-case scenario
At approximately C$4.23, C$10 would represent roughly a **136% gain**, or about **2.36× the current price**. I would therefore treat $10 as a potential high-end outcome, not a price prediction.
---- My overall view
My thesis isn't:
**"HIVE is going to $10 because the chart looks good."**
HIVE is developing an interesting setup at the same time that the crypto market is recovering, Bitcoin ETF demand is strengthening, HIVE has significant reported short interest, large institutions have meaningful positions, and the company is expanding its AI/HPC business. If HIVE breaks its recent resistance with strong volume while Bitcoin remains strong and a large short position is still outstanding, those factors could reinforce one another and create a much larger move
For now, I would call HIVE a **high-risk, high-reward setup with several bullish ingredients — but not a confirmed breakout and not a confirmed short squeeze**.
The next things I'm watching are simple:
**Bitcoin's ability to hold the US$80K area.**
**HIVE's ability to break C$4.54 on volume.**
**The next official short-interest report.**
**Continued execution and growth from the AI/HPC business.**
If those pieces line up, I think the HIVE thesis becomes considerably stronger.
NASDAQ:NVDA TSX:HIVE TSX:HIVE
 Long
Long
 Long
Long
 Long
Long
Long 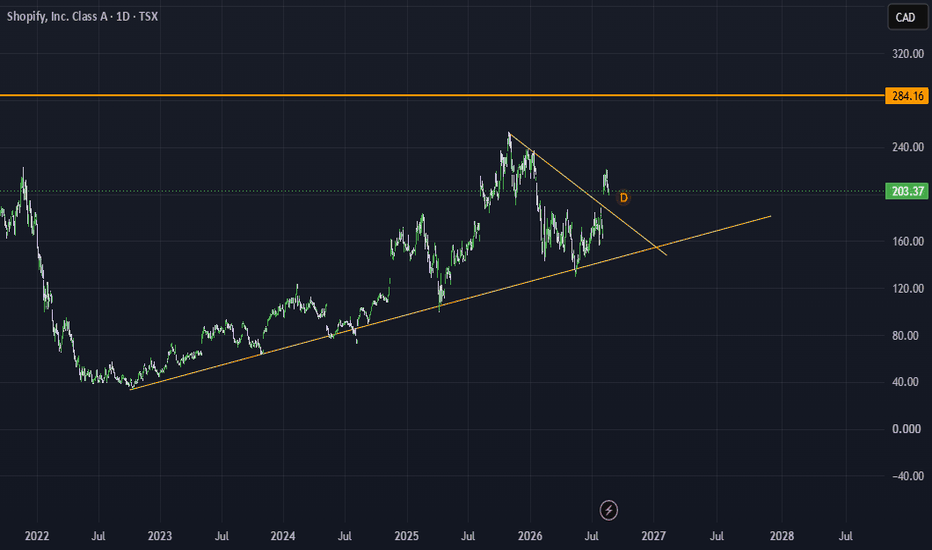
BLACKBERRY TSX MONTHLY (BlackBerry monthly, shows the classic long-term decline from the 2007–2008 peak (~CAD 140+ area). Major horizontal supply roofs sit near ~94, ~35–41, and ~18. A persistent demand floor/green zone is marked around ~4.00–5.00 (with labels “Demandfloor” and “Supplyroof”). A descending green trendline from the mid-2010s highs has been broken or challenged on the recent advance. Price rallied strongly from the ~4 zone, spiked toward/through the ~18 area (and briefly higher), then pulled back sharply—the chart notes a recent ~–5.87 (–32.77%) move, consistent with the July 2026 price action from a local high near ~18.45 CAD down toward ~12. 
In Shavyfxhub terms (market structure + character, demand/supply, liquidity, break-and-retest):
• The multi-year base at the demand floor (~4–5) acted as a strong accumulation zone with repeated reactions.
• The 2026 rally represents a change of character / break of the prior descending structure and intermediate supply.
• The current pullback is testing prior breakout/structure zones (near the ~12–18 band and the broken descending trendline area). Hold above the demand floor keeps the higher-timeframe bullish structure intact; a sustained break back below ~4–5 would reassert the long-term bearish character.
• Key levels to watch for reactions (rejections or break-and-retests): ; higher supply ~35–41 / 94+. Volume and candle closes on the monthly (and lower timeframes) confirm character shifts.
Business model driving the rise since April 2026: BlackBerry is no longer a phone company. It is a software firm focused on two main engines: QNX (real-time embedded OS for automotive, industrial, robotics/medical “physical AI,” and general embedded markets) and Secure Communications (government/enterprise-grade secure messaging, voice, crisis management/AtHoc, digital sovereignty solutions). There is also patent/licensing revenue. 
Key drivers of the 2026 rally (from ~CAD 4–5 / US ~3.8 early year toward peaks near CAD 18+ / US ~13.6):
• Strong Q4 FY2026 and especially Q1 FY2027 results (ended May 2026): revenue ~US$153M (+26% YoY), adjusted EBITDA more than doubled, both segments hitting “Rule of 40,” positive cash flow milestones, raised full-year guidance (revenue ~US$594–621M range).
• QNX strength: embedded in 275M+ vehicles, development licenses at multi-quarter highs (leading indicator for future royalties), ~US$950M royalty backlog earlier, expansion beyond auto into robotics/industrial/medical via partnerships (notably expanded NVIDIA collaboration for edge AI/safety-critical systems).
• Secure Communications: government demand for digital sovereignty, cybersecurity modernization, contracts (e.g., Canadian government expansion), high retention, and recurring revenue.
• Completed turnaround narrative (Cylance sold earlier, focus narrowed, consecutive profitable quarters, cost discipline), share buybacks, and institutional/analyst interest shifting from “meme” to growth/software/AI-adjacent story. 
Will the trajectory continue after the pullback? The fundamental momentum (QNX design wins, physical AI/robotics optionality, government secure-comms tailwinds, improved profitability/cash generation) supports a constructive multi-year case if execution continues and guidance is met. The chart’s higher-timeframe structure remains constructive above the long-term demand floor. However, after a ~130–180%+ YTD surge into elevated valuations (high forward multiples relative to peers/history), profit-taking, volatility, and mean-reversion risk are high—exactly what the July pullback reflects. Continuation higher requires holding key structure (reclaim/hold above intermediate levels, successful retests of broken supply as demand) plus ongoing fundamental delivery. A deeper retest of the demand floor is possible without invalidating the broader turnaround; failure there would reopen downside. This is not financial advice—markets can remain irrational and past performance is no guarantee.
Why the BlackBerry phone and consumer messaging app collapsed: BlackBerry (then RIM) dominated enterprise/mobile email and secure messaging in the early-to-mid 2000s with physical keyboards and its ecosystem. The iPhone (2007) and Android smartphones rapidly shifted the market to touchscreens, rich app ecosystems, consumer media, and developer support. BlackBerry was slow to adapt (late/imperfect touch devices, BlackBerry 10 OS struggles, internal strategy disagreements, over-reliance on keyboard/enterprise strengths). Market share collapsed; by the mid-2010s it was negligible. Hardware was effectively exited by ~2016 (later limited licensing attempts failed to revive it). Classic devices lost network support in 2022 as the company fully pivoted to software. 
Consumer BBM (BlackBerry Messenger) was once highly popular for secure/group messaging. It was licensed out (to Emtek in Indonesia around 2016); the consumer version shut down in 2019 because users migrated to WhatsApp, iMessage, etc., and new-user acquisition failed despite efforts. The enterprise-grade version (BBM Enterprise / secure messaging tools) continued and evolved into part of the Secure Communications portfolio. 
In short: the phone/messaging consumer era ended due to failure to compete in the post-iPhone smartphone platform shift. The surviving business is the software pivot (QNX + secure gov/enterprise tools) that has driven the 2026 re-rating. The monthly chart’s demand-floor base and recent structural break align with that fundamental shift, while the current pullback is a classic post-rally test .
#blackberry  Long
Long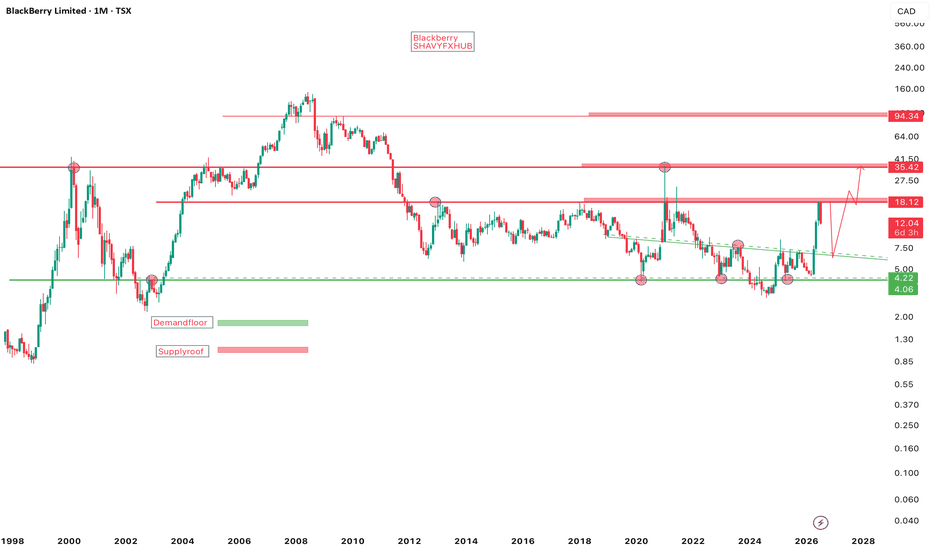
AAPL 4H — Nested Structure or Final Diagonal?🍎 AAPL 4H — Nested Structure or Final Diagonal?
In this update, the main focus is on the current price structure and what the market needs to show to confirm the wave count.
The aggressive scenario is currently focused on a nested structure across two degrees:
1-2 / 1-2
In this interpretation, the current decline could be a three-wave corrective structure. If this decline completes in three waves and price then begins to advance again, that behavior could provide important confirmation of the nested 1-2 / 1-2 structure.
At the same time, the proportion and equality between these two structures could also support the possibility of an Expanded Leading Diagonal.
So for now, there is no need to make a final choice between these possibilities. What matters most is the Price Action and the development of the lower-degree subdivisions.
If we see another decline and that decline develops as a three-wave structure, the 1-2 / 1-2 scenario gains more credibility and could set the stage for a stronger advance of Wave 3.
The conservative scenario follows a different path.
Here, we assume that price is developing an Expanded Ending Diagonal. In this case, the current decline could continue, followed by the final wave of the ending diagonal.
An interesting point is that the appearance of the structure can also depend on the type of chart being used. On the Arithmetic chart, the structure may appear as an Expanded Ending Diagonal, while on the Logarithmic chart, due to the different price scale and Fibonacci relationships, the same movement may look more like a Converging Leading Diagonal.
So for now, we have a roadmap, not a fixed prediction.
Price action, Fibonacci relationships, and the completion of lower-degree waves will tell us which path is actually developing.
For now, I am focusing on the aggressive scenario and allowing the market to reveal the structure on its own. If the structure changes, our wave count must change with it.
This is where the Wave Principle really becomes meaningful:
We don't force the market to follow our count.
We learn to read the structure the market is actually creating.
Patterns whisper… and I listen.
— Mr. Nobody
Apple Inc
yesterday
AAPL: The Final Wave III?
 Long
Long
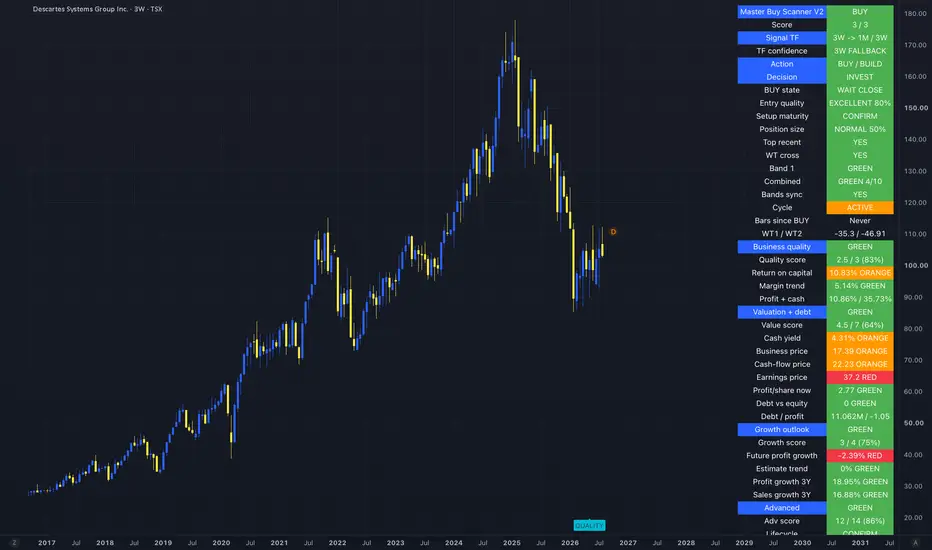
Descartes Systems - Logistics Software Keeps CompoundingLSE:DSG has fallen from roughly C$175 to around C$103, a drawdown of about 40% from its 2025 peak.
What makes Descartes Systems interesting here is that the share-price reset has happened while the underlying business continues to post record revenue, improving margins and strong cash generation.
The Master Buy Scanner V2 has now moved to a 3/3 BUY setup on the 3-week timeframe.
Master Buy Scanner V2 — 3 Week
Score: 3/3
Signal timeframe: 3W → 1M / 3W
Timeframe confidence: 3W FALLBACK
Action: BUY / BUILD
Decision: INVEST
BUY state: WAIT CLOSE
Entry quality: EXCELLENT — 80%
Setup maturity: CONFIRM
Position size: NORMAL 50%
Top recent: YES
WT cross: YES
Band 1: GREEN
Combined: GREEN 4/10
Bands synchronized: YES
Cycle: ACTIVE
WT1 / WT2: -35.32 / -46.91
This is already a fairly mature technical setup.
The WT cross has confirmed from deeply depressed levels, Band 1 is green and the bands are synchronized. The scanner therefore supports building a meaningful position.
The one limitation is the Combined reading at only 4/10, while the signal remains WAIT CLOSE.
So the reversal is developing, but I would still want the current 3-week candle to hold.
The business hasn't stopped compounding
Descartes reported record Q1 FY2027 revenue of $193.6M, +15% YoY.
Even more impressive:
Services revenue: +15%
Operating income: +35%
Net income: +34%
Diluted EPS: +34%
Operating cash flow: +40%
Adjusted EBITDA: +20%
Adjusted EBITDA margin reached 46%, while net income margin increased from 21% to 25%.
That is not a business deteriorating alongside its stock price.
93% recurring-like services revenue
One of the strongest parts of the Descartes model is its revenue mix.
In Q1, $180.5M of the $193.6M total revenue came from services, representing approximately 93% of revenue.
Descartes' Global Logistics Network sits inside highly operational workflows covering:
Transportation management
Customs and trade compliance
Last-mile delivery
Freight visibility
Routing
Carrier connectivity
Shipping and payment
Regulatory processes
These aren't typically products customers casually replace every year.
That embedded network structure is a major reason I view Descartes as more of a logistics infrastructure compounder than a conventional software company.
Margins are moving in the right direction
The scanner gives DSG:
Business quality: GREEN
Quality score: 2.5/3 — 83%
Return on capital: 10.83%
Margin trend: +5.14%
Cash-generation measure: 35.73%
The reported financials reinforce that margin improvement.
Gross margin increased from 76% in Q1 FY2026 to 78%, while adjusted EBITDA margin moved from 45% to 46%. Net income margin expanded four percentage points to 25%.
This matters because Descartes is not merely buying revenue through acquisitions.
Profitability is improving as the platform scales.
AI is being added to an already valuable data network
Descartes has an interesting AI angle because it already owns large amounts of operational logistics data.
Management explicitly describes the Global Logistics Network as providing the real-time data needed to power both existing operational systems and AI-powered solutions.
It is also acquiring AI capabilities rather than relying solely on internal development.
In April, Descartes acquired Idelic, an AI-powered driver safety and performance platform, for approximately $25.3M upfront plus potential earn-outs. Idelic adds predictive driver-risk intelligence to Descartes' routing and fleet-management capabilities.
Then in July, Descartes acquired Drivin for approximately $30M upfront, expanding its AI-powered last-mile capabilities and presence in Latin America.
The thesis here isn't that Descartes suddenly becomes an "AI stock."
It's more attractive than that:
AI can deepen the value of an existing logistics network that customers already depend on.
The balance sheet supports the acquisition machine
Descartes ended Q1 with $377M in cash after generating $75.1M of operating cash flow.
During the same quarter it spent roughly:
$29.7M on acquisitions
$20.8M repurchasing shares
Only $2.6M on property and equipment
And cash still increased by $20.5M.
That highlights the capital-light nature of the model.
Descartes can simultaneously:
grow organically + acquire niche software businesses + repurchase shares + accumulate cash.
The company has also authorized repurchases of up to roughly 10% of its public float under its current NCIB.
Valuation is better — but this still isn't deep value
The scanner gives valuation 4.5/7:
Cash yield: 4.31% — ORANGE
Business price: 17.39 — ORANGE
Cash-flow price: 22.23 — ORANGE
Earnings price: 37.17 — RED
Profit/share: 2.77 — GREEN
Debt/equity: 0 — GREEN
This is the main reason I wouldn't call DSG a bargain.
Even after a 40% correction, investors are still paying a premium for the combination of recurring revenue, margins, balance-sheet quality and long-term growth.
But that premium looks much more reasonable than it did near the highs.
Growth remains strong
The scanner gives DSG 3/4 on growth:
3Y profit growth: 18.95%
3Y sales growth: 16.88%
Future profit growth: -2.39%
Estimate trend: neutral
Fiscal 2026 provides additional context: revenue increased 12% to $729M, operating income grew 16%, EPS increased 14%, operating cash flow grew 21%, and adjusted EBITDA rose 16%.
Q1 FY2027 then accelerated from those already-solid numbers.
For me, the weaker forward-growth input is therefore something to monitor rather than evidence that the historical compounding engine has already stopped.
Key technical levels
Immediate support: C$100–103
Secondary support: C$90–95
Major support: C$85–90
First resistance: C$110–115
Recovery confirmation: C$120–125
Major resistance: C$135–145
Previous highs: C$170–175
The rebound from approximately C$87 has already started.
A successful 3-week close around current levels, followed by a reclaim of C$110–115, would make the setup considerably stronger.
My classification: COMPOUNDER BUY — BUILD ON CONFIRMATION
What attracts me to DSG is the combination:
3/3 scanner score
80% entry quality
Confirmed WT cross
Synchronized bands
93% services revenue
15% revenue growth
34% EPS growth
40% operating cash-flow growth
Expanding margins
Net-cash balance sheet
Disciplined acquisition strategy
Increasing AI exposure
The main limitation is valuation.
This isn't a distressed stock priced for failure. It's a high-quality compounder whose valuation has finally undergone a meaningful reset.
Current verdict: BUY / BUILD — 50% position, but I want the 3W close to confirm.
What would you do?
A) Start building around C$103
B) Wait for the 3W close
C) Wait for confirmation above C$115
Master Buy Scanner V2:
Not financial advice.  Long
Long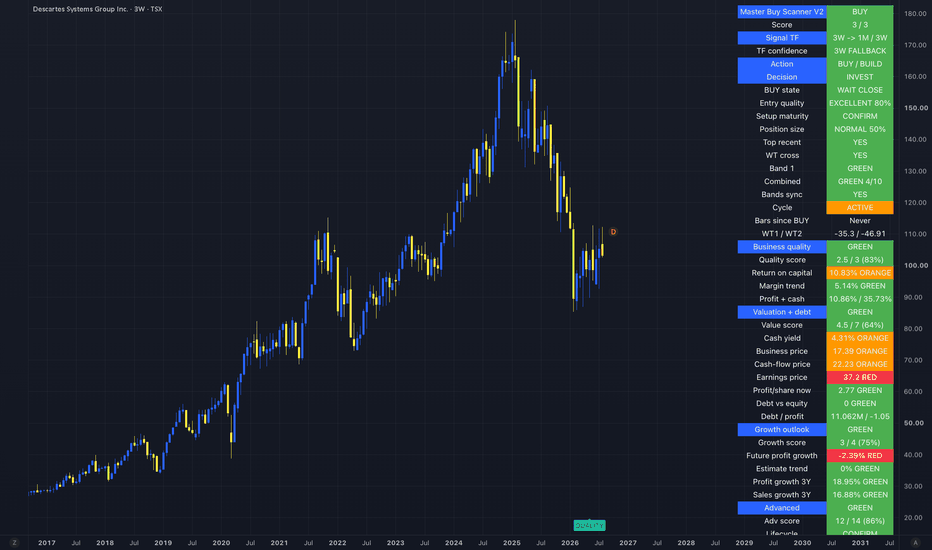
Long