Long
Long
 Long
Long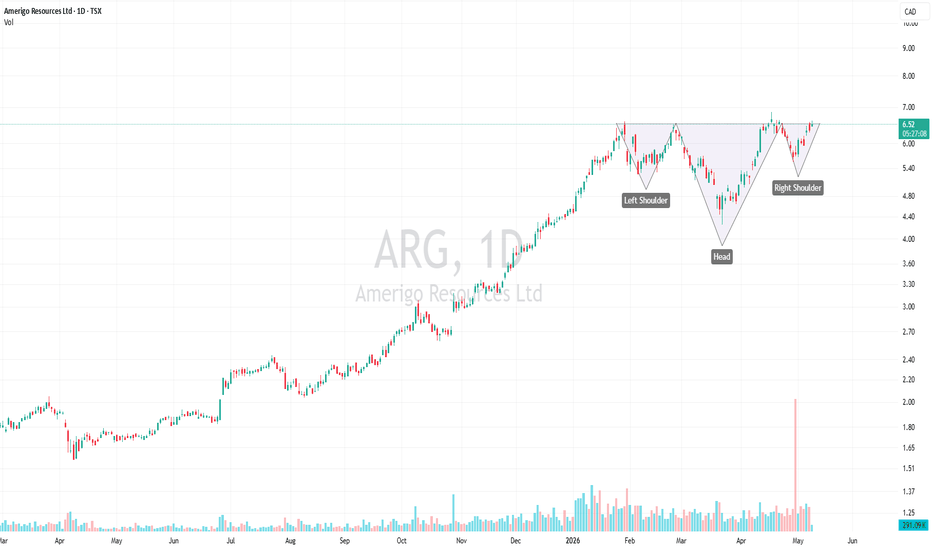
 Short
Short
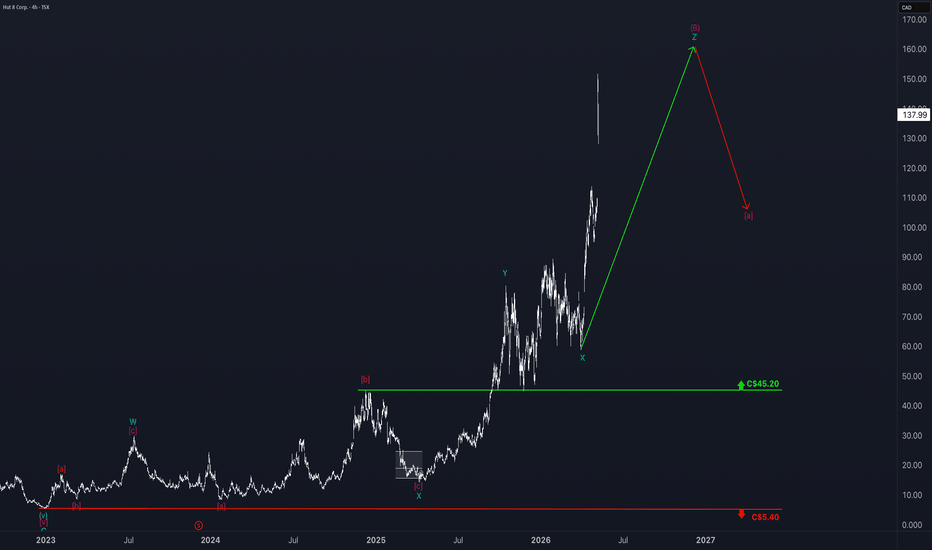
 Long
Long
$CHE.UN - $SOXual bottleneck opportunity.China has just announced a sulphuric acid export halt effective May 2026 — combined with the Strait of Hormuz disruption from the Iran war that's choking sulphur supply.
Sodium nitrite and merchant H₂S are effective monopolies in North America — these are small-volume, high-margin product lines protected by trade duties (sodium nitrite) or process complexity (H₂S). They don't show up in Chemtrade's product disclosures often, but they're disproportionately defensive.
Marathon Petroleum — operates a sulphur recovery unit at Chemtrade's Anacortes, WA facility under a bundled regen acid services agreement.
Vale Canada and Sherritt International — long-term sulphuric acid supply contracts (these are by-product suppliers who also create downstream sales relationships).
Syncrude Canada — Chemtrade processes ammonia scrubber slurry into ammonium sulphate at its Fort McMurray plant for a fee.
Brazilian pulp mills — EC supplies sodium chlorate and chlor-alkali to one of Brazil's largest pulp mills (the Espirito Santo facility's principal sales contract is USD-denominated).
Municipalities across North America — water chemicals revenue is fragmented across many municipal accounts on annual fixed-price bids.
Semiconductor Distribution / PartnershipChemtrade does not have a third-party "distributor" for semiconductor sales — it sells ultrapure sulphuric acid (UPA) directly to semiconductor fabs under multi-year customer-qualification contracts. Two relevant relationships:Kanto Group (KPCT Advanced Chemicals LLC joint venture) — Chemtrade's strategic partner for the semiconductor channel. Kanto Group is a Taiwan-based ultra-high-purity electronics chemicals manufacturer that supplies leading Asian semiconductor producers (think TSMC, Samsung, etc.). Ownership is Kanto 51% / Chemtrade 49%. The JV was formed to build a 100,000 MT/yr UPA plant in Casa Grande, Arizona using Kanto's process technology, but the project has been on hold since 2023 (cost ballooned from US$175–250M to US$300–380M). Kanto is the brand/relationship vehicle that connects Chemtrade's product to Asian-headquartered fabs in North America.Direct sales — Chemtrade's own UPA capacity is at Cairo, Ohio (just completed and in startup) and Tulsa, Oklahoma (recently upgraded). Customer ramp-up runs through 2026 as fabs complete their qualification process. There is no intermediary distributor.
 Long
Long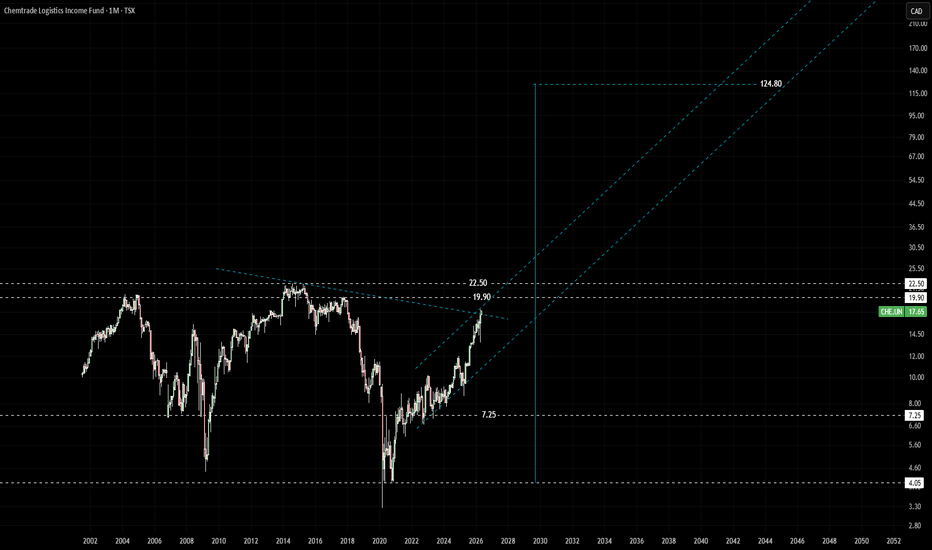
$CIA Reigning in on a ReRate x Pre-operational KamiBear:
Iron ore prices collapse (China slowdown, oversupply). P65 drops to ~US$110/t. DRPF ramp delayed or disappoints. Margin hit to ~22% from high fixed costs. Market de-rates to 5× on sector pessimism.
Base:
Stable demand, P65 ~US$130/t. DRPF successfully commissioned, lifting ~50% of output to 69% Fe premium product. Margins recover to 32%. Market prices in green-steel optionality at 7.5×.
Bull:
Green-steel transition accelerates DRI-grade premiums. P65 surges to US$155/t+. DRPF drives margin expansion to 42%. Multiple re-rates to 10× as CIA commands a scarcity premium for high-grade DR pellet feed.
Q3 FY2026 EBITDA: C$164.7M (up 151% YoY), signaling a strong recovery with the DRPF project ramping
DRPF — Direct Reduction Pellet Feed
📍 Bloom Lake, QC
Jan 2023
✓ Completed
Project study published — $470.7M capex, upgrade ~50% of 15Mtpa capacity to 69% Fe DR pellet feed
Jul 2025
✓ Completed
$387M cumulative invested; mechanical, piping & electrical construction well advanced
Dec 2025
✓ Completed
Mechanical commissioning initiated — $440.5M cumulative invested as at Dec 31, 2025
H1 2026
⬤ Active now
First commercial DR quality iron ore shipments — targeting end of H1/2026. Total capex ~$500M on completion. Customers in Middle East & North Africa being contracted.
H2 2026+
→ Upcoming
Volumes ramp up gradually. Premium pricing over standard 65% Fe expected. Replaces ~7.5Mtpa of standard concentrate with 69% Fe DR pellet feed.
Rana Gruber Acquisition & Integration
📍 Mo i Rana, Norway
Dec 2025
✓ Completed
Cash tender offer announced at NOK 79/share — US$289M equity value. Backed by La Caisse ($100M equity) and Scotiabank ($150M term loan).
Apr 10, 2026
✓ Completed
Acquisition closed. 92.48% shareholder acceptance. Total cost ~US$300M. Compulsory acquisition of remaining ~7.5% underway. Adds 1.8Mtpa of high-purity 65% Fe + magnetite specialty product.
2026
⬤ Active now
Full integration & delist from Euronext Oslo Børs. Optimize product blending with Bloom Lake. Expand European customer base and cross-sell DR pellet feed.
2027+
→ Upcoming
Potential grade upgrade to higher Fe content at Rana Gruber. Operational synergies & best-practice sharing across two continents.
Kami Project (Kamistiatusset)
📍 21km SE of Bloom Lake, NL
Jul 2025
✓ Completed
Framework agreement signed with Nippon Steel & Sojitz. Champion holds 51% in Kami Iron Mine Partnership; Nippon Steel and Sojitz hold the remainder.
Q3 2025
✓ Completed
Environmental Impact Statement submitted to Government of Newfoundland & Labrador. Partnership formalized with strategic capital contributions from Nippon Steel & Sojitz.
Now
⬤ Active now
Definitive Feasibility Study (DFS) in progress — expected completion by end of calendar 2026.
End 2026
→ Upcoming
DFS completion — will determine construction decision, capex, production profile, and whether Kami can produce DR-grade product like Bloom Lake.
2028–30?
◌ Future
Potential construction decision (subject to DFS, permitting, market conditions). Leverages existing Labrador Trough infrastructure near Bloom Lake.
Cluster II Exploration Portfolio
📍 Labrador Trough, QC
Ongoing
◌ Future
Portfolio of exploration properties within 60km south of Bloom Lake. Early stage — no defined timeline yet. Provides long-term optionality in the Labrador Trough.  Long
Long
 Long
Long
AWX - Breakout from Multi-Year Cup & Handle + JV Deal with FCXArcWest Exploration (TSXV: AWX) just broke out of a 7-year cup & handle formation, hitting C$0.21 with record weekly volume (1.53M).
📉 Long-term downtrend decisively broken
📊 12W SMA (0.114) > 36W SMA (0.098)
☁️ Weekly Ichimoku turns bullish
🔻 Pullback to C$0.185 (-7.5%) may offer entry
🔎 Next resistance zone: C$0.30+
Fundamental trigger:
ArcWest Exploration is a project generator focused on porphyry copper-gold systems in British Columbia, operating under a JV-based model. The company currently has eight 100%-owned projects, several of which are already partnered with major producers.
The recent breakout follows the announcement of a joint venture agreement with Freeport-McMoRan on the Eagle project, where Freeport can earn up to 80% interest by spending C$35M over 10 years, including staged cash payments and a commitment to fund exploration.
This deal marks ArcWest's second major JV partnership, alongside Teck Resources (on the Oxide Peak project), further validating the quality of its portfolio. Both Freeport and Teck are known for targeting large, long-life copper assets, which adds strong institutional backing and long-term exploration potential.
The alignment of technical breakout + institutional interest signals a possible structural re-rating as the market begins to price in multi-asset optionality and tier-1 partnerships.
The chart and fundamentals now align, suggesting multi-year upside potential.
📌 Do your own research before investing!  Long
Long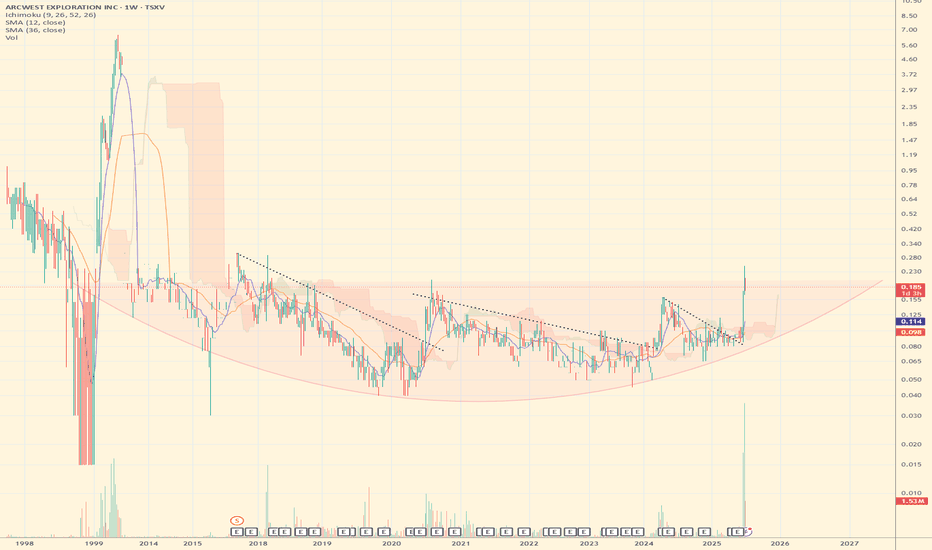
 Long
Long
Early-stage gold system with strong upside potentialArya Resources (TSXV: RBZ) is an early-stage Canadian explorer focused on its flagship Wedge Lake project in Saskatchewan — a gold-dominant system with silver credits, combining high-grade shear-hosted mineralization (T-6 Zone) and bulk-tonnage iron formation-hosted gold (Twin Zone).
Recent drilling is shifting the story from “discovery” to system definition. The newly identified Triplet Zone appears to connect Twin and T-6 at depth, pointing to a potentially large, continuous mineralized system along a ~4 km iron formation corridor. Intercepts show both high-grade zones and broader intervals (2–5 g/t over tens of meters), which is a strong indicator of mineable scale rather than isolated hits. Add consistent silver credits and strong geological analogues (Homestake, Meadowbank), and the thesis becomes much more compelling.
The company is well-funded after a ~$3M raise (with strong demand and controlled dilution), actively drilling, and expecting continuous newsflow (assays + infill drilling). This is a classic early-stage setup where size potential is being proven before a formal resource.
From a technical perspective, the chart aligns with the fundamentals. After breaking out of a 3-year cup-and-handle pattern on unusually high volume, price confirmed the move on the weekly timeframe and has since been consolidating constructively on declining volume — a healthy continuation structure.
The combination of price action, improving fundamentals, and a strengthening geological thesis gives a high probability setup for at least a 2x move, while the measured move projects a target around $3.00 per share, implying a potential 5-bagger if the system thesis continues to validate.
Still early, still risky — but this is exactly where asymmetric opportunities are formed.  Long
Long
LVMH: A Wonderful Business That May Already Be Fully PricedExecutive Summary:
Margin of Safety Verdict: Based on current valuation ranges and roughly €11 billion in annual free cash flow, LVMH appears to offer little or no margin of safety today. It remains a remarkable franchise, but the stock price seems to assume a favorable future.
LVMH is arguably the most powerful luxury conglomerate ever assembled. Its portfolio includes Louis Vuitton, Dior, Tiffany, Moët & Chandon, Bulgari, Sephora and dozens of other iconic maisons. What these brands possess is something rare in capitalism: cultural meaning. Customers are not simply buying handbags or jewelry. They are buying identity, heritage and status.
Financially, the company is formidable. The group generated roughly €80.8 billion in revenue in 2025 and more than €11 billion in free cash flow. Operating margins remain around 22 percent, and leverage is modest with debt below one times EBITDA.
Still, valuation ultimately drives long‑term investment returns. With a market capitalization around €321 billion and an implied free cash flow yield near 3 to 4 percent, investors are paying a steep price for this quality. At the same time, the luxury sector has begun settling back to more normal conditions following the extraordinary post‑pandemic surge.
For long‑term value investors, the real question is not whether LVMH is a great company. That is difficult to dispute. The question is whether the current price leaves enough room for mistakes or slower growth. On that point, the evidence suggests caution.
One Stock, Dozens of Voices:
This is not one analyst's opinion. CrowdWisdom aggregated 23 independent sources for LVMH (20 financial research articles (web); 1 live market intelligence feeds; 1 prior CrowdWisdom analysis snapshots (internal archive); 1 verified financial data checks (Yahoo Finance)) and synthesized the shared thesis: what do dozens of traders, investors, and researchers broadly agree on, where do they disagree, and what might the market be missing?
The conclusions were then stress‑tested by weighing opposing perspectives: a bull case, a bear case that challenges the prevailing view, and an assessment of what expectations appear embedded in the current price. All financial metrics were cross‑checked against live market data.
The result is a clearer picture of where investor opinion converges, where it splits, and whether the stock offers any meaningful margin of safety at current levels.
Business Quality and Moat Durability:
The defining advantage of LVMH lies in its brand equity. Most consumer businesses compete on price, convenience or distribution. Luxury houses compete on perception, heritage and prestige.
Louis Vuitton and Dior have built decades of cultural capital. Their logos signal wealth, craftsmanship and exclusivity. That kind of reputation cannot be replicated quickly, if at all.
LVMH strengthens this brand advantage through several structural advantages.
The first is portfolio scale. With roughly 75 maisons spanning fashion, cosmetics, watches, jewelry, wines and spirits, and retailing, the company functions as a diversified luxury ecosystem. Weakness in one category rarely threatens the entire group.
The second is vertical distribution control. LVMH owns much of its retail footprint, operating more than six thousand stores globally. This direct‑to‑consumer approach protects pricing power and ensures the brand experience is tightly controlled.
The third advantage is marketing and creative scale. The group can invest heavily in designers, global advertising campaigns and celebrity partnerships. Smaller luxury brands simply cannot match that level of investment.
Even so, the moat appears stable rather than widening. Luxury demand has cooled after the pandemic boom, and some segments, particularly wines and spirits, have weakened. The core brands remain exceptionally strong, but industry growth has clearly moderated.
Return on Invested Capital (ROIC):
Precise ROIC figures are not consistently disclosed in available public summaries, which limits precise analysis. However, the economics of luxury brands have historically produced extremely high returns on invested capital.
Once a brand reaches global prestige, additional sales often require relatively little incremental capital. Pricing power and customer loyalty do most of the work.
LVMH’s investment profile, however, is evolving.
Capital expenditures reached roughly €4.57 billion in 2025, equivalent to nearly 20 percent of EBITDA. Much of that spending supports store expansion, real estate developments, and experiential luxury ventures such as Cheval Blanc hotels and Belmond properties.
These investments may deepen brand prestige, but they are also more capital intensive than the traditional luxury model.
If the returns from these projects prove lower than those historically generated by leather goods or jewelry, long‑term ROIC could gradually decline. Revenue might continue to grow, yet each additional euro of invested capital could produce less incremental profit.
Quality of Earnings:
One reassuring feature of LVMH’s financial profile is the close relationship between reported earnings and cash generation.
The group generated approximately €11.3 billion in free cash flow in 2025 with a free cash flow margin near 13.9 percent. Net profit attributable to shareholders was about €10.9 billion, suggesting accounting profits track the underlying economics fairly closely.
That alignment points to strong earnings quality. There is little sign of aggressive accounting practices or unusual working capital manipulation.
That said, sustained high capital expenditures could slow free cash flow growth. Greater investment in retail expansion, real estate and hospitality may gradually reduce the cash conversion rates that once made luxury companies especially attractive.
Capital Allocation Scorecard:
Few executives in modern capitalism have demonstrated the capital allocation discipline of Bernard Arnault.
Several elements of LVMH’s capital strategy stand out.
Acquisitions
The Tiffany acquisition significantly strengthened LVMH’s jewelry division. Renovated flagship stores and refreshed product lines have helped revive the brand’s growth trajectory.
Shareholder Returns
LVMH pays an annual dividend of roughly €10 per share and maintains an ongoing share buyback program estimated at €5 to €6 billion.
Balance Sheet Discipline
Net financial debt stands near €9.2 billion, resulting in leverage below one times EBITDA. This conservative balance sheet leaves the company with considerable strategic flexibility.
Overall, management’s record on capital allocation is strong. Even so, investors should watch whether newer investments in hospitality and experiential luxury ultimately deliver returns comparable to LVMH’s traditional brand businesses.
Customer and Revenue Concentration:
LVMH does not face traditional customer concentration risk. Revenue comes from millions of consumers around the world rather than a small number of clients.
However, there is meaningful concentration within certain consumer groups and regions.
Chinese consumers represent roughly 20 to 30 percent of global luxury spending, and Asia accounts for about 30 percent of LVMH’s revenue.
That exposure ties the company’s performance closely to Chinese economic conditions. Weak property markets, youth unemployment or policy pressure on conspicuous consumption could meaningfully affect demand.
Luxury spending is also closely tied to tourism flows. Cities such as Paris, Milan and Dubai depend heavily on international travelers making high‑margin purchases.
Management Alignment:
Management alignment is unusually strong.
Bernard Arnault and his family control slightly more than 50 percent of the company’s equity and roughly two thirds of voting power. This ownership structure encourages long‑term thinking and decisions that prioritize brand equity over short‑term earnings targets.
Insider behavior supports that alignment. Over the past year insiders reportedly purchased hundreds of millions of euros worth of shares without significant selling.
The main governance question is succession. Arnault remains deeply involved in strategic decisions. Several family members hold senior positions, but the ultimate leadership transition remains uncertain.
10-Year Durability Test:
Luxury brands can endure for generations, but longevity should not be taken for granted.
Several structural forces could shape the next decade.
Cultural relevance is perhaps the most critical factor. Fashion houses must constantly evolve to remain desirable. Losing cultural relevance can quickly weaken pricing power.
Chinese luxury consumption is another key variable. China has become the largest marginal buyer of luxury goods globally. If Chinese demand weakens structurally rather than cyclically, the entire luxury industry would likely grow more slowly.
Consumer preferences may also shift. Younger buyers increasingly spend on experiences such as travel, dining and entertainment rather than physical luxury goods.
At the same time, secondary markets for luxury products are expanding rapidly. Resale platforms could reduce demand for newly produced items if consumers increasingly opt for pre‑owned goods.
None of these trends necessarily threatens LVMH’s survival. But they introduce uncertainties that value investors need to acknowledge.
Multi-Year Thesis (3 to 7 years):
Base Case (Probability 50 percent)
Assumptions:
Revenue grows roughly 4 percent annually
Operating margins stabilize around 20 percent
Free cash flow increases modestly
Estimated intrinsic value: approximately €430 to €500 per share.
Bull Case (Probability 25 percent)
Assumptions:
Chinese luxury demand rebounds strongly
Jewelry and hospitality segments expand
Operating margins remain near 22 percent
Estimated intrinsic value: roughly €650 per share.
Bear Case (Probability 25 percent)
Assumptions:
Luxury demand remains subdued for several years
Margins decline toward 16 percent
Free cash flow stagnates
Estimated intrinsic value: roughly €300 to €350 per share.
Probability-weighted intrinsic value clusters near €450 to €480 per share.
Margin of Safety Verdict:
Recent referenced market prices for LVMH range roughly between €470 and €551 depending on the time of analysis.
Compared with the probability-weighted intrinsic value estimate above, the margin of safety appears minimal or nonexistent.
For disciplined value investors, this becomes a gating issue. Without a discount of at least 20 percent to intrinsic value, the case for buying becomes difficult to justify.
Peak Margin Stress Test:
LVMH currently generates operating margins near 22 percent.
If margins normalized to roughly 16 percent, still an excellent level for a consumer company, operating profit could fall by roughly €4.8 to €5 billion annually based on current revenue levels.
Applying the same valuation multiples to that lower profit base could reduce equity value by roughly 30 to 40 percent.
This illustrates how dependent the current valuation is on margin assumptions.
Valuation Framing:
Different valuation approaches lead to very different conclusions.
Discounted Cash Flow
Optimistic DCF models assuming 5 percent growth produce intrinsic values above €650 per share.
Conservative DCF models using slower growth assumptions estimate intrinsic value closer to €310.
Free Cash Flow Yield
With approximately €11 billion in free cash flow against a market capitalization above €300 billion, the free cash flow yield is roughly 3 to 4 percent.
Relative Multiples
LVMH trades near the low twenties multiple of earnings. Although slightly below some luxury peers, that multiple remains demanding for a cyclical discretionary business.
Overall, the market appears to be pricing in steady margins and an eventual recovery in luxury demand.
Perception vs Reality:
Perception: LVMH is an unstoppable luxury compounder.
Reality: Luxury demand has historically moved in cycles tied to wealth effects and asset prices.
Perception: Brand prestige guarantees indefinite pricing power.
Reality: Pricing power ultimately depends on maintaining cultural relevance.
Why This May Be Misunderstood:
Luxury companies often look less cyclical than they actually are.
During boom periods brands push through aggressive price increases, which expands margins considerably. Investors sometimes assume those peak margins will persist indefinitely.
When the cycle cools, pricing power tends to normalize, which can compress both margins and earnings growth.
Three Measurable Things to Watch Next Quarter:
Fashion and Leather Goods margin trends. This segment generates the majority of LVMH’s operating profit.
Chinese luxury demand indicators including tourism flows and retail sales.
Free cash flow relative to capital expenditures.
Historical Conviction Drift:
Recent developments in the industry suggest investor sentiment toward luxury stocks has weakened.
The sector has lost substantial market value amid geopolitical tensions and slowing consumer demand. Several luxury companies reported softer sales following the post‑pandemic surge.
Internal archive commentary also points to softness in luxury demand linked to geopolitical instability and reduced Middle Eastern spending.
Disconfirming Evidence:
The strongest argument against owning LVMH today is straightforward: valuation.
With roughly €11 billion in annual free cash flow and a valuation exceeding €300 billion, investors are paying a premium price for a cyclical discretionary business.
If the luxury cycle remains weak for several years, returns from current levels could prove mediocre despite the company’s powerful franchise.
Risks:
Chinese luxury demand contraction due to economic slowdown or regulatory pressure
Tariffs or trade restrictions affecting European luxury exports
Brand dilution from excessive product diffusion
Leadership succession uncertainty after Bernard Arnault
Margin compression from currency fluctuations or discounting
Summary:
LVMH represents one of the most powerful consumer franchises ever built. Its brands command global prestige, its margins remain exceptional, and management has historically allocated capital with notable discipline.
But valuation ultimately determines investor outcomes.
At today’s implied free cash flow yield and earnings multiple, the market already assumes durable brand strength, stable margins and long‑term growth in luxury demand.
That outcome may very well materialize. The problem is that the margin of safety appears thin.
For investors who insist on buying businesses at a meaningful discount to intrinsic value, LVMH likely belongs on the watchlist rather than in the portfolio.
Data Snapshot:
Revenue (2025): approximately €80.8 billion
Metric: Value
Current Price (LVMH): N/A
Market Capitalization: N/A
Shares Outstanding: N/A
Trailing P/E: N/A
Forward P/E: N/A
Enterprise Value (EV): N/A
EV/EBITDA: N/A
Revenue (TTM): N/A
Gross Margin: N/A
Operating Margin: N/A
Free Cash Flow (FCF): N/A
FCF Yield: N/A
52-Week Range: N/A
Sector: N/A
Industry: N/A
References:
This analysis reviewed approximately 820 article sources and 0 video transcripts.
1. Yahoo Finance. Louis Vuitton Stock: Undervalued Titan Amid Luxury Market Recovery. finance.yahoo.com
2. Yahoo Finance. Assessing LVMH (ENXTPA:MC) Valuation As Luxury Retail Expansion Continues In Tougher Market Conditions. finance.yahoo.com
3. Yahoo Finance. LVMH: 2025's Macroeconomics Will Likely Provide an Inflection Point. finance.yahoo.com
4. Yahoo Finance. David Herro's Strategic Moves: A Closer Look at Lvmh Moet Hennessy Louis Vuitton SE. finance.yahoo.com
5. Yahoo Finance. Arnault Majority Control And New Asian Leadership Reshape LVMH Investor Focus. finance.yahoo.com
6. Yahoo Finance. A Look At LVMH (ENXTPA:MC) Valuation After Middle East Conflict Hits Luxury Demand. finance.yahoo.com
7. Yahoo Finance. Is It Time To Reassess LVMH Moët Hennessy Louis Vuitton Société. finance.yahoo.com
8. Yahoo Finance. Gucci's Comeback? Kering Just Became Wall Street's Favorite Luxury Stock. finance.yahoo.com
9. Yahoo Finance. Should You Investigate LVMH Moët Hennessy Louis Vuitton S.E. finance.yahoo.com
10. Yahoo Finance. Assessing LVMH Shares After Recent Sector Sentiment Shift and Price Premium in 2025. finance.yahoo.com
11. Yahoo Finance. Chamath Palihapitiya Says Brands Go To Zero As AI Abundance. finance.yahoo.com
12. Yahoo Finance. Europe Luxury Firms Lose $176 Billion As War Hits Demand. finance.yahoo.com
13. Yahoo Finance. Behind glam luxury brands Michael Kors and Jimmy Choo lurks a troubled holding company losing millions. finance.yahoo.com
14. Yahoo Finance. Arnault Raises LVMH Stake to 50.01% as Shares Slide 38%. finance.yahoo.com
15. Forbes. How Brett Johnson Is Building The First Black Ultra-Luxury Brand. www.forbes.com
16. Forbes. How To Buy Into A Billionaire's Portfolio At A Discount. www.forbes.com
17. GuruFocus. LVMH Free Cash Flow Margin Data. www.gurufocus.com
18. MarketScreener. LVMH Financial Ratios and Profitability. www.marketscreener.com
19. LVMH. Letter to Shareholders January 2026. www.lvmh.com
20. LVMH Investor Relations Portal. www.lvmh.com
21. AlphaSpread Insider Trading Database. www.alphaspread.com
22. InsiderScreener Transactions Database. www.insiderscreener.com
23. GuruFocus. LVMH Moat Score Analysis. www.gurufocus.com
24. PortersFiveForce.com. LVMH Competitive Landscape Analysis. portersfiveforce.com
25. AInvest. LVMH Undervalued Luxury Titan Catalysts Turnaround. www.ainvest.com
26. MarketScreener. LVMH Falls on New Tariff Risks and Morgan Stanley Downgrade. www.marketscreener.com
27. Business of Fashion. LVMH Revenues Rise Commentary. www.businessoffashion.com
28. S&P Global Market Intelligence. LVMH Post Earnings Review 2025 Results Beat Forecast. www.spglobal.com
Disclaimer:
This analysis is for informational purposes only and does not constitute investment advice. Investors should conduct independent research and consult qualified financial professionals before making investment decisions.  Long
Long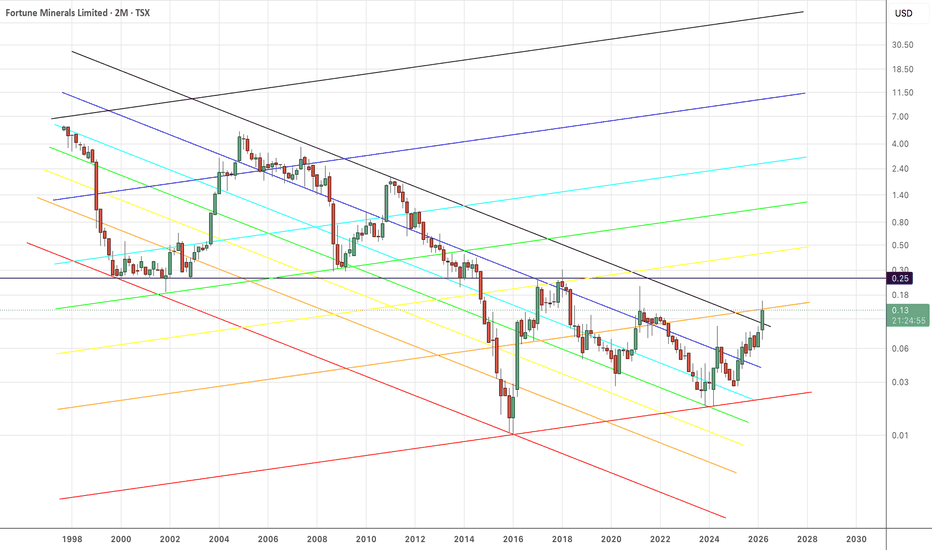
 Long
Long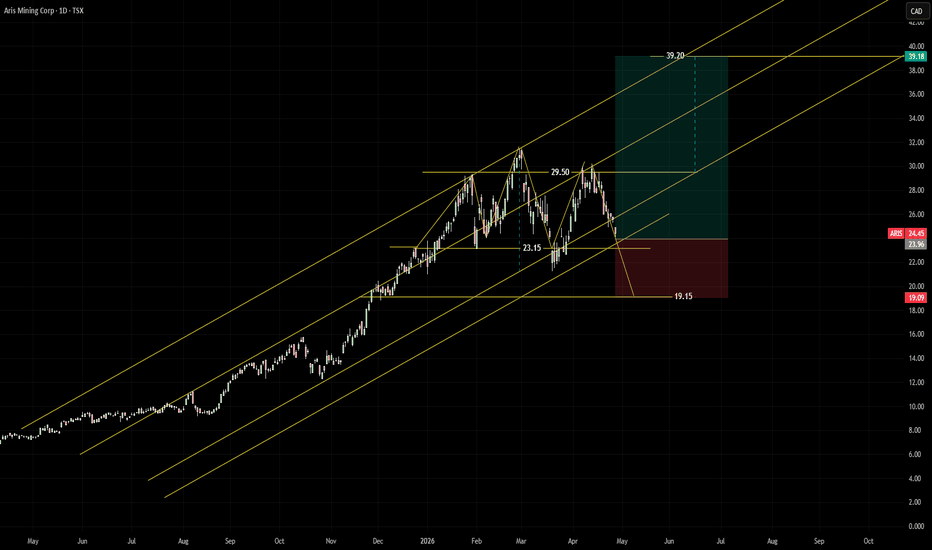
 Long
Long
MDA Space: A High Quality Space Infrastructure Business With an Executive Summary:
MDA Space sits squarely in the middle of a growing global market for space infrastructure. The company has real strengths: strong revenue growth, a sizable backlog, and a long technological track record that traces back to Canada’s early space program. But the economics of the business are still taking shape. Operating margins remain moderate, capital requirements are increasing, and estimates of intrinsic value vary widely. Margin of safety verdict: the stock appears roughly fairly valued near current levels and does not present a clear value opportunity.
One Stock, Dozens of Voices:
This is not one analyst's opinion. CrowdWisdom aggregated 23 independent sources for MDA (20 financial research articles (web); 1 live market intelligence feeds; 1 prior CrowdWisdom analysis snapshots (internal archive); 1 verified financial data checks (Yahoo Finance)) and synthesized the shared thesis: what do dozens of traders, investors, and researchers broadly agree on, where do they disagree, and what might the market be missing?
Those views were then tested against one another. The analysis weighs a bull case, a bear case that challenges the consensus, and a review of what expectations are already embedded in the current share price. All financial metrics were cross validated against live market data.
What follows highlights where opinions converge, where they diverge, and whether the stock offers any meaningful margin of safety at today’s valuation.
Business Quality and Moat Durability:
MDA Space operates across three core segments of the space economy: satellite systems, robotics and space operations, and geospatial intelligence. The company is best known for developing the Canadarm robotic systems used on NASA missions, a legacy that still carries weight across the industry.
Today the business is evolving toward supplying infrastructure for the modern space economy. That includes satellite buses for large constellations, robotics for orbital servicing and future space stations, and geospatial intelligence platforms used by both government agencies and commercial customers.
Several structural advantages support the business.
First is technological heritage. Reliability matters enormously in space hardware. Equipment that has already flown successfully in orbit carries far more credibility than unproven designs.
Second is government procurement entrenchment. Roughly thirty percent of revenue comes from government and defense customers. Aerospace procurement cycles tend to run for years, and qualification barriers are high. Once a contractor becomes embedded in a program, replacing them is often costly and risky.
Third is systems integration expertise. MDA is not just supplying individual components. The company integrates satellite hardware, robotics, software, and ground infrastructure into complete mission systems. Once a program is designed around that architecture, switching suppliers becomes difficult.
That said, the moat should not be overstated. Large aerospace primes such as Airbus Defence and Space, Thales Alenia Space, and Northrop Grumman operate in the same ecosystem with far greater financial resources. At the same time, vertically integrated operators such as SpaceX demonstrate that some satellite companies prefer to build their own systems in house.
Moat durability verdict: STABLE. The company benefits from heritage technology and government relationships, but the competitive environment remains active and evolving.
Return on Invested Capital (ROIC):
The key economic question for MDA is whether returns on capital improve or deteriorate as the business scales.
Historically the company functioned more like an engineering and systems design contractor. Businesses built around engineering expertise often generate respectable returns because intellectual property and design work can be reused across multiple programs without large additional capital investment.
The company is now shifting toward scaled satellite manufacturing and infrastructure deployment. That transition increases capital intensity.
Recent capital expenditures totaled roughly 128 million dollars over the past twelve months, representing around six percent of revenue. Management has indicated that annual capex could remain in the range of 150 million to 200 million as manufacturing capacity expands.
Precise ROIC figures are not available in the verified dataset, which itself highlights a gap for investors trying to evaluate capital efficiency. Without a clear historical ROIC baseline, investors are left to infer how incremental capital may perform.
Two competing scenarios emerge.
In a positive scenario, satellite platforms such as AURORA become standardized products reused across multiple constellations. Engineering costs are spread across larger production volumes, creating operating leverage and improving incremental returns.
In a negative scenario, satellite manufacturing begins to resemble a moderately commoditized aerospace production activity. If that happens, additional capital invested in factories and tooling could generate only mid single digit returns.
At present the direction of ROIC remains uncertain. The company’s shift from engineering services toward scaled production introduces both opportunity and risk.
Quality of Earnings:
At first glance the earnings profile looks healthy.
Revenue growth has exceeded fifty percent year over year in recent periods, and adjusted EBITDA margins near twenty percent indicate solid operating performance for an aerospace contractor.
Free cash flow over the trailing twelve months totals approximately 168 million dollars, representing a margin of roughly fourteen percent.
However, a few caveats are worth noting.
Operating cash flow has been volatile because working capital swings are common in long cycle aerospace contracts. In one recent period operating cash flow declined sharply year over year even while revenue continued to grow strongly.
That pattern is typical in industries where large programs involve milestone payments, extended production timelines, and sizable inventory builds.
The more important long term question is whether free cash flow eventually scales alongside revenue once the current investment cycle stabilizes. If free cash flow continues to fluctuate or remains constrained by high capex, accounting profits may overstate the underlying economics.
Capital Allocation Scorecard:
Management’s capital allocation reflects a company focused on expansion.
Dividends: none. Cash is being reinvested into growth initiatives.
Share repurchases: minimal. In fact, the net buyback yield suggests slight dilution.
Equity issuance: the company recently raised approximately 300 million dollars through an equity offering to fund growth initiatives and acquisitions.
Capital expenditures: increasing significantly as manufacturing capacity and technology development expand.
From a value investor’s standpoint, issuing equity while the stock trades at elevated valuation multiples is not necessarily negative if the new capital earns attractive returns. The challenge is that those returns are still unproven.
Capital allocation verdict: Neutral. Management is clearly prioritizing long term expansion, but the economic payoff from that expansion remains uncertain.
Customer and Revenue Concentration:
The customer base appears reasonably diversified between commercial satellite operators and government space agencies. Approximately seventy percent of revenue comes from commercial customers while around thirty percent comes from government programs.
Even so, aerospace manufacturing often involves significant program concentration.
Individual satellite constellation contracts can reach values in the billions of dollars. With company revenue at roughly two billion dollars annually, a handful of major programs could account for a meaningful share of future revenue.
For example, one constellation contract alone has been reported at around 1.8 billion dollars. If programs of that size are delayed, reduced in scope, or canceled, revenue visibility could deteriorate quickly.
There is also a structural risk that some constellation operators eventually bring satellite manufacturing in house.
Management Alignment:
Insider ownership is relatively modest at roughly one to two percent of outstanding shares. Institutional investors hold a much larger portion, including pension funds and aerospace focused asset managers.
Low insider ownership does not automatically signal poor governance, but it does mean management’s personal financial exposure to the stock is limited compared with founder led companies.
10-Year Durability Test:
Forecasting the economics of a space infrastructure company ten years into the future is inherently difficult.
Several structural forces could strengthen the business.
Global defense spending on space assets is rising as governments increasingly view satellite networks as critical infrastructure for communications, navigation, and surveillance.
Commercial satellite constellations for broadband connectivity and earth observation continue to expand.
New areas such as on orbit servicing, robotic space infrastructure, and satellite life extension could open additional revenue streams.
At the same time, there are credible long term threats.
Vertical integration by major constellation operators could reduce demand for third party satellite manufacturing.
Large aerospace primes with deeper resources could dominate government contracts and push smaller suppliers aside.
Satellite bus technology could become increasingly commoditized as manufacturing scales, compressing margins across the industry.
Because the long term structure of the industry remains unsettled, confidence in predicting the company’s economic position a decade from now is moderate at best. For some investors, that uncertainty may place the stock in the too hard pile.
Multi-Year Thesis (3 to 7 years):
Three plausible scenarios illustrate the range of potential outcomes.
Bear Case Scenario (Probability 25 percent):
Satellite manufacturing competition intensifies while capital expenditures remain elevated. Operating margins decline toward five percent and free cash flow remains inconsistent due to working capital demands. Revenue growth slows as constellation deployments normalize.
Estimated intrinsic value: approximately 16 to 22 dollars per share.
Base Case Scenario (Probability 50 percent):
Backlog converts steadily into revenue and the company secures additional constellation and defense programs. Revenue grows at roughly twelve to fifteen percent annually while operating margins stabilize near ten percent. Capital expenditures gradually normalize after the current expansion phase.
Estimated intrinsic value: approximately 36 to 42 dollars per share.
Bull Case Scenario (Probability 25 percent):
The company's satellite platforms become widely adopted across multiple constellations, creating meaningful operating leverage. Defense spending expands significantly and robotics programs generate new revenue streams. Operating margins expand toward the mid teens.
Estimated intrinsic value: approximately 50 to 55 dollars per share.
Probability weighted intrinsic value estimate: roughly 38 dollars per share.
Margin of Safety Verdict:
With the stock trading around the mid thirties, the market price sits close to the probability weighted intrinsic value estimate.
Optimistic valuation frameworks point to potential upside toward the low fifties, but those estimates depend on sustained high growth and meaningful margin expansion.
More conservative models produce valuations materially below the current share price.
For a disciplined value investor looking for a twenty to thirty percent margin of safety, the current valuation does not provide much protection against execution risk.
Peak Margin Stress Test:
Operating margins are currently near ten percent. That level is not unusually high for aerospace contractors, but it could compress during production ramp ups or periods of competitive pricing pressure.
Consider a scenario where operating margins fall to five percent on roughly 1.6 billion dollars of annual revenue.
Operating profit would decline from approximately 160 million dollars to around 80 million dollars.
If valuation multiples simultaneously revert toward typical aerospace contractor ranges of ten to fifteen times EBITDA, equity value could fall substantially.
In a combined margin compression and multiple normalization scenario, downside of forty to sixty percent is plausible even if revenue continues to grow.
Valuation Framing:
Different valuation approaches highlight how uncertain the investment case remains.
Narrative driven growth models built around strong constellation demand and margin expansion suggest fair value in the range of roughly 50 to 54 dollars per share.
More conservative intrinsic value frameworks produce estimates closer to 36 to 42 dollars.
A pessimistic discounted cash flow approach generates values near 16 dollars.
The wide dispersion reflects the central uncertainty: what level of return on capital a rapidly scaling space infrastructure manufacturer can ultimately achieve.
Perception vs Reality:
Perception: MDA is a high margin technology platform riding the explosive growth of the space economy.
Reality: the company currently looks more like a mid margin aerospace manufacturer investing heavily to expand production.
Why This May Be Misunderstood:
Excitement around the commercial space industry often leads investors to group all space related businesses together as technology platforms with software like margins.
In reality, much of the economic value in space infrastructure still comes from building hardware and executing complex engineering projects.
Historically those activities generate moderate margins and cyclical cash flows rather than the durable economics associated with software businesses.
Three Measurable Things to Watch Next Quarter:
First, backlog growth and the book to bill ratio. Sustained ratios above one would suggest continued demand and strong revenue visibility.
Second, free cash flow conversion relative to revenue growth. Investors should watch whether cash generation improves as the current investment cycle matures.
Third, operating margin stability. Any meaningful deterioration could point to cost overruns or competitive pricing pressure.
Historical Conviction Drift:
Public investor sentiment around the company appears mixed. Institutional interest has increased as space infrastructure becomes a thematic investment area, but social media discussion remains limited.
That pattern suggests the narrative is currently shaped more by institutional research and industry developments than by retail enthusiasm.
Disconfirming Evidence:
The strongest argument against owning the stock is straightforward.
The company may ultimately resemble a traditional aerospace contractor rather than a high return technology platform.
If that turns out to be the case, the current valuation multiple becomes difficult to justify given sub ten percent operating margins and rising capital intensity.
Risks:
Program delays or cancellations affecting large satellite constellation contracts.
Commoditization of satellite bus manufacturing leading to pricing pressure.
Persistent high capital expenditures reducing free cash flow.
Equity dilution from additional capital raises required to fund expansion.
Vertical integration by large constellation operators reducing external demand.
Summary:
MDA Space is a credible participant in the rapidly evolving space infrastructure ecosystem. Its technological heritage, large backlog, and exposure to both defense and commercial satellite markets provide a solid platform for growth.
Ultimately, though, investing comes down to price relative to intrinsic value.
At current levels the market appears to be pricing in a future where the company successfully scales satellite manufacturing while maintaining healthy margins and generating strong free cash flow.
That outcome is certainly possible, but it is far from guaranteed.
For disciplined value investors, the lack of a clear margin of safety makes the stock more interesting as a business to follow than as an obvious investment opportunity today.
Data Snapshot:
Revenue (TTM): Approximately $2.1 billion
Metric: Value
Current Price (MDA): $34.60
Market Capitalization: $4.77 billion
Shares Outstanding: 137,744,029
Trailing P/E: 56.72x
Forward P/E: 29.56x
Enterprise Value (EV): N/A
EV/EBITDA: N/A
Revenue (TTM): $2.10 billion
Gross Margin: 100.00%
Operating Margin: 12.23%
Free Cash Flow (FCF): N/A
FCF Yield: N/A
52-Week Range: $23.23 to $37.45
Sector: Industrials
Industry: Aerospace & Defense
References:
This analysis reviewed approximately 1004 article sources and 132 video transcripts.
1. Yahoo Finance. Is It Too Late To Consider MDA Space (TSX:MDA) After Its Strong 1 Year Rally? finance.yahoo.com
2. Yahoo Finance. MDA Space (TSX:MDA) Valuation Check After Strong Multi Period Share Price Gains. finance.yahoo.com
3. Yahoo Finance. A Look At MDA Space (TSX:MDA) Valuation After Recent Share Price Momentum. finance.yahoo.com
4. Yahoo Finance. MDA Space Ltd Q4 2025 Earnings Call Highlights: Record Revenue Growth and Strategic Contracts Propel Future Prospects. finance.yahoo.com
5. Yahoo Finance. How MDA Space's Hanwha K LEO MoU Has Changed the Story. finance.yahoo.com
6. Yahoo Finance. How Recent Analyst Revisions Are Shaping The Evolving Story For MDA Space. finance.yahoo.com
7. TMX Money. Outlook for MDA Space Stock in 2026. money.tmx.com
8. GuruFocus. MDA Space Ltd Earnings Call Highlights: Record Revenue Growth and Strategic Investments Propel Future Prospects. www.gurufocus.com
9. StockAnalysis. MDA Space Financial Statistics and Valuation Metrics. stockanalysis.com
10. StockAnalysis. MDA Space Balance Sheet and Financial Statistics. stockanalysis.com
11. Simply Wall St. MDA Space Company Overview and Valuation Narrative. simplywall.st
12. The Motley Fool Canada. 2 Superb Canadian Stocks Set to Surge Into 2026. ca.finance.yahoo.com
Disclaimer:
This analysis is for informational purposes only and does not constitute investment advice. Investors should conduct their own due diligence and consider their financial circumstances before making investment decisions.  Long
Long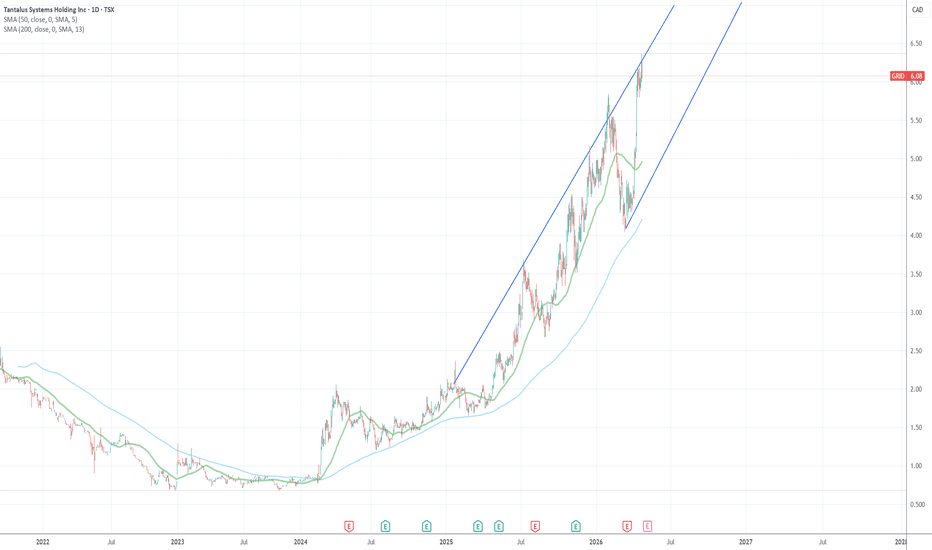
 Long
Long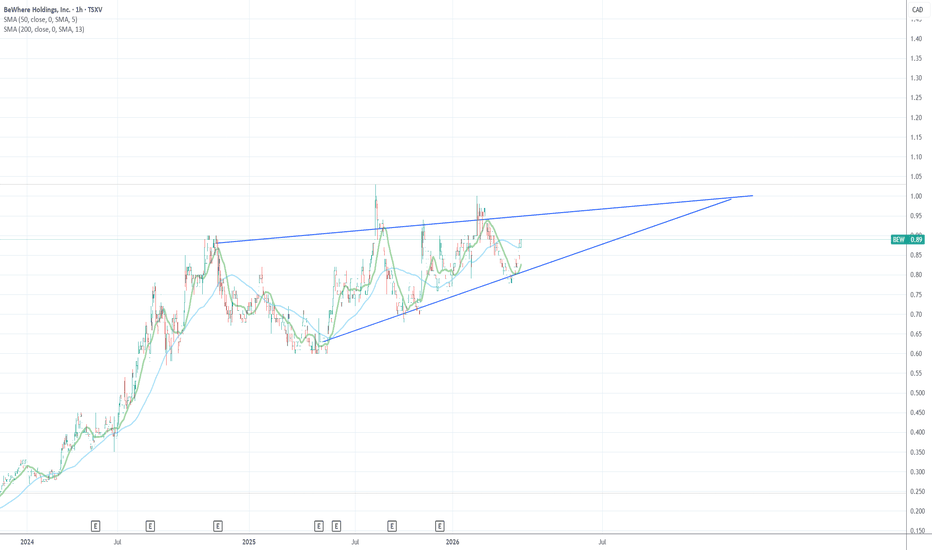
 Long
Long