From Discovery to Definition: Arya’s Next Phase
Arya Resources is currently focused on advancing its Wedge Lake project in Saskatchewan, where recent drilling has confirmed both high-grade gold zones and long, continuous gold-silver mineralization.
The company has identified two distinct systems: a high-grade orogenic gold zone (T-6) and an iron formation–hosted gold-silver zone (Twin), with drilling showing encouraging continuity and scale.
Recent results include wide intercepts, bulk-tonnage envelopes, and silver credits, supporting further resource definition work. A new drilling program is now underway to expand and test these zones at depth and along strike.
In January 2026, Arya raised $1.64M to fund exploration and added an experienced geoscientist with mine development background to its board, strengthening technical oversight and execution capacity.
The company is in the early delineation stage, moving from discovery toward potential resource building, with ongoing catalysts tied to drilling results.
As an early-stage explorer, the stock remains high risk and volatile, but continued technical success could support a re-rating over time.
Technical view:
Price has broken out from a long-term base with strong volume and is now attempting a retest of the former resistance / neckline as support. Structure is shifting to higher highs and higher lows. As long as price holds above the breakout zone, the trend remains constructive. A successful retest would support continuation, with measured-move targets pointing significantly higher over the medium term.
Not financial advice. Do your own research.  Long
Long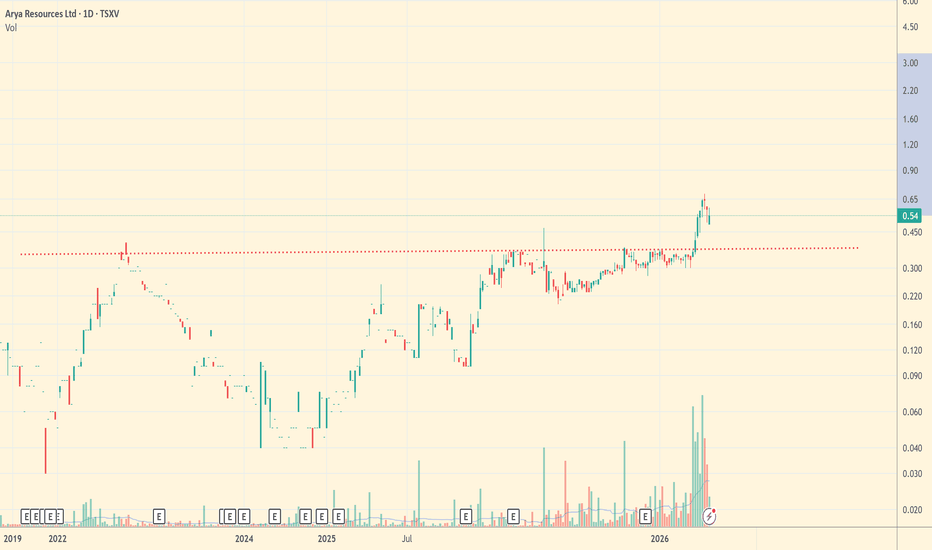
 Long
Long
APGO - Trend Intact, Pullbacks Are Opportunities!In the previous update, we highlighted APGO’s transition out of long-term accumulation and into early markup.
Zooming into the Daily timeframe, now price is doing exactly what strong trends tend to do next: pause, reset, and offer structure-based entries.
📊 Technical Analysis
TSXV:APGO remains inside a rising price channel , confirming that the long-term trend is still bullish.
⚔️The current retracement is unfolding toward a confluence support zone, what I call “TRIO RETEST” , where multiple technical factors align:
- The lower boundary of the rising channel
- The rising EMA , acting as dynamic support
- The $5 round-number , now acting as a key structural level
This area represents a classic trend-following zone , where buyers typically look for continuation opportunities rather than reversals.
As long as price holds above channel support and above the $5 level, the technical bias remains to the upside.📈
🧠 Structure Perspective
In strong trends, price rarely moves vertically.
Pullbacks are part of the process, they reset momentum and reinforce structure before the next impulse.📈
📌 Bottom Line
APGO remains in a bullish technical structure , with the current pullback unfolding as a normal correction within an established uptrend.
From a fundamental standpoint, Apollo Silver is directly leveraged to silver🥈 , a metal at the core of energy transition, AI infrastructure, and defense applications.
With one of the largest undeveloped silver resources in the U.S. , and additional exposure to critical minerals like barite and zinc🗻, the company sits at the intersection of macro demand and strategic supply constraints.🔎
As long as price holds above key structure, the combination of trend alignment and supportive fundamentals keeps the focus on continuation rather than distribution.
⚠️ Always do your own research and speak with your financial advisor before investing.
📚 Stick to your trading plan, entry, risk management, and execution.
All strategies are good; if managed properly.
~ Richard Nasr
Disclaimer: I have been paid $900 by CDMG, funded by Apollo Silver Corp., to disseminate this message.  Long
Long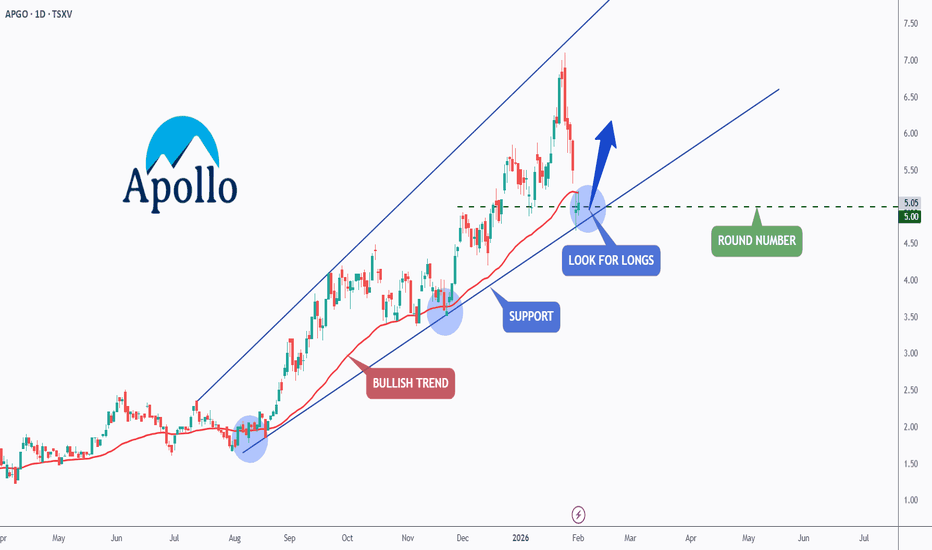
 Long
Long
 Long
Long
 Long
Long
 Long
Long
 Long
Long
 Long
Long
ATZ — Oversold Mean Reversion🏢 Company & Catalyst
Snapshot: Aritzia is a vertically integrated "Everyday Luxury" fashion house, currently aggressively expanding its U.S. footprint (driving ~50%+ of revenue) while maintaining high-margin e-commerce operations.
Why Now: Following a parabolic run-up throughout Fiscal 2026, the stock has triggered a high-volume liquidation event, dropping over 6% in a single session. This "flush" has pushed price into a statistical extreme, activating our proprietary mean reversion signal.
📊 Fundamental & Sector Fit
Valuation/Health: Aritzia trades at a premium valuation (P/E ~38x) compared to the broader TSX Consumer Discretionary sector (avg ~21x), reflecting its status as a high-beta growth vehicle rather than a value play.
Sector Velocity: The Consumer Discretionary sector has been volatile; ATZ is currently acting as a "high beta" lag, flushing harder than the index. This divergence often signals a temporary capitulation rather than a structural break.
Thesis Tie-in: The underlying business remains robust with double-digit revenue growth driven by U.S. expansion. This technical drop represents a valuation reset (shaking out weak hands) within a primary uptrend, not a fundamental deterioration.
📐 Technical Structure (The "Why")
Primary Setup: Mean Reversion / Oversold Bounce. The stock has printed a wide-range bearish candle that extended significantly below the 20-day EMA (orange) and pierced the lower bounds of the volatility bands.
Trend Context: The primary trend remains bullish. Price is correcting but holds well above the rising 200-day SMA (grey line), which acts as the ultimate "line in the sand" for the long-term trend.
Key Indicator Signal: The "Kev Reversion v2.0" indicator has fired a visible LONG tag. This algorithm typically identifies exhaustion points where selling pressure is statistically likely to snap back.
Volume Profile: The setup candle shows a massive volume spike (963K+ shares), confirming "capitulation" behavior—often the precursor to a V-shaped recovery.
Key Levels:
Support: 104.00 – 107.00 (Immediate structural support & psychological zone).
Resistance: 116.00 (Breakdown level / 20EMA) – 124.16 (Gap fill target).
🎯 Execution Plan
Entry Zone: $107.50 – $108.00 (Market entry on the open or limit order at the previous close to capture the immediate snap-back).
Stop Loss: $99.40 (Hard stop placed below the psychological $100 level and the recent swing low structure).
Take Profit: $124.16 (Targeting the liquidity void/gap created by the flush).
Risk/Reward: 1.96R (Risking ~$8.50 to make ~$16.20). Note: Active management required at 116.00 to lock in partial profits.
🧠 Analyst's Bias
The "weak hands" who chased the breakout have been stopped out on this -6% flush. We are taking the contrarian side, buying fear into a primary uptrend. The "LONG" signal combined with the rising 200SMA suggests this is a classic "buy the dip" opportunity before the trend resumes.  Long
Long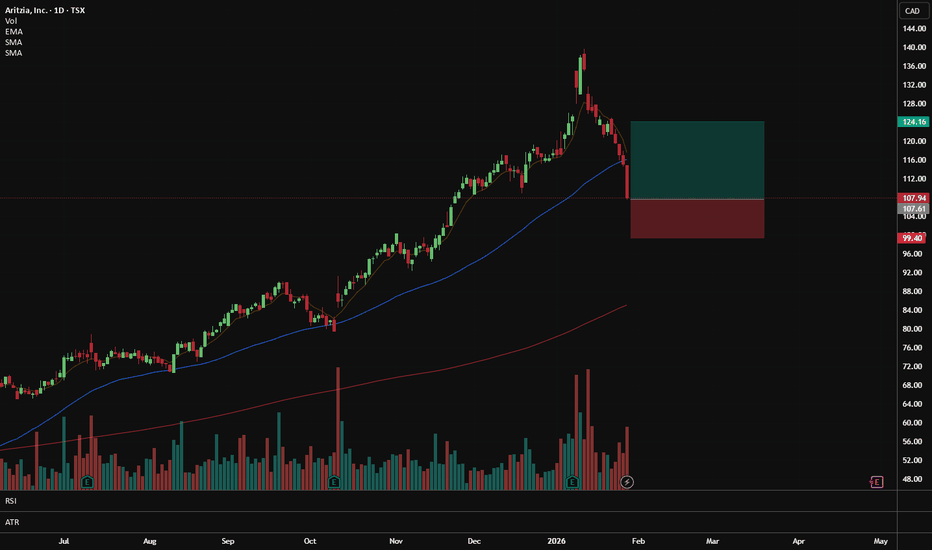
Martinrea International (MRE) - Mean Reversion Swing Trade💰 MRE — Mean Reversion Long (Oversold Reversion)
🏢 Company & Catalyst
Snapshot: Martinrea International is a global automotive supplier specializing in the design, development, and manufacturing of highly engineered, value-added Lightweight Structures and Propulsion Systems.
Why Now: Following a period of distribution near the $10.50 resistance, MRE has flushed into a significant "washout" zone. The stock is currently exhibiting extreme oversold readings on a short-term basis while sitting at a major structural support level (200-day SMA).
📊 Fundamental & Sector Fit
Valuation/Health: MRE remains fundamentally undervalued with a Forward P/E of approximately 4.5x and a Price-to-Book ratio of 0.48, providing a significant "margin of safety" for value-oriented swing traders.
Sector Velocity: The TSX Auto Components industry has faced a -3.7% drag over the last 5 days. MRE is participating in this group-wide flush, which often creates mean-reversion opportunities as the sector-wide selling reaches exhaustion.
Thesis Tie-in: The combination of institutional-grade valuation (deep discount to book) and the current technical "panic" suggests the downside is limited, as long-term value buyers typically step in at these multiples.
📐 Technical Structure (The "Why")
Primary Setup: Mean Reversion Long. The setup is a "double-washout" where price has pierced the lower Bollinger Band while the RSI(2) is deep in the "extreme fear" zone (indicated on the Long Checklist as < 5).
Trend Context: Price is currently testing the 200-day SMA ($9.38). In a healthy bull market, the first deep test of the 200-SMA after a multi-month rally serves as a high-probability "buy the dip" location.
Key Indicator Signal: The "Kev Reversion v2.0" script has triggered a "LONG" signal, confirmed by the RSI(2) < 5 and price trading below the EMA 10 ($10.20).
Volume Profile: Recent candles show "Panic Vol" (confirmed on the checklist), suggesting a climactic liquidation event rather than a systematic trend reversal.
Key Levels:
Support: $9.50 – $9.75 (200-day SMA and previous swing lows).
Resistance: $10.31 (TP 1) – $10.62 (TP 2).
🎯 Execution Plan
Entry Zone: $9.75 – $9.85 (Limit orders near the current cluster and 200-day SMA support).
Stop Loss: $9.58 (Hard stop set just below the recent swing low and the 200-SMA buffer).
Take Profit: $10.31 (Mean reversion target to the 10-period EMA/structural pivot).
Risk/Reward: 2.2R (Targeting $0.50 gain vs. $0.20 risk).  Long
Long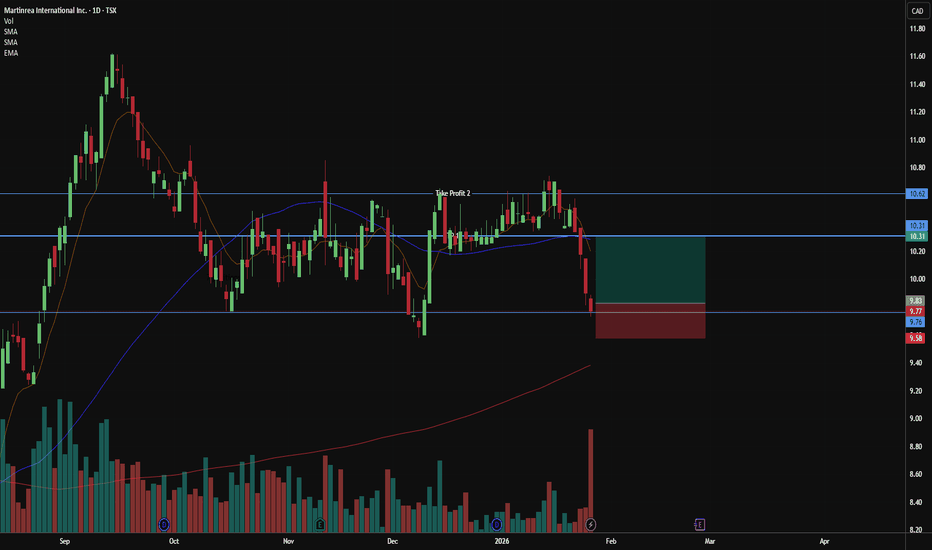
 Long
Long
 Long
Long
 Long
Long
 Long
Long
SM: Poised for Silver Alpha? - A Producer's Growth StorySierra Madre Gold and Silver (TSXV: SM) is shaping up to be a prime candidate for significant upside in a rising silver market. Having recently transitioned to commercial production and achieved positive cash flow in Q1 2025, SM has moved past the riskiest development hurdles and is now firmly in the "Production & Growth" phase of the Lassonde Curve.
Why SM Stands Out for Potential Upside:
- Operational Momentum: In Q1 2025, SM achieved positive cash flow with sales of 165,000 ounces of silver equivalent (AgEq), a critical milestone that validates the Guitarra project's viability.
- Improving Cost Structure: All-in Sustaining Costs (AISC) have been brought down to approximately $29/ounce AgEq. This efficiency directly translates to expanded margins as silver prices climb.
- Exponential Leverage to Silver Price: At a $40/ounce silver price scenario, SM's margin would jump to over $11/ounce AgEq. This significant increase in profitability is a powerful catalyst for share price appreciation, generating robust free cash flow for reinvestment.
- Clear Growth Catalysts: The company has ambitious plans to optimize operations, implement new flotation systems, and expand mill capacity to 1,200-1,500 tonnes per day. This could boost annual production to 2.5-3 million ounces of silver, creating substantial organic growth.
- Supportive Environment: A observed positive shift in the Mexican regulatory environment towards mining further enhances investment appeal.
Technical Analysis Snapshot:
SM's chart shows promising technical signs. After a period of consolidation (akin to a "valley" in the Lassonde Curve), the stock has recently experienced a breakout above a long-term downtrend line, signaling a potential shift from bearish to bullish sentiment. Volume accompanying this breakout is crucial for conviction. The stock appears to be establishing new support levels, indicating a potential accumulation phase. Investors should monitor for sustained trading above key moving averages and continued volume confirmation as indicators of a strengthening trend.
Risk-Reward Profile:
- Risk Profile: Medium to High (as a new, smaller producer with expansion execution risks)
- Potential Return at $40 Ag: Very High (due to dramatic profitability increase and accelerated growth)
Conclusion:
Sierra Madre Gold and Silver is well-positioned to capitalize on a bullish silver market. Its proven production, cost efficiency, and clear expansion roadmap make it a compelling candidate for significant price appreciation as silver prices head towards $40/ounce. For investors seeking "alpha" with a calculated approach to risk, SM offers a compelling growth story.  Long
Long
 Long
Long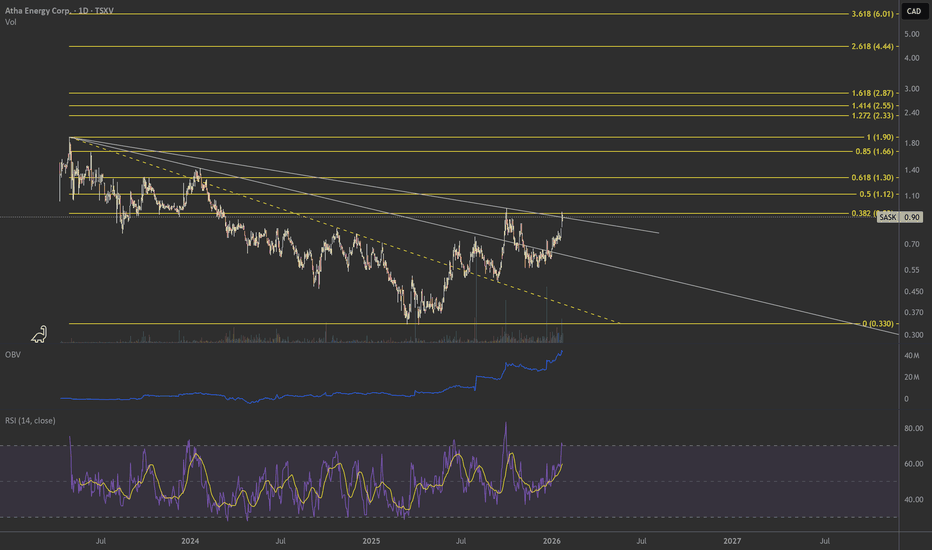
LUN (Canada) - Copper Giant Resetting After A Solid RunLundin Mining has been a powerhouse lately, up roughly 270% since the lows in 2025. Based in Vancouver, this diversified miner produces copper, zinc, gold, and nickel from operations across the globe.
Fundamentally, on Jan 21st 2026 the company just released strong 2025 results, beating their original copper guidance with a record Q4 at their Caserones mine. However, the recent 13% drop seems to be a reaction to their 2026 outlook. While overall production is stable, they flagged lower mining rates at Candelaria for the first half of the year as they bring a mining contract in-house. The market likely used this "softer" start to 2026 as an excuse to take profits after such a massive run. The long-term story remains intact, with production expected to ramp back up in 2027.
Technically, the pullback has been orderly. The stock dropped to the 20-day SMA which has been providing support throughout the run and which is often where institutional support often steps in during strong trends like this one. The RSI has reset from overbought territory but is turning back up, and the price action inside the highlighted circle shows buyers are starting to absorb the selling pressure. Yesterday (Jan 24, 2026) Haywood Securities also raised their price target to $42 from $32 which shows confidence is still there.
Might be worth a watch if it can hold these levels.
..................................................
PLEASE NOTE: Nothing I post is trading advice. All investing involves risk, and past performance doesn’t predict future results. Trends can and do end. For 2026 , my goal is to try and post one new asset each day. Something outside the usual gold, silver, BTC, or big tech names. I like to find stocks worldwide showing steady trends with some good gains, a recent pullback, and signs of renewed strength. I don’t necessarily hold positions in these. They are simply companies I find interesting at the time of posting. I’ll often revisit them within a week to see how they went and share any updates. If you enjoy these posts, please BOOST and FOLLOW ME to discover more under-the-radar stocks and businesses from around the world. .................................................. Trading Idea – Almadex MineralsMarkets price results, but re-rate future optionality.
Almadex is a copper-focused discovery company targeting porphyry Cu-Au systems. It is well capitalized (~C$20M working capital, partly held in gold), owns its drilling capacity, and has not diluted shareholders since 2018. This allows management to wait for high-conviction “fat pitch” drill targets instead of drilling under financial pressure.
The upside is not dependent on a single catalyst. Embedded optionality comes from copper discovery potential, silver and gold-silver projects, and a non-producing royalty portfolio. These factors are largely unpriced today because they relate to future outcomes rather than current cash flow.
Technical view: price broke a 7-year neckline with strong volume in September, followed by a successful retest in November. Current price action shows consolidation, suggesting time-based basing rather than trend failure.
In my view, a 100%+ re-rating is possible even before a major discovery catalyst, as the market begins to price in balance-sheet strength and optionality.
High risk, high reward — with risk concentrated in geology, not in financing.  Long
Long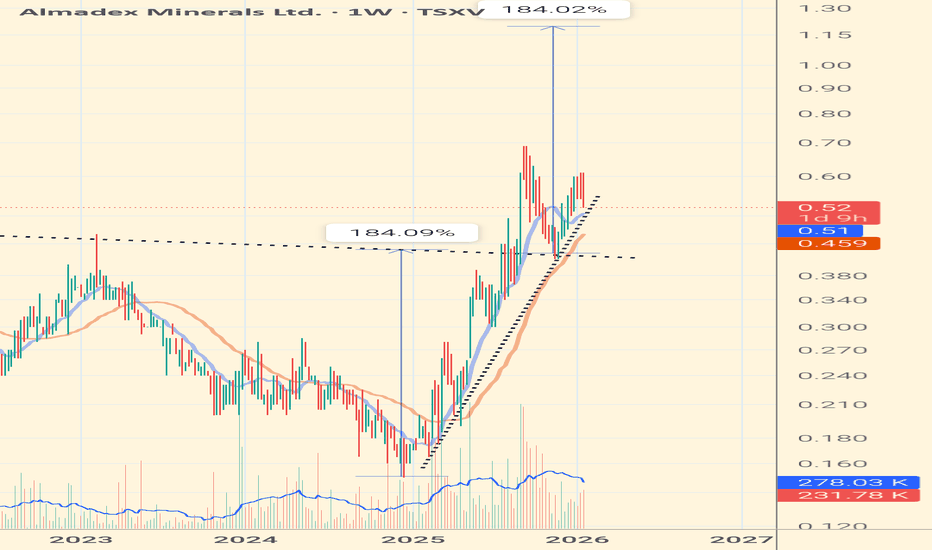
APPL.TO — Swing Trade Idea (TSX)💰 APPL.TO — Swing Trade Idea (TSX)
🏢 Company Snapshot
• Apple Inc. (via TSX-listed CDR) — global consumer tech leader with dominant ecosystem and recurring cash flows
• Matters now: post-earnings drift + sharp pullback into rising long-term trend, setting up a potential mean-reversion swing
📊 Fundamental Context (Trade-Relevant Only)
• Valuation: Premium vs TSX tech peers, justified by margins and ROIC
• Balance Sheet: Net cash position, no solvency concerns
• Cash Flow: Stable to expanding free cash flow
• Dividend: Neutral tailwind, modest but consistent
Fundamental Read: Fundamentals support downside containment, making this a tactical long rather than a valuation bet.
🪙 Industry & Sector Backdrop
• Short-Term (1–4 weeks): Mega-cap tech consolidating after strong Q4 run
• Medium-Term (1–6 months): Still outperforming TSX on relative basis
• Macro Influence: Rates stabilizing → supportive for large-cap growth multiples
Sector Bias: Bullish (medium-term), neutral short-term
📐 Technical Structure (Primary Driver)
• Trend:
– Price above rising 200-SMA
– Recently lost 50-SMA, now extended below it
• Momentum:
– RSI(2) deeply oversold / panic zone
– RSI(14) cooling, not broken
• Pattern:
– Sharp pullback within primary uptrend
– Reversion setup after failed bounce near 50-SMA
• Volume:
– Elevated on selloff → short-term capitulation risk
Key Levels
• Support: 35.40 – 35.00 (current reaction zone)
• Resistance: 38.70 – 39.50 (50-SMA + prior breakdown)
🎯 Trade Plan (Execution-Focused)
• Entry: 35.20 – 35.60
– Oversold extension into trend support; looking for stabilization / reversal candle
• Stop: 33.85
– Clean break below rising 200-SMA = trend failure
• Target: 38.80
– Mean reversion into 50-SMA / prior supply
• Risk-to-Reward: ~2.4R
Alternate Scenario:
If price loses 35.00 on a closing basis, stand aside and reassess near 33.90–34.20 (200-SMA retest). No longs below the 200-SMA.
🧠 Swing Trader’s Bias
Primary trend remains intact despite short-term damage. This is a mean-reversion long, not a breakout. I want to see price hold above the 200-SMA and RSI(2) unwind from extremes. A decisive close below trend support invalidates the setup.  Long
Long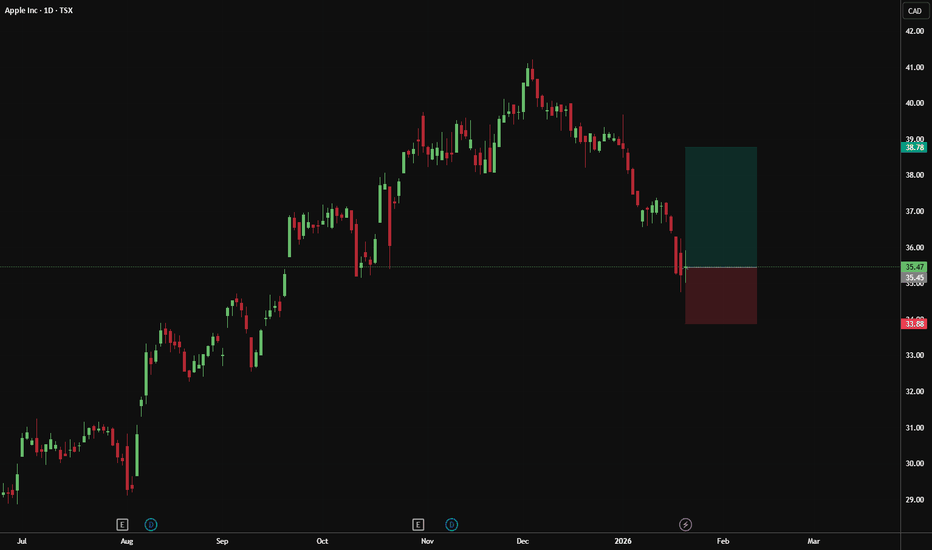
TD (USA) - Canadian Bank Running the Channel.Toronto-Dominion Bank has had a solid run, sitting on a gain of a bit under 60% over the last year. Based in Toronto, this is one of the heavyweights in North American banking. Like all banks, it's not the flashiest stock out there, but the trend has been steady and reliable, which is worth considering in these volatile times.
Fundamentally, things look stable. They just announced they are redeeming $1.25 billion in medium-term notes for 2026, effectively clearing that debt off the books. They also confirmed January distributions for their ETFs. This tells us management is comfortable with their capital structure and focused on financial flexibility. The recent pause in price seems less about specific bad news and more about the recent pull back on the overall market having its impact.
Technically, the chart shows a very clean upward channel. We are currently seeing a pullback into the middle of the channel and the RSI is sitting around 57, so arguably the stock price is at a better value area for technical investors. Obviously you would wait to make sure the trend is going to head back up, but looks good so far and global tensions are easing with Trump softening his language and backing off his Greenland threats in the last 24 hours.
Might be worth a watch if you like these slow and steadies.
..................................................
PLEASE NOTE: Nothing I post is trading advice. All investing involves risk, and past performance doesn’t predict future results. Trends can and do end. For 2026 , my goal is to try and post one new asset each day. Something outside the usual gold, silver, BTC, or big tech names. I like to find stocks worldwide showing steady trends with some good gains, a recent pullback, and signs of renewed strength. I don’t necessarily hold positions in these. They are simply companies I find interesting at the time of posting. I’ll often revisit them within a week to see how they went and share any updates. If you enjoy these posts, please BOOST and FOLLOW ME to discover more under-the-radar stocks and businesses from around the world.
.................................................. F