Long
Long
 Long
Long
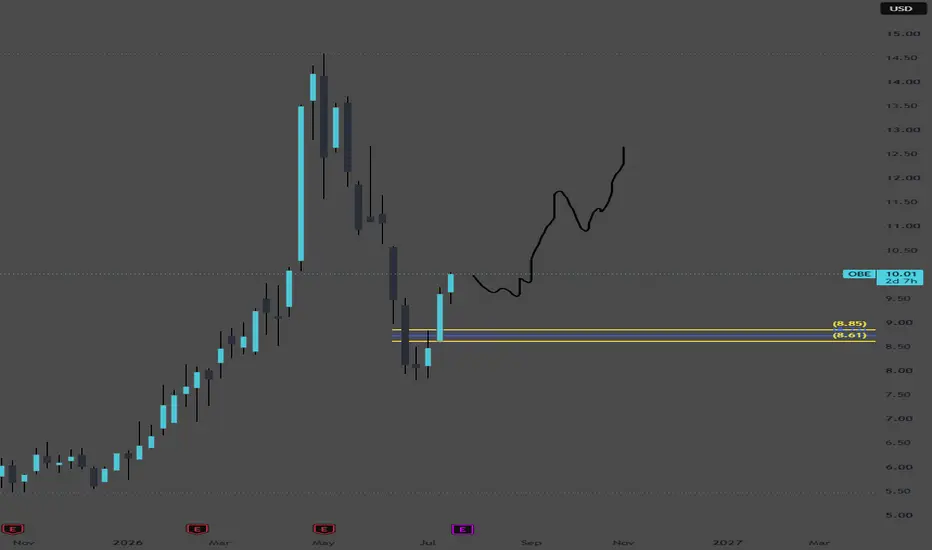
$OBE long thesis Bull Case
1. High operating leverage to oil prices
Every sustained increase in WTI oil prices significantly boosts cash flow.
Most operating costs are relatively fixed, so higher realized prices largely flow to the bottom line.
2. Attractive valuation
OBE has historically traded at lower EV/EBITDA and cash flow multiples than many North American E&P peers.
The market still discounts the company because of its past as Penn West Petroleum, despite a much healthier balance sheet today.
3. Improved balance sheet
Management has focused on debt reduction over the last several years.
Lower leverage reduces financial risk and gives flexibility for acquisitions or shareholder returns.
4. Production growth
Recent acquisitions, including the Belly River transaction, are expected to increase production and extend drilling inventory. Management has also increased production guidance following the acquisition.
5. Capital discipline
Unlike previous commodity cycles, management emphasizes:
returns on invested capital,
free cash flow generation,
disciplined capital spending,
maintaining financial flexibility.
Potential Catalysts
Higher oil prices.
Strong quarterly earnings.
Continued debt reduction.
Share buybacks.
Additional accretive acquisitions.
Reserve upgrades.
Improved analyst sentiment following successful integration of recent assets.
Key Risks
Oil price declines remain the largest risk.
Canadian pipeline constraints and differentials.
Cost inflation.
Integration risk from acquisitions.
Environmental and regulatory changes.
A global recession reducing energy demand.
Valuation Scenario
If WTI remains in the $70–80/bbl range:
Free cash flow could remain robust.
Debt can continue declining.
Investors may award a higher valuation multiple.
If WTI moves above $85/bbl, upside could be substantial due to operating leverage.
Conversely, if WTI falls below $60/bbl for an extended period, earnings and cash flow would likely compress significantly.
Overall View
The investment thesis rests on three pillars:
A stronger company than its historical reputation suggests.
An inexpensive valuation relative to cash-generating capability.
Significant upside from disciplined capital allocation and favorable commodity prices.
The primary downside is that OBE remains fundamentally an oil producer, making returns highly sensitive to crude prices. For investors who are constructive on medium-term oil fundamentals, OBE offers a relatively high-beta way to express that view.  Long
Long
Long 
 Long
Long
 Long
Long
 Long
Long
 Long
Long
 Long
Long
Gold and Silver Price Prediction: Analyst Sees More DownsideGold and silver are both selling off hard today, and one chart strategist says the drop isn’t over yet. Gareth Soloway, chief market strategist at Verified Investing, says rising tensions in the Middle East are pushing the US dollar and interest rates higher, as oil prices climb. Higher oil tends to push inflation expectations up too, which lifts rates further. That combination is putting direct pressure on both metals.
Gold dropped 1.5% on the day, while silver also took a hit.
Gold’s Chart Is Flashing a Warning
Soloway points to a wedge pattern forming on gold’s chart, where price is getting squeezed between a descending resistance line and a rising support line. Each bounce off support has failed to reach the upper resistance trend line, a sign he says shows continued weakness. Gold recently bounced off support near $4,000, and that level is now back in focus.
Below that, Soloway is watching the $3,975 zone as the next line in the sand. A break there, he says, opens the door toward a deeper pullback.
Where Gold’s Correction Could End
Looking at past cycles, Soloway says gold fell 66% from its 1980 peak, then 46% during its 2011 top. Each cycle has produced a shallower drawdown than the one before, tied to rising government debt and ongoing quantitative easing.
Applying that pattern, he expects a roughly 30% to 37% drawdown from gold’s recent high this cycle, which would put the bear market low near the $3,500 level.
A Longer-Term Bull Case Beyond the Pullback
Despite the near-term weakness, Soloway remains bullish on gold’s next multi-year cycle. He said gold’s bear markets have shortened over time, from 30 years following the 1980 peak to 15 years after the 2011 peak. That pattern suggests the next cycle top could arrive within roughly five years.
Based on a model he’s built, Soloway projects gold’s next bull market high could land somewhere around $13,000, though he stresses this is a longer-term projection rather than a near-term target.
Silver’s Setup Looks Similar
Silver is forming what Soloway describes as a bear flag, having broken below key support levels before rejecting a retracement attempt. He’s watching the $58 level closely. A break below that could open a path toward $54, and potentially as low as $50 or $46 if selling accelerates further.
Silver has already dipped close to the $54 to $55 zone, near the upper end of his projected drawdown range, though Soloway says one more leg lower remains possible before a bottom fully forms. Once that downside plays out, he says a break above the descending resistance trend line would mark the start of a bigger move higher for silver.  Short
Short
 Long
Long
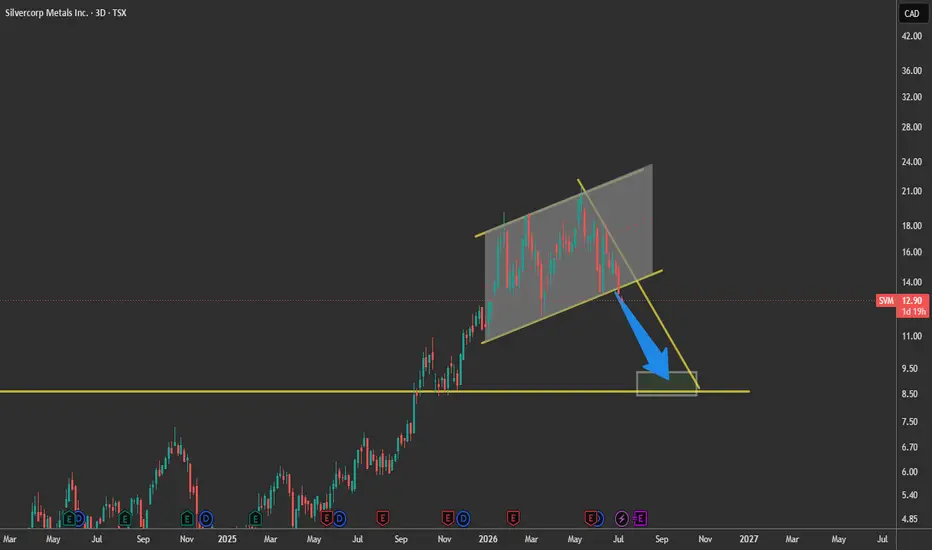
SVM / Silvercorp Metals — 3D Chart: Bullish Structure, Bearish
SVM has had a powerful breakout from its multi-year accumulation/base, but the current 3D structure is showing signs of a meaningful correction after a parabolic advance.
Price rejected from the upper extension region near 16.80–20.77 and is now pulling back into a key decision zone. The larger trend is still structurally bullish, but the short-term swing has turned bearish unless bulls defend support.
The most important level on this chart is the 11.40–11.50 zone.
This area lines up with the 1.0 Fib level, prior breakout structure, and the first major zone where bulls need to step in. If this level holds, SVM may simply be forming a higher-low before continuation. If it fails, the correction can extend much deeper.
Bullish Setup
A long setup becomes interesting if price holds above 11.40–11.50 and forms a strong reversal candle on the 3D chart.
Long Entry Ideas
Conservative long:
Wait for a confirmed 3D reversal candle above 11.40
Better confirmation if price reclaims 15.00
Reload zone:
10.18
9.48
8.40–8.90
If price comes into the 8.40–9.50 region and shows strong demand, that may offer the best risk/reward long setup.
Bullish Targets
15.00
16.80
20.77
A clean 3D close below 11.40 weakens the immediate bullish case and opens the door to a deeper correction.
Bearish Setup
A short setup becomes valid if SVM loses the 11.40 level on a 3D closing basis.
The current top structure resembles a broad distribution / failed continuation after a strong parabolic move. If support breaks, price may continue toward lower fib and prior breakout levels.
My Bias
SVM is not a clean buy here yet. The larger structure remains bullish, but the current 3D swing is bearish.
I would not chase longs in the middle of this pullback. I’d rather wait for either:
A confirmed hold/reversal above 11.40, or
A deeper pullback into 10.18–9.48 / 8.40–8.90 with demand, or
A clean reclaim of 15.00–16.80 for bullish confirmation
Not financial advice. Trade the levels, not the opinion.  Short
Short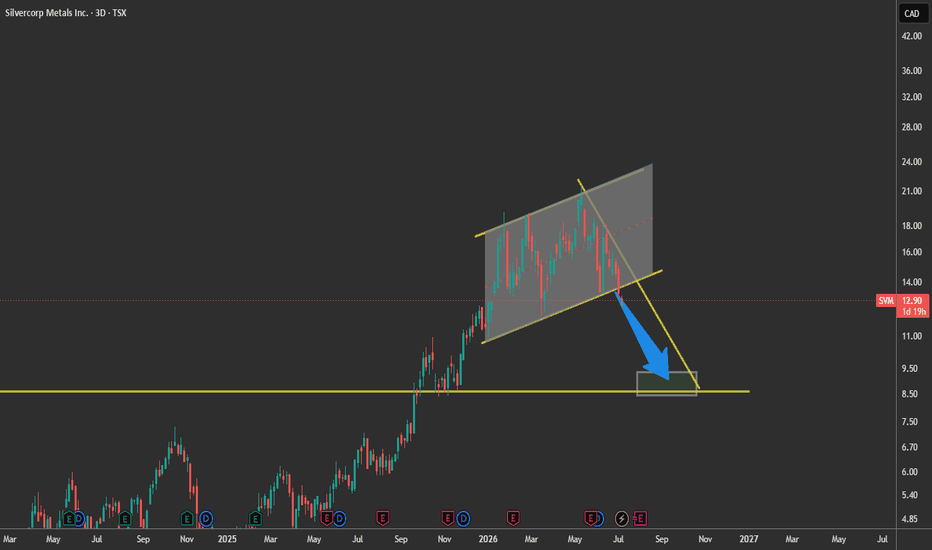
 Short
Short
LONG $ANET - AI Company that Connects $NVDA GPUsI've started buying NYSE:ANET around this level.
One thing I've learned over the years is that when you're investing in a major trend like AI, it's worth looking beyond the companies making the headlines.
Everyone talks about NASDAQ:NVDA because they build the GPUs. But once those GPUs are installed, someone has to connect tens of thousands of them so they can work together efficiently. That's where Arista Networks comes in.
To me, Arista is one of the critical pieces of AI infrastructure.
As I've mentioned in my previous ideas, I'm building a long-term portfolio around robotics and automation. I believe companies like Arista deserve a place in that portfolio because robots, AI clusters, and autonomous systems all depend on fast, reliable communication. Without that network, none of these systems can perform at scale.
If I had to describe Arista in one sentence, it would be this:
Arista builds the nervous system of AI data centers.
Could this pull back from here? Absolutely.
The FOMC meeting is just around the corner, and the market will be paying close attention to the tone of the new Fed Chair. If the market reacts negatively, I wouldn't be surprised to see another pullback.
But that doesn't change my thesis.
I'll continue adding to my position as long as it stays within my planned risk. I'm not trying to pick the exact bottom. I'm simply accumulating a business I believe will play an important role in the next decade of AI.
Like I always said, just manage your risk on this one.  Long
Long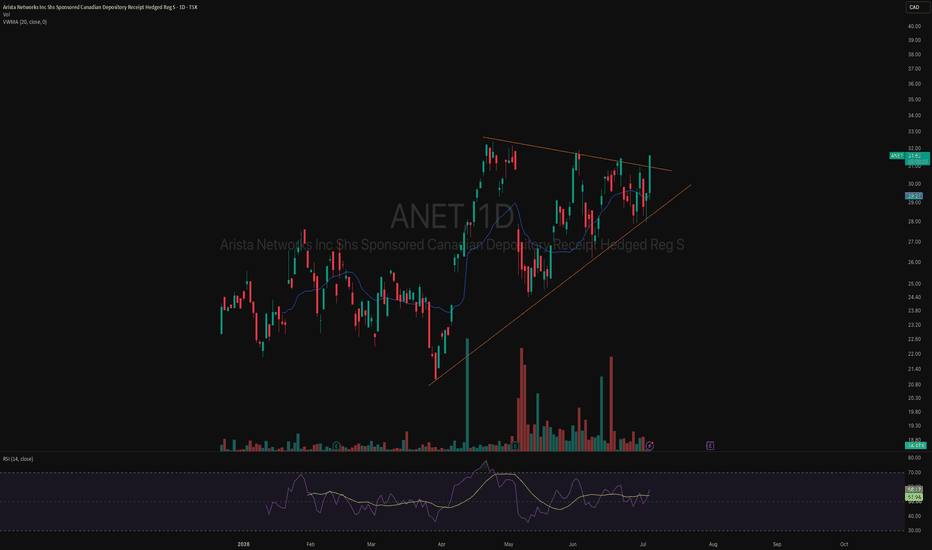
Cronos Group , The Flag, the Flagpole, and a question - July 26SYMBOL: TSX:CRON | DIRECTION: LONG | TIMEFRAME: 23-Day
Published: July 2026
In 2019 Cronos Group was the future of medicine, the future of wellness, and the future of whatever else someone needed it to be that week to justify buying at $30. The stock had risen 14,285% from its 2016 low. A tobacco company invested $1.8 billion. The comments section smelled of ambition and something else entirely. Then the price did what all parabolas do. It corrected. Enthusiastically. For seven years.
What followed has been annotated on the chart with admirable restraint as “The Flag.” Cronos shareholders may have a different word for it. The flagpole, however, measures 14,285%. And the chart then poses the question “Do you know how to measure the glorious profit?” A rhetorical question. Although with cannabis stocks in 2019, nothing was rhetorical.
On the above 23-day chart, RSI is breaking out of a multi-year descending channel for the first time since the 2019 peak. Two observations:
1) RSI breakout. First since 2019. The RSI descending channel that has capped every rally since the peak has just been broken to the upside. On a 23-day chart, that takes time to develop. It has taken seven years. When the momentum structure of a correction this long finally breaks, it is not nothing.
2) Bull divergence Confirmed. signals are stacking at the base. Two Bullish divergence Confirmed prints, both , both at the floor, both arriving as RSI stages its first real recovery. Weak signals at a base are the beginning of the argument, not the conclusion. The RSI breakout is here. The flag structure is here. All three at once is not a coincidence. It is a checklist.
Targets
Not publishing one. The chart has already asked you the question. If you know how to measure a bull flag, you know what the flagpole implies. If you don’t, then don’t guess. Followers will get the answer!
The cannabis sector has spent seven years being comprehensively humiliated. The stocks are uninvestable. The promises were embarrassing. The business models were optimistic to the point of performance art. Nobody is long cannabis. Nobody wants to be seen long cannabis. In fact this idea will be the first published on tradingview after a 5 year nothing burger. It’s a stock nobody wants as RSI breaks a seven-year ceiling, sitting inside a pattern with a 14,285% flagpole. Sure, it’s cannabis. The chart doesn’t know that. As with investment, plant your seeds early before the crowd shows up looking for a taste.
Is it possible price drops further? Sure.
Is it probable? No way dude. Chill.
Ww
Type: Speculative long / educational | Timeframe: 12–36 months
===============================================
Disclaimer
This idea is for educational and informational purposes only. It is not financial advice. Cannabis sector stocks carry significant regulatory, operational and market risk. Always do your own research and consult a qualified financial adviser before making any investment decisions. Past performance is not indicative of future results.
 Long
Long
Almonty Industries (ALM) — Strategic Tungsten LeaderAlmonty Industries Inc. NASDAQ:ALM is a leading tungsten producer focused on high-grade mining assets, including the Sangdong Mine in South Korea and the producing Panasqueira Mine in Portugal. The company is becoming an increasingly important supplier of strategic minerals outside China.
Key Catalysts:
Critical minerals demand:
Tungsten is an essential material used across defense, semiconductors, aerospace, advanced manufacturing, industrial tooling, and next-generation technologies, positioning Almonty to benefit from long-term structural demand.
Sangdong Mine transformation:
With Sangdong returning to production after more than three decades, Almonty is establishing itself as one of the world's leading non-Chinese tungsten suppliers.
Global supply chain importance:
Following Phase 1 production and the planned Phase 2 expansion, Sangdong has the potential to supply approximately 40% of global tungsten demand outside China, strengthening Western critical mineral supply chains.
Diversified production portfolio:
Existing production from the Panasqueira Mine and future development opportunities at the Gentung / Browns Lake project in Montana provide additional growth and geographic diversification.
Geopolitical tailwinds:
Governments and industries are increasingly prioritizing critical mineral security, defense readiness, and supply chain diversification, creating a favorable long-term environment for strategic tungsten producers.
Investment Outlook:
Bullish above: $13.00–$14.00
Upside target: $33.00–$34.00
Supported by critical mineral demand, expanding production capacity, and strategic non-Chinese tungsten supply, Almonty is well positioned to benefit from the global reshaping of critical mineral supply chains.
📢 ALM — A strategic tungsten producer powering the future of defense, semiconductors, and advanced manufacturing.  Long
Long
Long 
Long