$BHC BUYS. Good time for pharma!Key Stats:
Market Cap: $4.4B
Revenue (TTM): $11.82B
EBITDA Margi
Debt: $29.05B (High, but manageable with recent restructuring efforts)
Technical Indicators:
1️⃣ 50-Day and 200-Day Moving Average Crossover: BHC is trending above its 200-day moving average, showing long-term bullish momentum.
2️⃣ RSI Neutral : No signs of overbought territory, providing room for further upside without a pullback.
3️⃣ Strong Support Zone: Key support held firmly, suggesting bulls are defending this l
Bullish on $BMO and Canadian banksKey Stats
Market Cap: CAD 97 billion
P/E Ratio: 15.45 (Sector avg: 11.8)
Dividend Yield: 4.6% (reliable passive income)
Next Earnings Date: Dec 5, 2024
Last Upgrade: Maintained "Buy" by RBC with price target CAD 155 (Dec 2024).
Technical Reasons for Bullish Outlook
Golden Cross Formation: The 50-day moving average recently crossed above the 200-day moving average, indicating long-term bullish momentum.
Strong Support Zone: BMO has consistently rebounded off demand levels
Buy $ATD if you want your portfolio to reach ATHKey Stats:
Current Price: CAD 81.91 (as of Dec 1, 2024)
Market Cap: CAD 77.65B
P/E Ratio: 22.58
1-Year Performance: +7.2%
Next Earnings Date: March 25, 2025
Top 3 Technical Reasons ATD Will Rise:
Breakout Momentum: ATD recently broke out from a consolidation phase, with price reclaiming its 20-day and 50-day moving averages. Classic bullish signal.
Volume Surge: Increased trading volume over the past week confirms institutional accumulation.
Targeted Price Action: Resistance n
DECISIVE DIVID CORP | Chart & Forecast SummaryKey Indicators On Trade Set Up In General
1. Push Set Up
2. Range Set up
3. Break & Retest Set Up
Notes On Session
# DECISIVE DIVID CORP
- Triple Formation
* Support=0 | Trend, Behaviour & Entry Principle
* Retracement | 012345 | Subdivision 1
* Pennant Structure At 8.30 & 6.87 | Subdivision 2
- Double Formation
* Wedge Structure | Failed Target | Subdivision 3
* Neckline Area at 6.00
Active Sessions On Relevant Range & Elemented Probabilities;
London(Upwards) - NYC(Downwards)
Conclusion | Tr
Chartvzn Analysis: Canadian Imperial Bank of Commerce (CM)b]Key Stats
Market Cap: CAD 55.6B
P/E Ratio: 12.89 (Moderately undervalued compared to industry averages)
Dividend Yield: 5.91% (Solid for income investors)
Revenue Growth: 2.58% YoY (Recent FY revenue: CAD 21.31B)
Next Earnings Date: December 7, 2024
Technical Reasons for Upside
Bullish Hammer Formation: Recent price action carved out a hammer candlestick on November 20, signaling strong buyer support at lower levels.
Ascending Channel Support: The stock is hugging the bottom of a long
NRX looks great at these levelsKey Stats
Market Cap: $14.5M
52-Week Range: $1.10 - $7.33
Short Interest: 6.68%, with days to cover at 3.51
RSI (14): 41 (leaning towards oversold territory)
Technical Reasons for Upside
Price Rejection at Key Support: NRXP has been hugging the $1.20–$1.25 range, with consistent rejection at $1.10. This suggests bottoming out and a bounce in the cards.
Volume Divergence: Recent days showed a pick-up in volume as price consolidated near support, signaling potential accumulation.
Overso
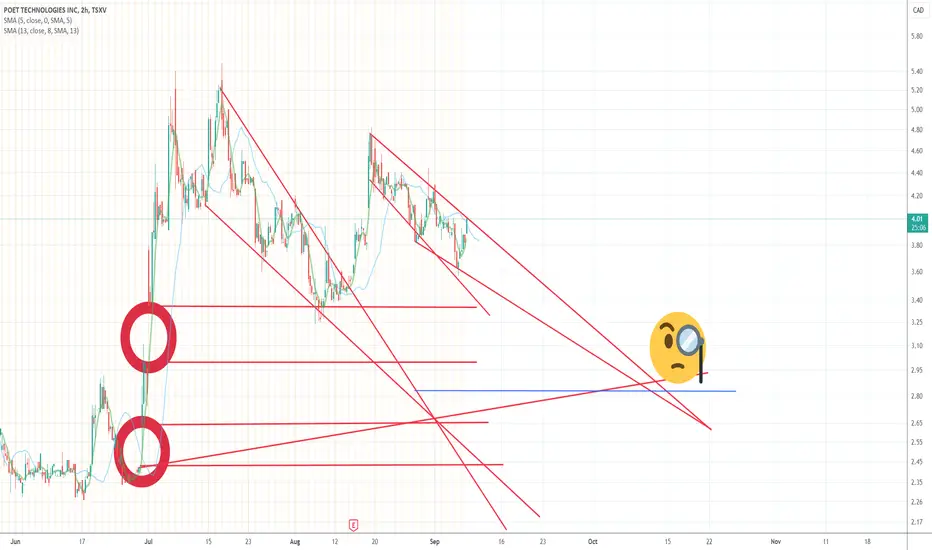
well....lets try thisPOET....on the cusp of technological greatness....if anyone can understand what they have to offer!
I'm a chart idiot...have had some success and failures. I'm not a fan of gaps unless they follow news. POET has a couple gaps as it ripped out the gate. I'm on CEO.ca...the banter there would make your eyes bleed by people who think this is ready t take over for Microsoft or something like that.
It's a slick set up, it's possible they can get some major traction...but it's more possible righ
PLong
$FIND ( Baselode Energy ) BullishDescending wedge? volume support and massive volume spike signaling a bottom?
One can dream
FLong
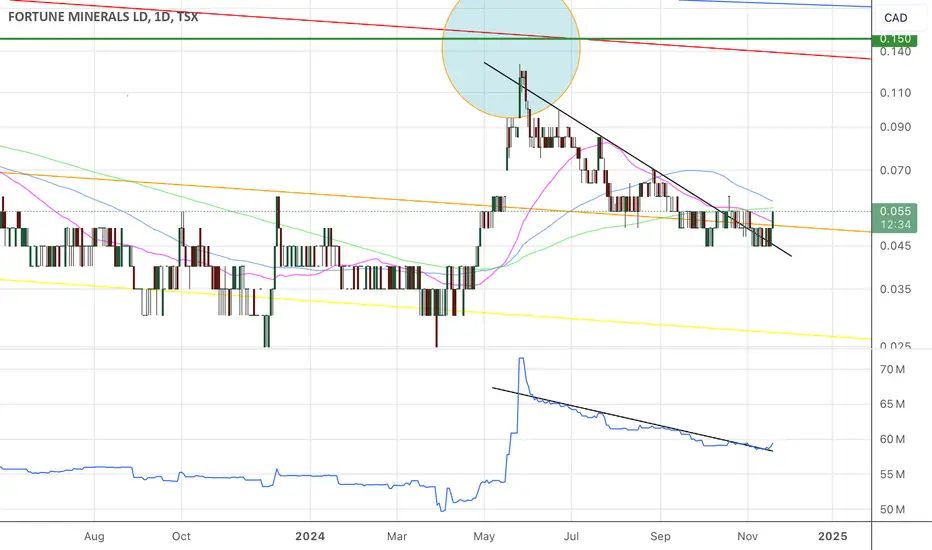
Fortune MineralsHey guys. It’s been a long retrace from the last little peak, and we have a breakout of the short-term overhead in the FT price and the On Balance Volume. Let’s see if we can climb back up to $.10US, in which case, the bull party begins in earnest. I own over 4,800,000 units, which makes me top three or four holder of this ticker, so let’s go!!
Tudor Gold Mining Chart looks very interesting poised to do well from a Bull market Golden Triangle play. Any North American jurisdiction mining company will benefit as we see tensions rise globally. Speculation that we will see an increase in currency devaluation to continue and possibly accelerate.
TSXV:TUD OTC:TDRRF
Use of implied and Historical for ranges when your left guessingTrap trading gets you out of making guesses that are not confirmed by price action .
Set your stops and wait for the market to rebound to consolidation or break out of it.
These snippits are from Barchart. Makes scanning for stocks that have high IV rank and are worth your time watching. I create a list of optionable stocks, they are usually more liquid and have a bigger audience that is more sophisticated
Options overlay tools that would be awesomeThese ties in with Gann analysis of time and price and implied volitility explosion.
We get to see how far ahead of time a price moves and trade the overextensions.
Perfect to use with Bollinger bands to find stalls and consolidation and monitior the mean reversion for Gamma exposure or pinning of options
Suncor Buy Before the earnings $SUTSX:SU Revenues are Relatively stable throughout the past quarters :
All Billions of $ 2023
Q1 11.91$
Q2 11.72$
Q3 12.65$
Q4 12.81$
2024
Q1 12.38$
Q2 12.89$
The Operating Expenses are not increasing too much
Q1 11.91$
Q2 11.72$
Q3 12.65$
Q4 12.81$
2024
Q1 12.38$
Q2 12.89$
Not many losses ; Earnings are consistent ; Interest expenses are below zero ;
Debts levels are low ; Account receivables has increased which is not good ; Inventory has increased which is not good. ; Short-Term Deb
Accumulation complete, wealth distribution commenceVery typical pattern for profits here. Take a little portion of your portfolio to accumulate at this level before price goes parabolic. Price has consolidated at these levels for far too long and is now finally inching higher, after gathering immense demand. Expect price to visit all fresh supply zones above.
Dye and Durham Downward SpiralMaking acquisitions to artificially boost their numbers, their software has not improved in years. Their recently announced layoffs and "back to office" attitude will help them get costs under control, unfortunately their product will not improve and they will have to increasingly rely on sales tactics and lock-in, an Oracle-lite strategy where the current customers find it difficult to switch and stay with the product for 5-10 years while new customers are increasingly harder to find.
They'll
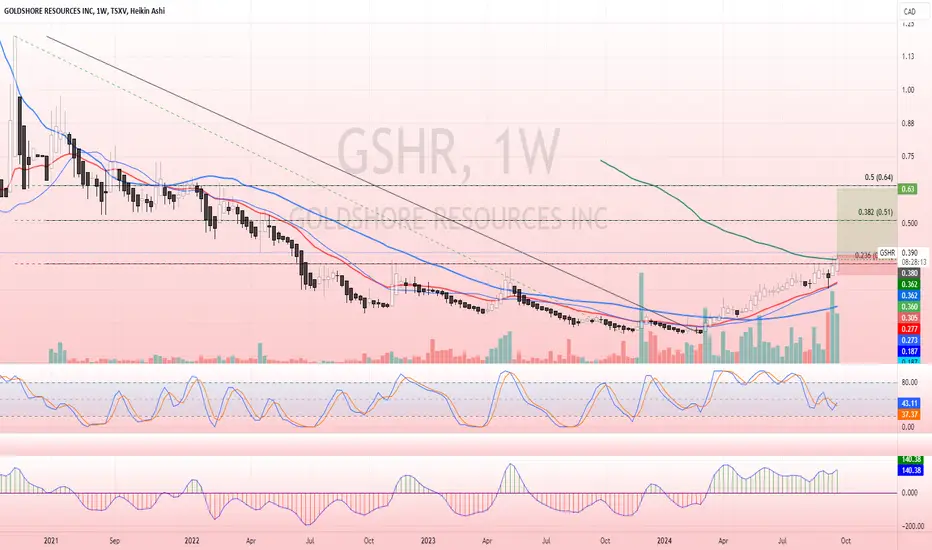
GSHR LongEntry yesterday on this one, broke and held the 236, sitting on top of the weekly 200, looking like clear sky ahead. Grabbed a 15 min entry as the 4hr was still under the 200 weekly MA. Usual SL management.
GLong
Wheaton Precious Metals (WPM): Fibonacci Levels to WatchToday, our focus is on gold mining stocks, with earnings reports from Barrick Gold TVC:GOLD and Wheaton Precious Metals NYSE:WPM in the spotlight. We’ve zoomed out on the NYSE:WPM chart to assess the overall structure and identify longer-term opportunities. Building a portfolio with some exposure to the commodity market is, in our opinion, a solid strategy for diversification.
NYSE:WPM appears highly correlated to Gold OANDA:XAUUSD and is currently sitting on a crucial trendline while