Long
Long
HME — Swing Trade Breakdown🏢 Company Snapshot
Hemisphere Energy Corp is a Canadian oil & gas E&P operator focused on conventional heavy oil, using water-flood / polymer flood recovery in SE Alberta (Atlee Buffalo / Jenner).
Recent catalysts: Q2 2025 results beat consensus, dividend increase, share buyback renewal.
📊 Fundamentals
P/E: 6.8× (Industry 8–12×)
→ Undervalued vs peers, strong earnings multiple compression opportunity.
P/B: N/A (Industry 1.0–2.0×)
→ Book value not a key metric here; asset-light and efficient operations.
Debt/Equity: 0.0 (Industry 0.5–1.5)
→ Practically debt-free — major advantage in a volatile energy market.
ROE: ~40–45 % (Industry 10–20 %)
→ Exceptional profitability and operational efficiency.
Dividend Yield: ~4.6–7.3 % (Industry 2–5 %)
→ High yield with sustainable payout ratio and free-cash-flow support.
Summary: Strong fundamentals for a micro-cap oil name: cheap relative valuation, minimal debt, healthy profitability, and yield support. But earnings volatility and reserve risk weigh.
📈 Trends & Catalysts
Revenue Growth: Last reported TTM revenue ~$82M; growth in 2024 of ~17.7 % YoY.
EPS Trend: Q2 2025 EPS beat (~ $0.07) with upward revisions, though estimates are mixed.
Balance Sheet: Virtually no debt, strong cash generation, free-cash yield ability.
Catalysts:
• Dividend bump / special dividends
• Share buyback programs
• Oil price upside / macro energy tailwinds
• Reserve revaluation or improved recovery efficiency
Risks: Commodity volatility, small-cap liquidity, reserve depletion, regulatory or environmental constraints, over-reliance on a few fields.
🪙 Industry Overview
Weekly / Monthly Movement: Oil & gas E&P small caps are volatile; sector sees frequent up/down swings depending on energy news.
12-month trend: Many Canadian E&P names rallied with energy tailwinds; HME up ~10–15 % vs baseline.
Sentiment: Neutral to Mildly Bullish — yield and fundamentals attract value hunters, but risk premium remains.
📐 Technicals (based on latest trading data)
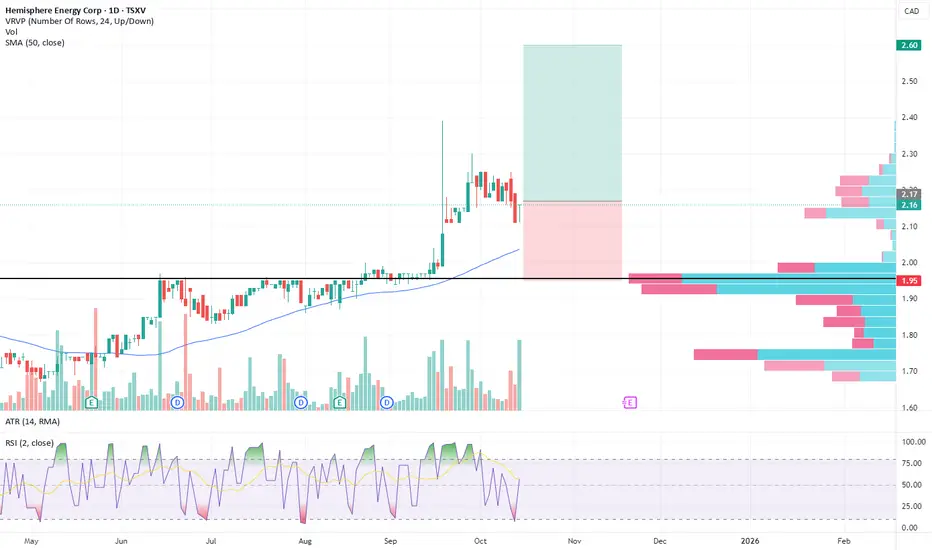
Price ≈ CAD 2.15
50-SMA ≈ ~ CAD 2.00–2.10 (mid-term average zone)
RSI(2): ~ 55–60 → neutral momentum, no extreme overbought/oversold
Pattern: consolidating near upper band of range, possible breakout attempt
Support: ~ 1.90 – 2.05
Resistance: ~ 2.30 – 2.40
🎯 Trade Plan
Entry: 2.10 – 2.20
Stop: 1.95 (below lower support zone)
Target: 2.60 – 2.80 (retest 52-week high / prior resistance)
R/R: ~ 2.5× to ~ 3.5×
Alternate: If fails to hold support, watch for drop to ~ 1.80 zone for a lower-risk reentry.
🧠 My Take
Solid setup for a swing: HME combines yield, low debt, and upside if energy stays strong. The current consolidation looks like coiling for a breakout — entry near current price with a tight stop is reasonable. But don’t overleverage — field risk and oil price swings are real.  Long
Long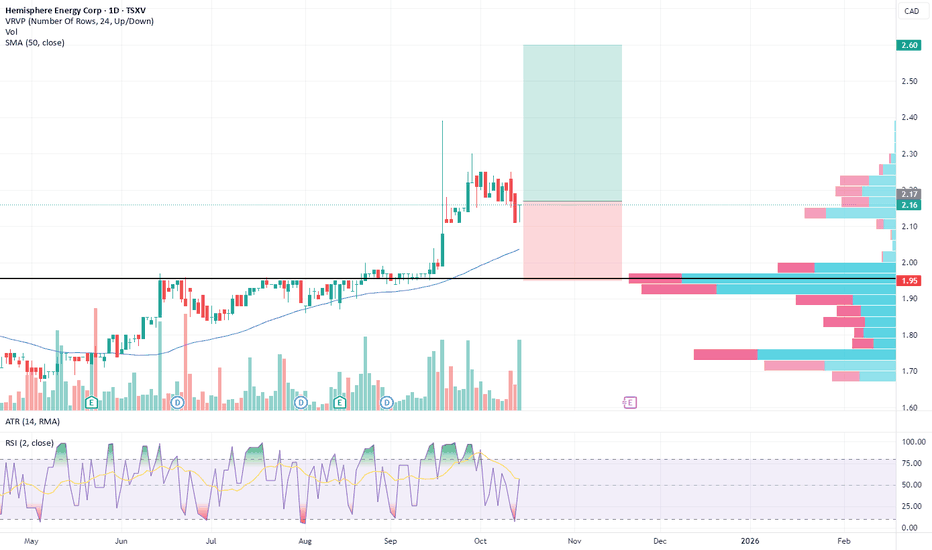
Fortune MineralsHi,
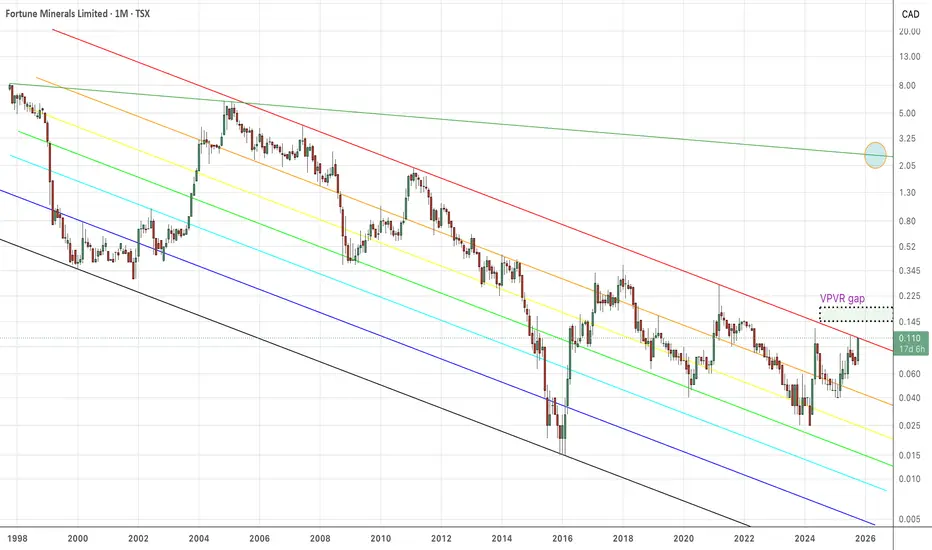
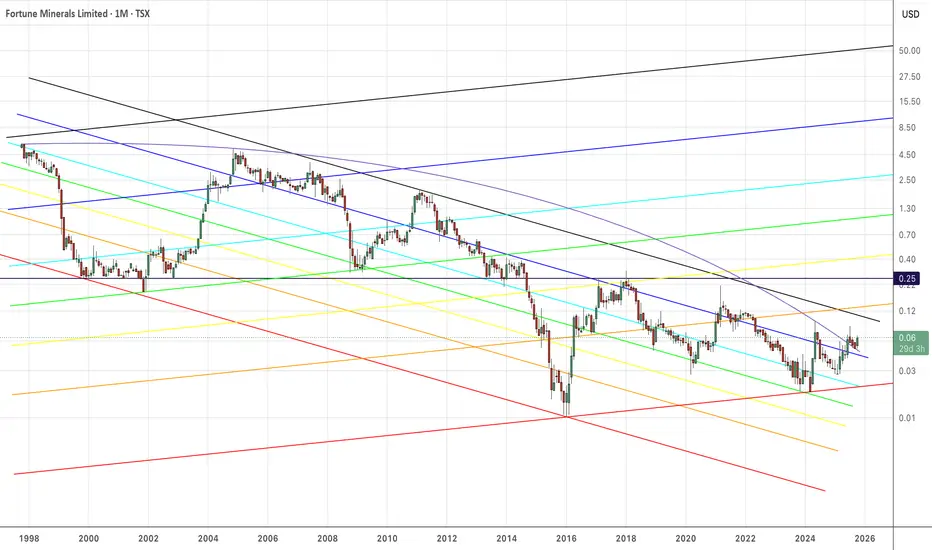
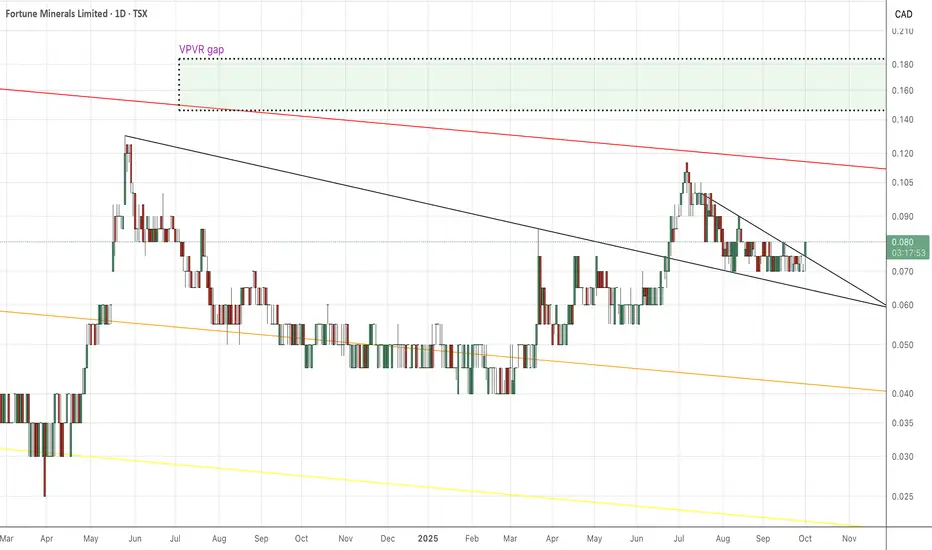
Nice close in Canada today, and this is the first close where the price is above the all-time bearish Fibonacci channel. A real breakout. On Balance Volume is at an all-time high on today's close.
Price is historically low, but OBV is all time high. What does it mean?
gaps in the volume profile above, and none below. A .236 bull fib crossing the descending overhead provide upward impetus as FT test technical bullishness.
I think you guys know the story from here. One of these days, I won't post any more charts, and you will never hear from me again. I gain nothing by doing this, except to teach my technique, so you can make money. It's thankless, and many of my posts are struck down by the mods, when actually those posts are usually the ones with the best teachings. If I were doing this for likes, then the situation would be particularly desperate, because I get far fewer likes than my work deserves. At the end of the day, I have the skills that I need, and I wish the same for you friends.  Long
Long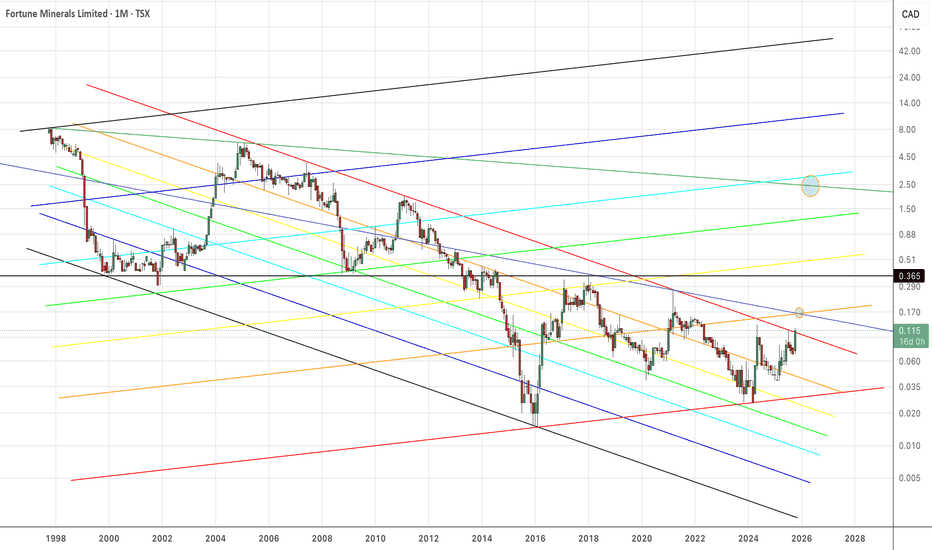
FTG.TO - Swing Trade Breakdown💰 FTG — Swing Trade Breakdown
🏢 Company Snapshot
Firan Technology Group (TSX: FTG) designs and manufactures aerospace/defense electronic products and subsystems (PCBs, flex circuits, avionics)
Recently secured EASA certification for its Edge+ 5G recorder (Airbus family), and continues integration of its FLYHT acquisition as a growth lever
📊 Fundamentals
Metric FTG Industry Avg / Peer Range Notes
P/E ~ 18–20× ~ 15–25× (tech / aerospace) Valuation is reasonable, not overly expensive for growth name
P/B ~ 2.4× ~ 1.5–3× Trading at premium to book — investors pricing in growth expectations
Debt / Equity moderate (not deeply leveraged) — No alarming leverage, seems manageable
ROE (inferred ~ 8–12 %) — Decent return profile given small cap scale
Dividend Yield ~ 0 % — No meaningful dividend; this is a growth / tech-play name
Summary: Fundamentally moderate — fair valuation, growth expectations baked in, limited income attraction.
📈 Trends & Catalysts
Revenue growth: ~ 20 %+ YoY in recent periods (2024 vs prior)
EPS trend: Modest growth; recent quarters show some volatility / misses vs expectations
Balance sheet: No severe debt pressure; ongoing integration of acquisitions; free cash flow not clearly documented
Catalysts:
• Commercial roll-out of Edge+ recorder (5G) with regulatory certification
• Backlog conversion, aerospace / defense wins
• Further M&A or strategic partnerships
Risks: Execution risk on integration, cyclicality in aerospace, valuation already pricing some expectations, small cap volatility
🪙 Industry Overview
Weekly performance: down ~ — (recent pullback vs sector)
Monthly: down, likely on broader tech / market rotation
12-mo trend: strong uptrend; FTG is up ~50 %+ over 1 year
Sentiment: Neutral to Bullish — insiders buying, analyst consensus tilted positive, but technicals show caution
📐 Technicals
Price ≈ CA$ 10.20–10.30
50-SMA ≈ CA$ 11.89
RSI (2) or near-term: ultra‐short term is oversold / weak — general RSI ~30–32 zone
Pattern: pulled back from highs; in consolidation / base-forming zone
Support: ~ 9.70 – 10.50
Resistance: ~ 11.80 – 12.80
🎯 Trade Plan
Entry: 10.30 – 10.80 (preferably on strength, bounce off lower support)
Stop: ~ 9.60
Target: 12.50 – 13.50
R/R: ~ 2.0× to 3.0×
Alternate: If breaks 11.89 - 12.00 convincingly, can take momentum breakout entry (with tighter stop)
🧠 My Take
FTG looks like a swing setup with upside potential — it has decent fundamentals, meaningful catalysts, and the technicals are healing after a pullback. But it’s not a low-risk pick: needs confirmation off support or a breakout over resistance. I’d enter on strength and keep risk tight.  Long
Long
Long 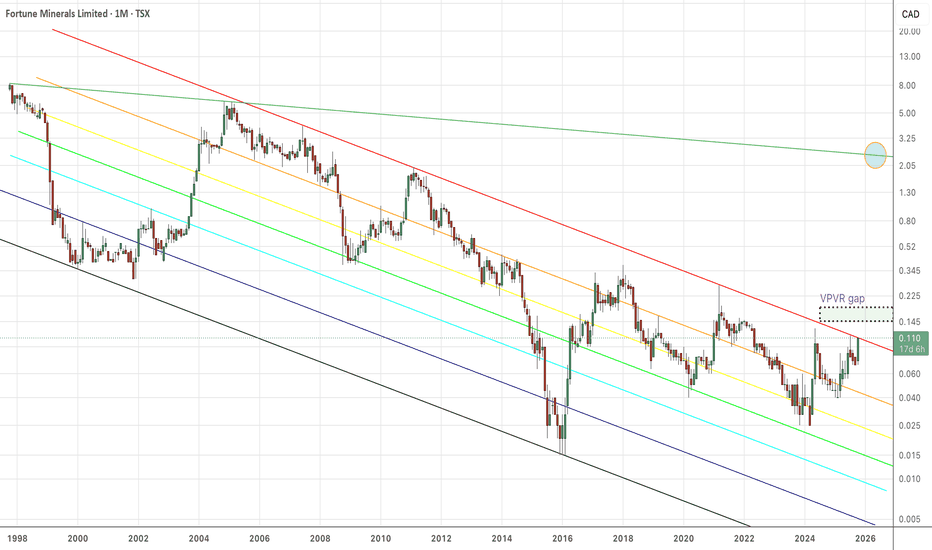
 Long
Long
DOO.TO SwingTrade AnalysisBRP got hit pretty hard in FY25, but Q1 FY26 might be showing they’re turning a corner. The rebound to C$161 M net income is promising, but a lot depends on how they handle tariffs, FX, and consumer demand going forward. If they can keep momentum, DOO might be worth a look at current levels. But it's not without risk.
Snapshot & Recent Moves
-BRP makes the fun stuff: snowmobiles, ATVs / side-bysides, marine products, Rotax engines, etc.
-FY 2025 was rough: revenue dropped ~20-25%, margins compressed, and they posted a net loss.
-But recent Q1 FY 26 shows some bounce: revenue still down vs last year, but the company turned a profit again.
-They’re carrying significant U.S.-dollar debt, so currency swings + interest rates are a real drag.
-Also, the long-time CEO is stepping down. Change at the top always adds some uncertainty.
RSI2 Strategy
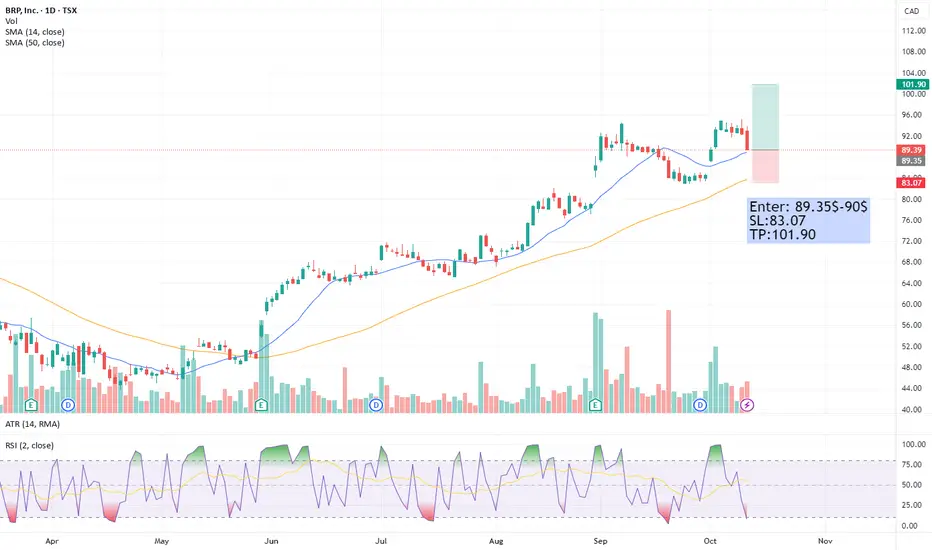
RSI(2) is hovering around [insert live value if on chart 7.89, which means the stock is deeply oversold in the short term.
Price remains above the 50-day SMA, suggesting the broader trend is still intact even if short-term momentum dipped.
Historically, BRP tends to bounce hard when RSI(2) drops below 10 and price stays above 50SMA — that’s been a reliable mean-reversion signal.
If RSI(2) crosses back over 20 while price holds trend support, that could be a potential short-term entry signal.
Conversely, RSI(2) spiking above 80 would signal overbought territory — a spot where I usually look to trim or lock profits.  Long
Long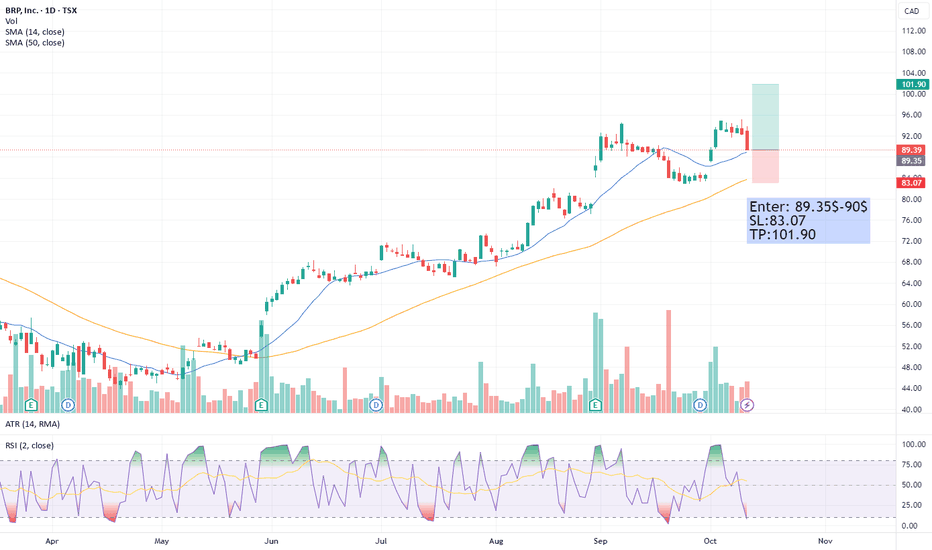
Canada Goose (GOOS.TO) Entry 2025-10-10Fundamental Analysis – Canada Goose (GOOS.TO)
Canada Goose is trading around $15.56, near its multi-year lows, and investors are starting to wonder if the stock might finally be due for a turnaround. The company has struggled recently with slower sales growth as consumers pull back on luxury spending, but it still holds strong brand recognition worldwide and continues expanding its direct-to-consumer business. Margins have been under pressure, yet the balance sheet remains healthy and the upcoming winter season could help boost sales, especially in key markets like North America and China. At this price, a lot of the negativity seems already priced in. If earnings show any signs of stabilization or improvement, there could be solid upside potential from here.
Technical Analysis – Larry Connors RSI2 Strategy
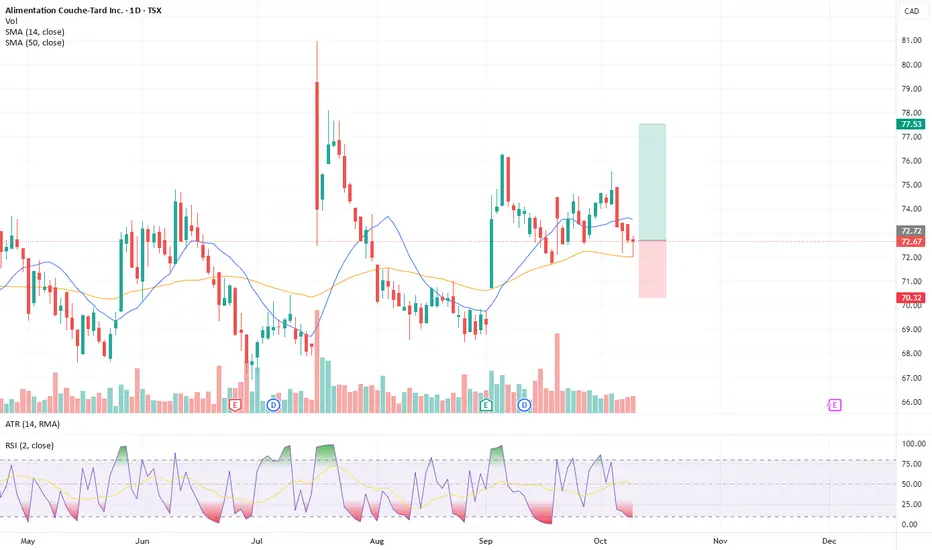
From a technical point of view, GOOS looks interesting right now. The RSI(2) is at 4.12, signaling that the stock is deeply oversold in the short term. Meanwhile, the price is holding above the 50 EMA, which means the broader trend is still positive. According to Larry Connors’ RSI2 strategy, this setup often leads to a quick bounce. If momentum kicks in over the next few days, we could see a short-term recovery. A stop just below the 50 EMA would keep risk controlled in case the setup fails. Lion One Metals and Spanish Mountain 2 great alternativesHere’s a quick look at how by-products compare, and what that means:
Spanish Mountain includes silver as a by-product: the Main Deposit M&I resource has ~0.66 g/t Ag (≈ 6.16 million oz silver) along with the gold, and the Inferred portion has ~0.95 g/t Ag.
Spanish Mountain Gold Ltd.
Their PEA assumes about 40% silver recovery over the mine life.
Spanish Mountain Gold Ltd.
+1
Cariboo also has silver listed among its metals in project highlights, though the publicly emphasized value is overwhelmingly on gold. The Feasibility Study’s metrics focus on gold production, reserves, grade, and recovery; silver is less central in disclosures.
Osisko Development
+1
Why that matters: Spanish Mountain’s silver by-product adds incremental revenue, which helps offset costs and improve margins, especially for lower‐grade gold deposits. Even though silver is lower value per ounce vs gold, having a recoverable by-product boosts economic resilience. On the other hand, Cariboo, with its much higher gold grades and robust gold reserve base, may derive less incremental lift from silver by-products, so while silver helps, it’s unlikely to move the needle as much.
If you want, I can estimate how much the silver contribution changes their respective NPVs or operating costs. B
 Long
Long
 Long
Long
Fortune MineralsHere we have US Dollars and kissing fibs. We're well below the .236 "bull fib", so it's very early days. Lots of risk and reward down here. The ticker is not truly bullish until it breaches the .236 fib, and then you look for the .618 bull fib, or some other barrier such as a descending linear overhead at $2. Volume has not even begun to enter, until we're above the .236 bull fib. Volume enters, but risk and reward are both reduced in kind. So, it depends on how much risk you like in regards to how far from the .5 bull fib you like to trade. I choose the .236 to the .618 as the most assured path with the shortest time, and acceptable risk. Risk has everything to do with time horizon. If you have more time, you can take more risk. So, here I am with plenty of time, getting my 5 million shares on lockdown well below the .236 bull fib - a very high-risk play.
over 90% of my FT position is in long term cap gains. I bought all the way down to $0.017US. Yes, less than two US pennies. I bought the dip. What did you do, complain?
Long 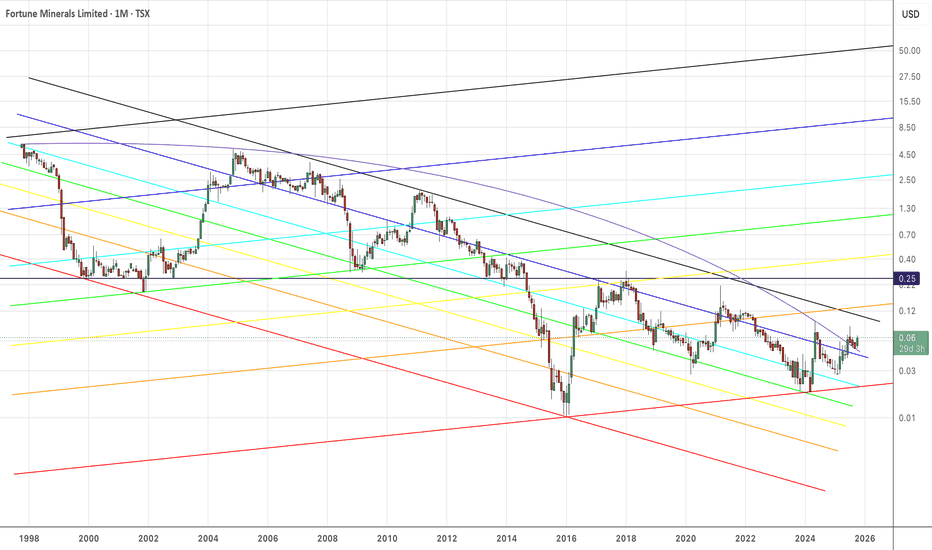
 Long
Long
 Long
Long
Long 
Long 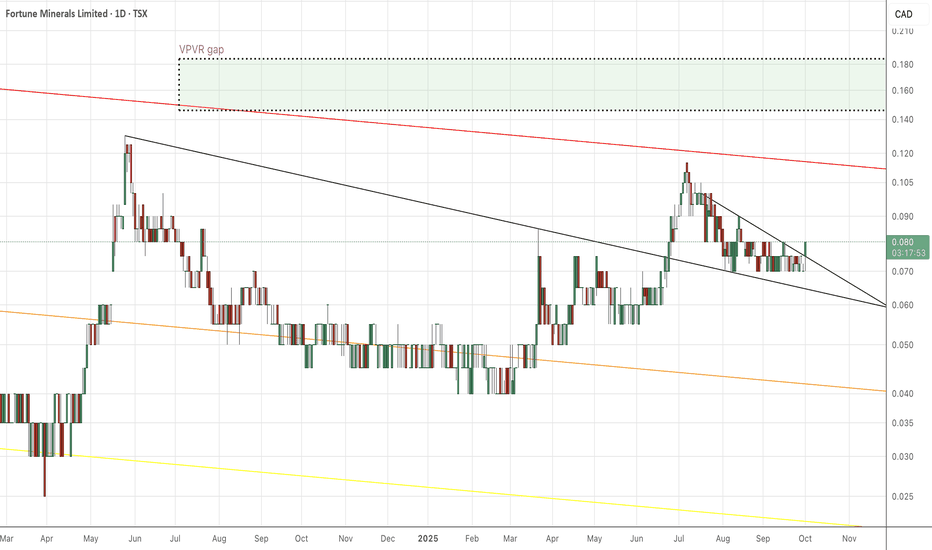
 Long
Long