• Products
  • Community
  • Markets
  • Brokers
  • More
Get started
  • Markets
  • /Canada
  • /Stocks
  • /Ideas
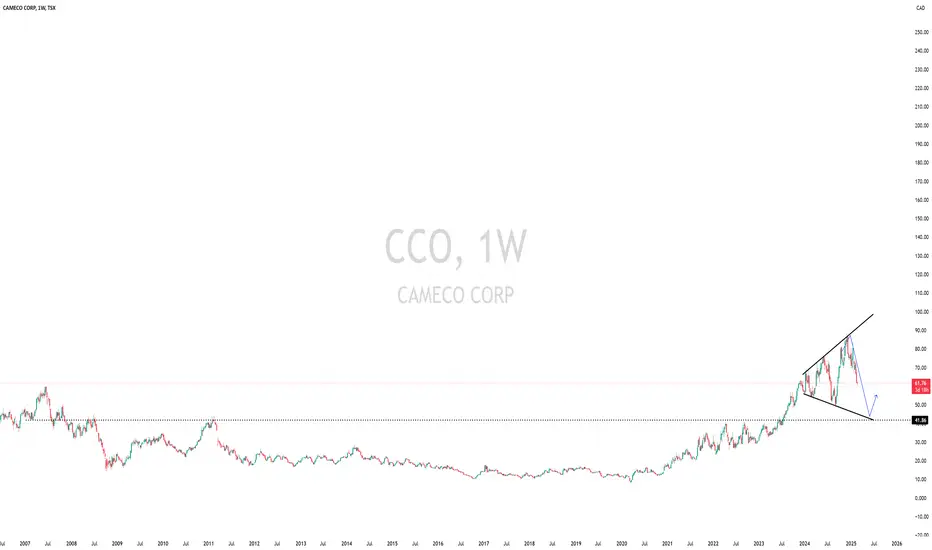
massive retest?Is $cco.to NYSE:CCJ going to retest the MASSIVE important level that goes back 18 years? #uranium #u308
TSX:CCOShort
by DollarCostAverage
Bullish on $MFI with food insecurity Be sure to click that follow button and check out all my linked socials for more elite signals and market insights! MFI – Maple Leaf Foods Inc. (TSX) Key Stats: • Current Price: ~$21.73 • Market Cap: ~$2.7B • P/E Ratio: ~18 • Dividend Yield: ~4.3% • Next Earnings Date: Feb 25, 2025 • Recent Analyst Sentiment: Upgraded to Outperform Technical Reasons for Upside: 1. 50MA Bounce: MFI has found solid support at its 50-day moving average—proof that the bulls are holding the l
TSX:MFILong
by ChartVZN
3
$AC LONG - Enter 16.50-17.00, Exit 20-22 into Q2, Risk 16TSX:AC LONG - No monthly bounce or even weekly bounce since the highs, 36% drop, daily RIS oversold to historical lows, very good risk reward entry here at 17 area.16.00 16.50 massive support. Entry: 16.50-17.00 Exit: 20-22 into Q2 Risk: 16 10 year AVG Forward PE = 7.34 , would put AC at 20.80 for 2.8 earnings 2025 Oil trending down to 60 CXY Canada dollar monthly bounce underway Entered 17 break, expect retest back to 21 area, drop with zero bounces.. Q2 tends to be best quarter for a
TSX:ACLong
by TheIntelligentInvestor
4
CVEQuadruple bottom, great dividend stock for Canadians.
TSX:CVELong
by Cariboostonks
1
BCE weekly macd buy signalFollowing a huge sell off and post-earnings flush signs of life emerge as the daily Macd followed by the weekly Macd turn positive. A lift into the high 40's looks possible. Anyone who wanted to sell BCE has been washed out already. Dividend cut is already discounted in the action imho.In fact any sign of improving balance sheet will likely fuel the upside
TSX:BCELong
by gavinken
1
Nexgen Short Opportunity ? I entered a medium-sized short position on NexGen for several reasons, as the probability of revisiting the range lows appears high from this point: 1-The price briefly broke above the range highs but quickly reversed back inside, indicating a failed breakout. 2-A classic Head and Shoulders pattern has broken down and is currently retesting the neckline. At the end of the day, trading is all about probabilities, and to me, this setup looks highly valid. Let’s go!
TSX:NXEShort
by TraderMakH
Updated
SOL Strategies: The Next MSTR Sol Strategies Inc. (CSE: HODL) is a Toronto-based Canadian investment firm specializing in cryptocurrency and blockchain-related assets. The company’s primary focus is on treasury management through activities such as lending, staking, and liquidity provisioning. Additionally, Sol Strategies actively invests in early-stage companies operating in decentralized finance (DeFi) and blockchain technologies while also engaging in Bitcoin mining and serving as a validator for the Solana blockchain. F
CSE:HODLLong
by afurs1
Updated
8
50 cents is the number we want!This puppy has been fighting its way sideways for years. Based on this chart, 50 cents might be the launching pad. However, for now - STEP 1 - break the downward channel.
OLong
by CSGold1
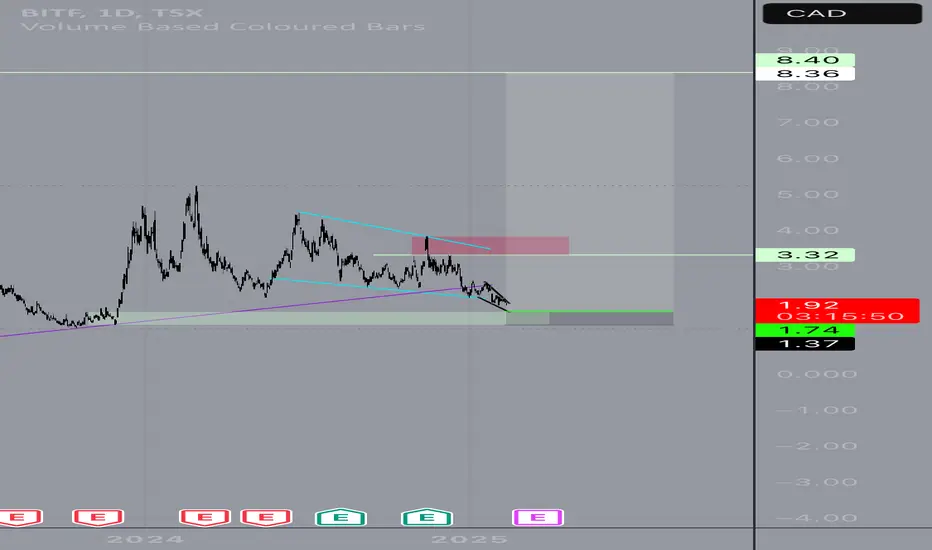
Bitfarms - Now or neverIf Bitfarms closes below 1.37 on a weekly candle it would be a major sign that Bitcoin has peaked. I don’t think this is likely but I do think this will be the final chance to go long on Bitfarms as this is a major support level between 1.37 and 1.75. The opportunity is a 1:17.5R trade. Trade quality: Chance of success 70% (assuming market moves into the zone with the confines of the wedge pattern shown) Risk to reward rating: 7/10 Overall rating: 7/10
TSX:KEELLong
by TipsOfPips
1
CIBC Risk Adversity*Not Trading Advice. (of course) Historically CIBC has not performed well along this Fibonacci Channel. While it could be years before the stock returns to the lower trend, it would appear that there is significant risk with little reward in buying in this area.
TSX:CMShort
by SpiralGraph
HWX--BullishIt is making the bullish flag. The green line is entry point and Blue line is to book profit.
TSX:HWXLong
by nabeelhashmi96
2
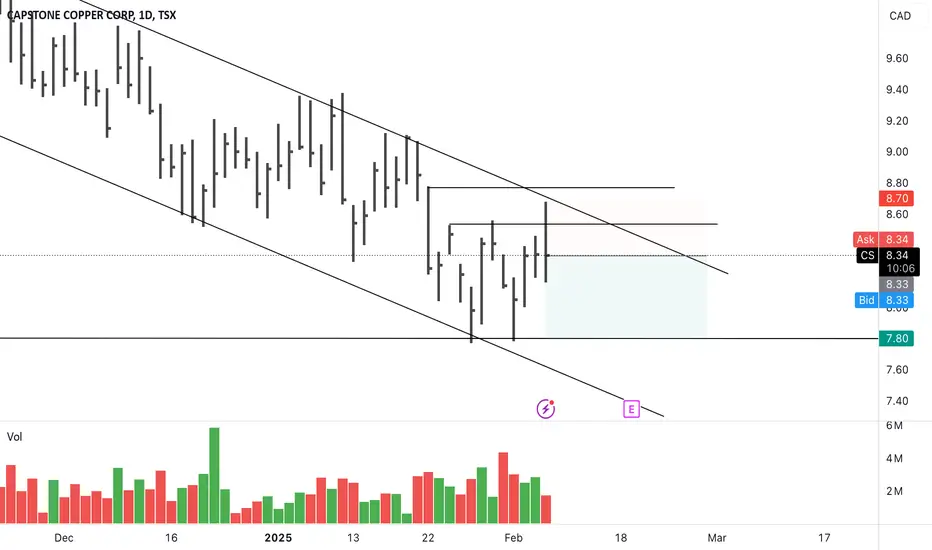
Upthrust in a downtrendUpthrust against resistance, in down market. My target is on the chart
TSX:CSShort
by Madcaptains
Updated
1
REI.UN: spring retest of creekREI.UN broke out on increasing volume last week. Friday we saw a nice retest of that level.
TSX:REI.UNLong
by Madcaptains
HR.UN begins markup phaseI bought at the opening this morning. Here HR.UN has for ed a trading range from mid Dec until now. Last week strength entered and we overcame the resistance area. Note that this resistance area was previously a support formed by high buying volume in August. We broke resistance and then retested on Friday with a nice springboard.
TSX:HR.UNLong
by Madcaptains
ENGH--Bullish It creates head and shoulder patterns. There is green line indicates entry point and blue line indicates to book profit.
TSX:ENGHLong
by nabeelhashmi96
2
I think this is going upThere is no supply anywhere in that market. The last UT was a probe to go up. Easy to say that in retrospec I guess. Anyway, instead of being met with supply, buyers came in so that mKes it a probe. There was a good bar to buy 3 bars after the one marked as SOT. Over the las weeks we saw absorption. This week looks like stopping action or perhaps a UT (to be confirmed) on the weekly. But if we look at it on the daily, yesterday was an UT that was met with lots of buying today. I think yesterday
TSX:WDOLong
by Madcaptains
1
IFC, Short, 1h✅ IFC is showing overbought conditions and is likely to pull back slightly, presenting a short-term opportunity towards the key support at 265.75. SHORT 🔥 ✅ Like and subscribe to never miss a new analysis! ✅
TSX:IFCShort
by IsmaTradingSignals
BCE, Long, 1h✅ BCE has formed a clear inverse head and shoulders pattern, with the neckline decisively broken. The price is now moving upward toward the key resistance at 38. This level is likely to act as a strong resistance, potentially leading to a bullish continuation. LONG 🔥 ✅ Like and subscribe to never miss a new analysis! ✅
TSX:BCELong
by IsmaTradingSignals
Absorption at resistanceHere I see absorption at resistance after a very long consolidation process. Some strength has entered the market over the last days. I went long today at the close.
TSX:EQXLong
by Madcaptains
Updated
Bank Of Nova Scotia Stock Quote | Chart & Forecast SummaryKey Indicators On Trade Set Up In General 1. Push Set Up 2. Range Set up 3. Break & Retest Set Up Notes On Session # Bank Of Nova Scotia Stock Quote - Double Formation * 1st Trendline | Configuration Feature * 2nd Trendline | Entry Bias On Hold | Subdivision 1 - Triple Formation * (Uptrend Argument)) | Completed Survey | Subdivision 2 * ABC Flat Feature | Subdivision 3 * Daily Time Frame | Trend Settings Condition Active Sessions On Relevant Range & Elemented Probabilities; European Session(
TSX:BNSLong
by UnknownUnicorn87383881
AC - Air Canada - Falling Wedge Falling Wedge w/ RSI 4HR Bullish Divergence after dropping below 30, at an important reversal area looking left. Stop Loss below 19.33 , layering positions inside of reversal area.
TSX:ACLong
by Siadore_
Updated
3
SPROTT technical short for the following months...From a technical standpoint there is a high probability that SII (Sprott) will head lower. -> Buyers seem to be at their peak
TSX:SIIShort
by pinetraderinc
6
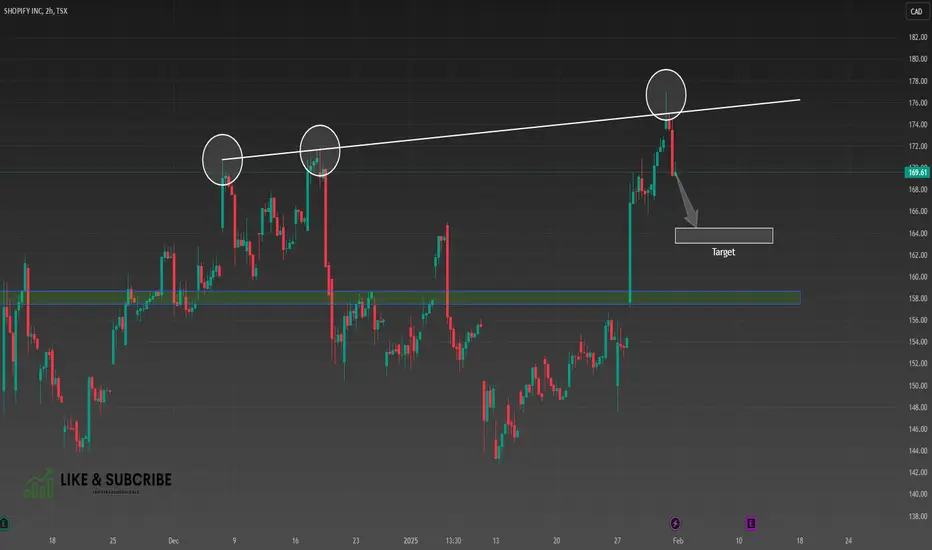
SHOP, Short, 2h✅ SHOP has rejected a strong resistance three times, confirming selling pressure at this level. The price is expected to move lower toward a key support zone. SHORT 🔥 ✅ Like and subscribe to never miss a new analysis! ✅
TSX:SHOPShort
by IsmaTradingSignals
1
CP, Short, 8h✅ CP has clearly rejected the resistance level after being tested three times, confirming weakness at this zone. A bearish trend is expected to follow. SHORT 🔥 ✅ Like and subscribe to never miss a new analysis! ✅
TSX:CPShort
by IsmaTradingSignals
123456789101112131415161718192021222324252627282930313233343536373839404142
…999

Made by humans

Select market data provided by ICE Data Services. Select reference data provided by FactSet. Copyright © 2026 FactSet Research Systems Inc.Copyright © 2026, American Bankers Association. CUSIP Database provided by FactSet Research Systems Inc. All rights reserved. SEC filings and other documents provided by Quartr.© 2026 TradingView, Inc.

SOC 2 CompliantGDPR Compliant
More than a product
  • Supercharts
Screeners
  • Stocks
  • ETFs
  • Bonds
  • Crypto coins
  • CEX pairs
  • DEX pairs
  • Pine
Heatmaps
  • Stocks
  • ETFs
  • Crypto coins
Calendars
  • Economic
  • Earnings
  • Dividends
  • IPOs
More products
  • News Flow
  • Portfolios
  • Fundamental Graphs
  • Yield Curves
  • Options
  • Macro Maps
  • Pine Script®
  • MCP Server
Apps
  • Mobile
  • Desktop
Community
  • Social network
  • Wall of Love
  • Refer a friend
  • Creator program
  • House Rules
  • Moderators
Ideas
  • Trading
  • Education
  • Editors' picks
Pine Script
  • Indicators & strategies
  • Wizards
  • Freelancers
  • Marketplace
Tools & subscriptions
  • Features
  • Pricing
  • Market data
  • Gift plans
Trading
  • Overview
  • Brokers
  • Brokers comparison
  • The Leap
Special offers
  • CME Group futures
  • Eurex futures
  • US stocks bundle
About company
  • Who we are
  • Space mission
  • Blog
  • Help Center
  • Careers
  • Media kit
Merch
  • TradingView store
  • Tarot cards for traders
  • The C63 TradeTime
Policies & security
  • Terms of Use
  • Disclaimer
  • Privacy Policy
  • Cookies Policy
  • Accessibility Statement
  • Trust Center
  • Security tips
  • Bug Bounty program
  • Status page
Business solutions
  • Widgets
  • Charting libraries
  • Lightweight Charts™
  • Advanced Charts
  • Trading Platform
Growth opportunities
  • Advertising
  • Brokerage integration
  • Partner program
  • Education program
Community
  • Social network
  • Wall of Love
  • Refer a friend
  • Creator program
  • House Rules
  • Moderators
Ideas
  • Trading
  • Education
  • Editors' picks
Pine Script
  • Indicators & strategies
  • Wizards
  • Freelancers
  • Marketplace
Business solutions
  • Widgets
  • Charting libraries
  • Lightweight Charts™
  • Advanced Charts
  • Trading Platform
Growth opportunities
  • Advertising
  • Brokerage integration
  • Partner program
  • Education program
Look FirstLook First