Long
Long
 Long
Long
 Long
Long
 Long
Long
 Long
Long
 Long
Long
 Long
Long
TAO (Bittensor): A Fascinating Idea Without a Valuation AnchorExecutive Summary:
TAO represents a potentially important decentralized AI protocol, but the absence of verifiable revenue, cash flow, or intrinsic value anchors means there is currently no demonstrable margin of safety.
The investment debate around TAO is genuinely interesting. The protocol sits at the crossroads of two powerful narratives: artificial intelligence and decentralized networks. Supporters argue it could evolve into the economic coordination layer for open AI models. Skeptics point to a simpler problem: it is extremely difficult to value. Both views contain some truth. For investors who rely on ROIC, free cash flow, and margin of safety, the conclusion is awkward but straightforward. TAO might eventually become an important network, but at present it looks much closer to a venture-style bet than an investment that can be evaluated with traditional valuation tools.
One Stock, Dozens of Voices:
This is not the opinion of a single analyst. CrowdWisdom aggregated 7 independent sources for TAO (2 professional trader videos (YouTube); 1 live market intelligence feeds; 3 prior CrowdWisdom analysis snapshots (internal archive); 1 verified financial data checks (Yahoo Finance)) and synthesized the shared thesis: where traders, investors, and researchers broadly agree, where their views diverge, and what the market might be overlooking.
The evidence was then stress-tested by placing opposing views side by side: a bull case, a bear case that challenges the consensus, and an assessment of what expectations appear already embedded in the price. Financial metrics were cross-checked against current market data.
What follows highlights where opinion converges, where it splits, and whether the stock offers any genuine margin of safety at today's price.
Business Quality and Moat Durability:
Bittensor is trying to tackle a specific problem: how to build a decentralized marketplace for artificial intelligence models and computation. Rather than a single company owning the models and infrastructure, the network allows developers and compute providers to contribute resources. Participants receive TAO tokens based on the measured usefulness of their models.
In theory, this structure could produce three sources of economic advantage.
The first is network effects. If the platform attracts enough AI developers and model providers, each additional participant increases the network’s usefulness. Benchmarks improve, training data expands, and models can collaborate or compete within a shared economic system.
The second is token scarcity. TAO has a fixed supply cap of 21 million tokens, structurally similar to Bitcoin. Roughly half of that supply is circulating, and a significant portion of tokens are reportedly locked or staked for network participation. That supply constraint could amplify price movements if demand increases.
The third is the subnet architecture. The protocol allows specialized networks to develop within the broader system. Each subnet can represent a different AI niche such as inference, training data, or agent-based systems.
Together these elements create the possibility of a network-effect moat. But at this stage it remains largely theoretical.
The true competitive benchmark is not another crypto project. It is the centralized AI stack dominated by hyperscale infrastructure providers. Microsoft, Amazon, and Google already operate global GPU networks, developer ecosystems, and enterprise distribution channels. Their annual capital spending runs into the tens of billions.
Against that backdrop, Bittensor’s moat is best described as experimental. It could evolve into a durable ecosystem, but it has not yet demonstrated the kind of network effects that make displacement difficult.
Moat durability verdict: UNPROVEN and currently NARROW.
Return on Invested Capital (ROIC):
Traditional ROIC analysis is not possible because the protocol does not publish financial statements and does not operate like a conventional corporation.
Still, the economic structure of the network raises questions about capital efficiency.
AI infrastructure is inherently capital intensive. GPUs, electricity, and networking equipment represent large fixed investments. In centralized AI firms, these costs appear as capital expenditures that must eventually generate revenue.
Within the Bittensor system, that capital is provided by participants rather than by a central organization. Miners and subnet operators purchase hardware and contribute compute resources in exchange for token rewards.
At first glance this makes the protocol appear capital light. The network itself is not funding the hardware.
But the economic reality of capital intensity does not disappear. It simply shifts onto participants who are compensated through newly issued tokens. If those rewards are not ultimately supported by real demand for AI services, the system begins to look subsidy-driven rather than profit-driven.
Without measurable revenue from customers paying for AI services, the effective ROIC of the network remains unknown.
Quality of Earnings:
There are no conventional earnings to examine.
The protocol does not produce an income statement, free cash flow statement, or gross margin data. As a result, investors cannot determine whether activity on the network produces surplus value after paying for compute resources.
This is a major distinction between TAO and traditional infrastructure companies. Investors in semiconductor firms, cloud providers, or software platforms can analyze revenue growth and operating margins. In TAO’s case, the investment thesis depends largely on token demand rather than measured profitability.
That leaves investors relying on indirect indicators such as network usage, developer adoption, and token staking behavior.
Capital Allocation Scorecard:
In a traditional company, capital allocation reflects management decisions about dividends, buybacks, acquisitions, and reinvestment.
In a crypto protocol, the closest equivalent is token issuance and incentive distribution.
TAO distributes newly issued tokens to miners and participants who contribute compute and models to the network. The goal is to bootstrap activity and encourage innovation.
However, token emissions also introduce dilution. If token issuance expands faster than demand for network services, the economic value per token may decline.
Because the protocol is decentralized, there is no conventional management team allocating retained earnings. Governance decisions generally occur through community processes and development groups.
From a value investing perspective, this structure introduces an additional layer of uncertainty. There is no identifiable capital allocator whose long-term discipline can be evaluated.
Customer and Revenue Concentration:
TAO does not have traditional customers in the way a software or infrastructure company does.
Demand for the token currently comes from three primary groups.
AI developers building models and applications on the network.
Compute providers operating mining infrastructure and earning token rewards.
Investors speculating on the future adoption of decentralized AI infrastructure.
Because the protocol has not yet disclosed meaningful revenue streams tied to enterprise AI workloads, demand for the token remains heavily influenced by investor sentiment.
Another structural consideration is token ownership concentration. With only around 10 million tokens circulating and a significant portion reportedly locked or staked, a relatively small group of large holders could materially influence price movements.
Management Alignment:
Unlike traditional equities, TAO does not have executives whose compensation structures can be evaluated through shareholder filings.
The closest comparison is the alignment among developers, early contributors, and token holders. Many participants hold tokens, which in theory aligns incentives with the long-term success of the network.
However, the absence of transparent governance structures makes it difficult to evaluate alignment in the way value investors typically would.
10-Year Durability Test:
The central question is straightforward.
Will decentralized AI infrastructure matter in ten years?
Artificial intelligence itself will almost certainly remain one of the most important technologies of the coming decade. The uncertainty lies in how that ecosystem will be structured.
Two competing models are emerging.
Centralized AI infrastructure dominated by hyperscalers.
Decentralized networks coordinating independent compute and models.
At the moment, the centralized model holds a massive advantage. Cloud providers control hardware supply chains, developer tooling, and enterprise distribution.
For Bittensor to succeed, decentralized AI would need to offer meaningful advantages such as censorship resistance, faster innovation cycles, or materially lower costs.
Even if decentralized AI becomes viable, it is far from certain that a single protocol will dominate the space.
Because the long-term competitive landscape is so difficult to forecast, TAO likely sits near the edge of most investors’ circle of competence.
Multi-Year Thesis (3 to 7 years):
Bear Case (Probability 50 percent)
Assumptions:
Decentralized AI remains a niche ecosystem.
Enterprise AI workloads continue to run primarily on centralized cloud infrastructure.
Token incentives attract participants but do not produce sustainable economic output.
Under this scenario, TAO trades primarily as a speculative crypto asset with limited real world adoption.
Estimated intrinsic value: difficult to justify above small network value estimates, implying potential downside of 60 to 90 percent depending on market liquidity.
Base Case (Probability 35 percent)
Assumptions:
Bittensor develops a modest ecosystem of AI subnets used by developers and researchers.
The network gains traction in open source communities but does not become dominant in enterprise AI.
In this case the token retains meaningful value as a specialized AI infrastructure network.
Estimated intrinsic value: roughly similar to current valuation range if adoption grows moderately.
Bull Case (Probability 15 percent)
Assumptions:
Decentralized AI infrastructure becomes an important parallel ecosystem alongside centralized providers.
Bittensor becomes the dominant coordination layer for open AI models.
Under this outcome the token could function as a scarce base asset securing a large decentralized AI economy.
Estimated intrinsic value: multiples above current levels if network activity expands dramatically.
Margin of Safety Verdict:
The current price is approximately 25.93 dollars per token, implying a fully diluted network valuation near five billion dollars.
However, there are no reliable intrinsic value estimates because the protocol does not produce measurable cash flows.
Without cash flows, a discounted cash flow model cannot be constructed. Without earnings, earnings power value cannot be estimated.
That leaves investors without a valuation anchor.
For value investors requiring at least a 20 percent margin of safety relative to intrinsic value, TAO fails the test because intrinsic value itself cannot be calculated.
This makes the investment thesis fundamentally speculative.
Peak Margin Stress Test:
Because the protocol does not disclose margins or operating economics, a conventional margin stress test cannot be performed.
The relevant stress scenario instead involves narrative compression.
If the AI narrative premium fades and the market begins valuing TAO as an experimental crypto infrastructure project rather than a foundational AI asset, the valuation could compress sharply.
In previous crypto cycles, narrative-driven tokens have experienced drawdowns exceeding 80 percent during sentiment reversals.
Valuation Framing:
The current valuation appears to assume several things.
That decentralized AI will attract meaningful developer adoption.
That the subnet architecture will support real economic activity rather than purely speculative mining incentives.
That token scarcity will translate into sustained demand.
At the same time, the valuation does not seem to reflect the most optimistic outcomes such as large-scale enterprise AI workloads operating through decentralized networks.
In other words, the market is pricing participation in the AI narrative, but not full infrastructure dominance.
Perception vs Reality:
Perception:
TAO is sometimes described as the Bitcoin of AI, suggesting it could become the foundational monetary layer for intelligence networks.
Reality:
The network is still early stage, and its economic model has not yet demonstrated durable value creation.
Why This May Be Misunderstood:
Many investors assess crypto assets through scarcity narratives rather than productivity metrics.
A fixed supply token can appear valuable simply because the number of units is limited. But scarcity alone does not generate economic value.
Ultimately, what matters is whether the network facilitates real economic activity that users are willing to pay for.
Three Measurable Things to Watch Next Quarter:
Growth in active subnets and developer participation.
Evidence of real AI workloads generating demand for network services rather than purely token mining incentives.
Token demand relative to token emissions, particularly whether staking participation continues to increase.
Historical Conviction Drift:
Earlier discussions around TAO focused heavily on price momentum and the broader AI narrative. In prior market cycles the token traded at significantly higher levels before experiencing sharp drawdowns.
More recent analysis has shifted toward the underlying network architecture and whether it can sustain real economic activity.
That shift reflects a broader move away from narrative-driven enthusiasm toward more fundamental evaluation.
Disconfirming Evidence:
The strongest argument against owning TAO is straightforward.
There is still no evidence that the network generates durable economic value.
The AI infrastructure market is dominated by extremely well-funded companies with massive capital advantages. If decentralized alternatives fail to attract meaningful workloads, the token may never justify its current valuation.
Risks:
Narrative risk. The token’s value is closely tied to the AI narrative cycle.
Liquidity risk. A relatively small circulating supply could amplify volatility if large holders exit.
Technology risk. Competing decentralized AI protocols may emerge.
Regulatory risk. Governments could impose restrictions on token-based incentive systems.
Adoption risk. Enterprises may continue relying on centralized AI infrastructure rather than decentralized networks.
Summary:
TAO is an intellectually intriguing project positioned at the intersection of artificial intelligence and decentralized infrastructure. The concept of a global marketplace where AI models compete and collaborate through algorithmic incentives is compelling.
But compelling ideas are not the same as investable assets.
Today the network lacks measurable revenue, free cash flow, and clear intrinsic value anchors. Without those foundations, investors cannot estimate a margin of safety.
The most straightforward conclusion is that TAO currently resembles a venture-style bet on the future of decentralized AI rather than a traditional value investment.
Investors comfortable underwriting speculative technological outcomes may find it worth studying further. For strict value investors focused on ROIC and free cash flow, it likely belongs in the too hard pile until the network begins demonstrating real economic productivity.
Data Snapshot:
Metric: Current Price
Metric: Value
Current Price (TAO): $25.93
Market Capitalization: N/A
Shares Outstanding: N/A
Trailing P/E: N/A
Forward P/E: 123.48x
Enterprise Value (EV): N/A
EV/EBITDA: N/A
Revenue (TTM): N/A
Gross Margin: N/A
Operating Margin: N/A
Free Cash Flow (FCF): N/A
FCF Yield: N/A
52-Week Range: $25.79 to $26.03
Sector: N/A
Industry: N/A
References:
This analysis reviewed approximately 39 article sources and 154 video transcripts.
1. ChartMill. Fundamental Analysis for TAO. www.chartmill.com
2. Patrick Badolato. Valuation P/E Ratios Simplified. www.linkedin.com
3. ChartMill. TAOX Fundamental Analysis. www.chartmill.com
4. Tao of Wealth. Harnessing the Power of Growth Stock Investing. thetaoofwealth.wordpress.com
5. Tao Value. taovalue.net
6. KoalaGains. TAOX Fair Value. koalagains.com
7. SimplyWallSt. Tao Synergies Valuation. simplywall.st
8. StockInvest. TAO.V Financials. stockinvest.us
9. Tao Value Business Archive. taovalue.net
10. Investing.com. Bittensor Technical Analysis. www.investing.com
11. The Motley Fool. TAO Crypto Quote. www.fool.com
12. YouTube video. www.youtube.com
13. Investtech. Market Analysis CompanyID 99402696. www.investtech.com
14. AIInvest. Bittensor Maintains AI Sector Leadership Revenue Growth Subnet Expansion. www.ainvest.com
15. StartupFortune. TAO Surges After Nvidia Endorsement But Revenue Gap Looms. startupfortune.com
16. CoinStats AI. Price Potential Bittensor. coinstats.app
17. AIInvest. Bittensor Surges Institutional Capital Revenue Growth Drive Recovery. www.ainvest.com
18. MEXC Exchange News. www.mexc.com
19. Yahoo Finance. Tao Synergies Coverage. finance.yahoo.com
20. CryptoRank. TAO Price Prediction Analysis. cryptorank.io
21. TradingView News. TAO Price Surges Subnet Expansion. www.tradingview.com
22. CryptoPotato. Bittensor TAO Retail Missing AI Rally. cryptopotato.com
23. ChartMill. Analyst Ratings TAOX. www.chartmill.com
24. Wall Street Journal. TAOX Research Ratings. www.wsj.com
25. Stockopedia. Tao Synergies Share Price. www.stockopedia.com
26. MarketWatch. TAOX Analyst Estimates. www.marketwatch.com
27. Investing.com. Synaptogenix Consensus Estimates. www.investing.com
28. Coinpedia Markets. Bittensor. markets.coinpedia.org
29. CoinMarketCap AI. Bittensor Updates. coinmarketcap.com
30. CoinMarketCap. Bittensor Price Analysis. coinmarketcap.com
31. Yahoo Finance Canada. TAOX Analyst Insights. ca.finance.yahoo.com
32. CryptoRank. Bittensor Social Sentiment Mixed. cryptorank.io
33. Yahoo Finance Quote. finance.yahoo.com
34. TradingView Symbol TAOUSDT. www.tradingview.com
35. StockInvest. TAOX Stock Analysis. stockinvest.us
36. Danelfin. Is Tao Synergies Stock a Buy. danelfin.com
37. Intellectia AI. Bittensor Token Volatility. intellectia.ai
38. Binance Square. TAO Hashtag Feed. www.binance.com
39. Tavily Search API Endpoint. api.tavily.com
40. YouTube sources used in synthesis include analysis and commentary from channels such as AltcoinDaily, TimWarrenTrades, AlesWorldofStocks, SPXInvesting, CryptoTips, CryptoBanterGroup, CoinBureau, Anthony Pompliano, ThinkingCrypto, CryptoCapitalVenture, and other market commentary channels contained in the research archive.
Disclaimer:
This analysis is for informational purposes only and does not constitute investment advice. Investors should conduct their own due diligence and consider their risk tolerance before investing.  Long
Long
 Long
Long
 Long
Long
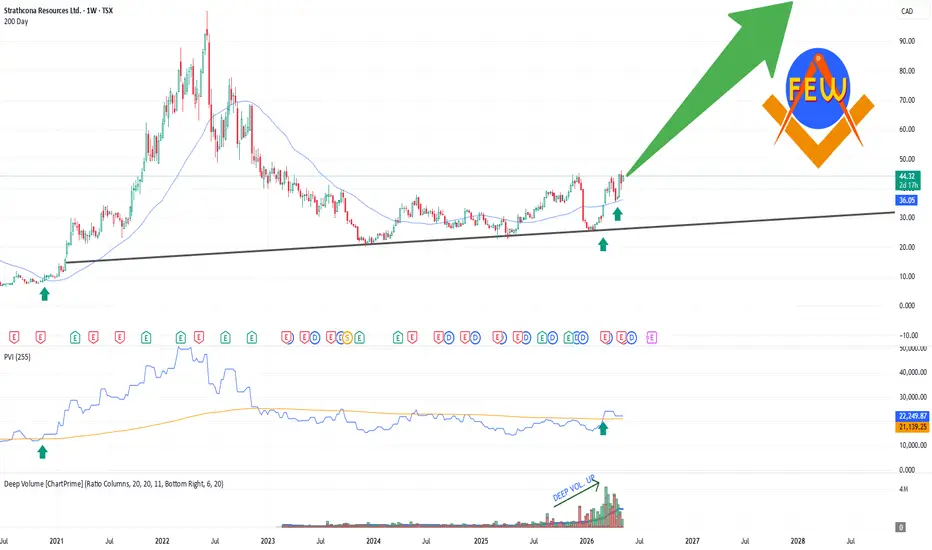
STRATHCONA - decades of oil reservesWhile the market chased:
* AI hype,
* semiconductors,
* fast money momentum trades,
Strathcona quietly accumulated something far harder to replace:
# decades of oil reserves.
Not hype reserves.
Not “next quarter” reserves.
Real reserves.
Real infrastructure.
Real barrels.
The market spent the last decade rewarding financial engineering.
Meanwhile, Strathcona built:
* long-life heavy oil assets,
* refining access to the U.S. Gulf Coast,
* rail infrastructure,
* low-decline production,
* deepest sub-$50 WTI inventory bases in North America.
the world is beginning to rediscover something uncomfortable:
You cannot run industrial civilization on narratives alone.
You need:
* diesel,
* jet fuel,
* petrochemicals,
* transport fuels,
* long-duration energy security.
And while many shale producers are fighting inventory depletion,
Strathcona is talking about:
# decades .
That’s the part the market still struggles to price.
Because SCR is not trying to become the fastest-growing oil company.
It’s trying to become one of the most durable.
$FVL The Base Is Built. The Reprice Is Not Done.Freegold Ventures Limited is shaping up like a classic junior gold breakout continuation setup: a long base, an impulsive move higher, and now a controlled pullback into support while the weekly structure still holds.
This is the kind of chart that can keep trending when capital rotates back into precious metals and explorers with torque. The move is not finished as long as the stock continues to defend the rising channel and the breakout area.
The bigger picture matters here. Gold names tend to benefit when investors want hedges against monetary stress, geopolitical risk, or weaker confidence in paper assets.
Juniors like FVL usually move harder than the metal itself once the market starts to believe in the story. That is why the pullback matters more than the headline price change: it is giving buyers a chance to reload without chasing the extension.
Technically, the chart shows a clean weekly channel with price still holding near the middle of the structure. The current pullback is sitting close to the 0.5 Fib area, which is often where continuation buyers try to defend trend.
The projected target zone remains above the current range, so the setup still has room to run if support continues to hold.
🟢 Buy Zone 1 (around 1.21 dollars)
Price has pulled back into the mid channel and is holding above the breakout area. This is the first clean retracement zone where swing buyers can step in with a defined stop under the recent support shelf. The chart is still constructive while price stays above this area.
Entry: 1.21 dollars
Current Price: 1.22 dollars
Stop: 1.02 dollars
Target: 2.40 dollars
Qty: 5,263 shares
Risk/Reward Ratio: 6.26
Position Size: 9,000 dollars
Potential P&L: 16,263.16 dollars
Risk per Share: 0.19 dollars
Reward per Share: 1.19 dollars
Key Levels:
🔑 Buy Price: 1.21 dollars
🔑 Current Price: 1.22 dollars
🔑 Stop: 1.02 dollars
🔑 Target: 2.40 dollars
🔑 Mid Channel Support: 1.21 dollars
🔑 Fibonacci Support: around 0.5 retracement
🔑 Upper Channel / Target Zone: 2.40 dollars
🔑 Trend Context: weekly base, breakout, and controlled retest
🎯 Primary Target: 2.40 dollars, or about plus 98.347 percent from entry
⚠️ Hard Stop: 1.02 dollars
This is the kind of setup traders want when they are looking for a clean continuation after a breakout. The trade is only valid if the stock keeps respecting the rising channel and the support shelf underneath it. If that level fails, the thesis weakens and the chart turns into a failed retest instead of a continuation.
If you found this analysis useful, hit the Follow button at the top of the page and drop a like on this idea so it reaches more traders. I am updating these breakout and continuation setups in real time across miners, energy, chips, defense, crypto, and AI infrastructure. You do not want to miss what comes next.
⚠️ Not financial advice. Manage your risk. $ERD The Breakout Is Done. The Reprice Is Still RunningErdene Resource Development is showing a clean monthly breakout followed by a controlled pullback into the prior advance.
This is the kind of chart traders look for when a small cap resource name has already proven it can attract momentum and is now offering a second entry instead of forcing chase buys.
The structure is still bullish because price remains well above the old base and the move has not yet lost its higher timeframe character.
The setup is simple. The market has repriced ERD hard off the lows, the pullback has not damaged the broader trend, and the stock is now sitting in the kind of zone where continuation buyers often reload.
For resource names, that matters because they can move violently once a trend becomes accepted. When the chart holds above its breakout area, the path of least resistance is often still up.
Technically, the monthly structure shows a strong prior impulse, a clean retrace, and then a fresh push toward the upper target zone. The current price at 6.25 is above the entry area around 4.01, which means the trade is already in motion but still has room to extend toward the projected resistance and measured target.
The stop sits under the invalidation area at 2.87, which keeps the setup defined and gives the trade enough room to breathe while still maintaining strong reward to risk.
🟢 Buy Zone 1 (around 4.01 dollars)
Price has pulled back into the recovery zone after a major monthly breakout, and this area is where continuation buyers can step in with clear risk. The structure is still constructive as long as price holds above the old breakout base.
This is not a random dip buy. It is a retest of a level that has already proven demand.
Entry: 4.01 dollars
Current Price: 6.25 dollars
Stop: 2.87 dollars
Target: 10.35 dollars
Qty: 877 shares
Risk/Reward Ratio: 5.56
Position Size: 9,000 dollars
Potential P&L: 15,561.40 dollars
Risk per Share: 1.14 dollars
Reward per Share: 6.34 dollars
Key Levels:
🔑 Buy Price: 4.01 dollars
🔑 Current Price: 6.25 dollars
🔑 Stop: 2.87 dollars
🔑 Target: 10.35 dollars
🔑 Breakout Support: 3.35 dollars
🔑 Invalidation Level: 2.87 dollars
🔑 Prior Repricing Zone: 4.01 dollars
🔑 Measured Target: 10.35 dollars
🔑 Trend Context: monthly breakout and continuation structure
🎯 Primary Target: 10.35 dollars, or about plus 158.105 percent from the measured move
⚠️ Hard Stop: 2.87 dollars
This is the type of chart that rewards patience. The move is already underway, but the weekly and monthly structure still suggest there can be more upside if buyers continue defending the breakout base.
If the stock loses the stop area, the thesis weakens quickly because the whole idea depends on holding the reaccumulation zone. If it stays above the entry area, continuation remains the higher probability path.
If you found this analysis useful, hit the Follow button at the top of the page and drop a like on this idea so it reaches more traders. I am updating these breakout and continuation setups in real time across miners, energy, chips, defense, crypto, and AI infrastructure. You do not want to miss what comes next.
⚠️ Not financial advice. Manage your risk.  Long
Long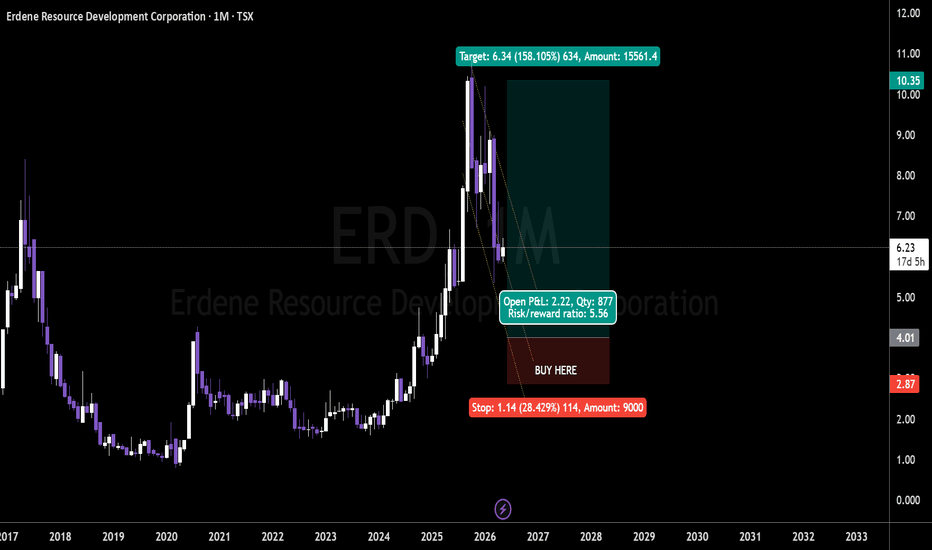
 Long
Long
 Long
Long