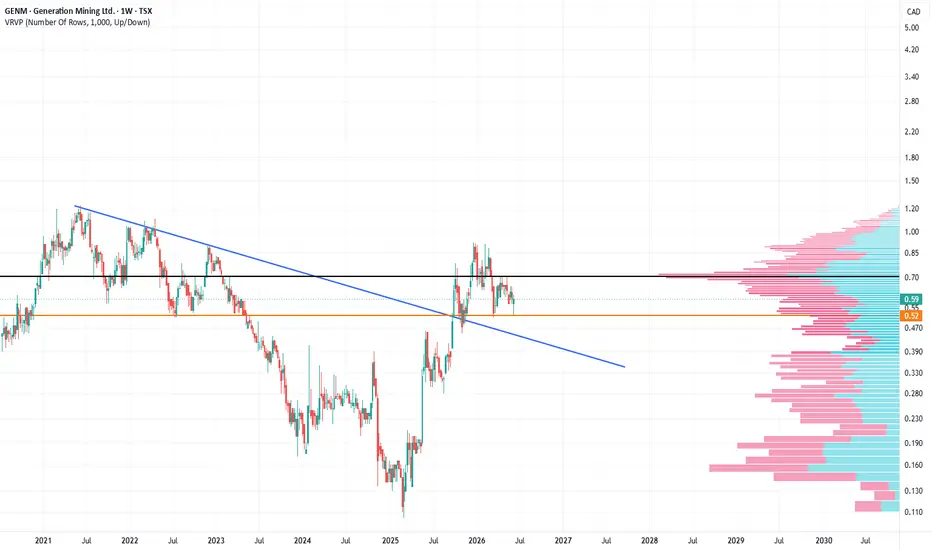
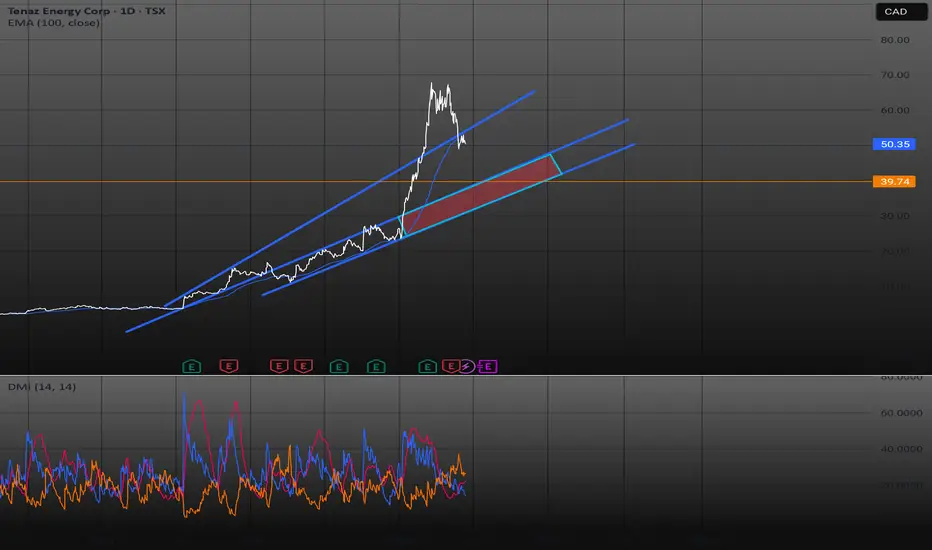
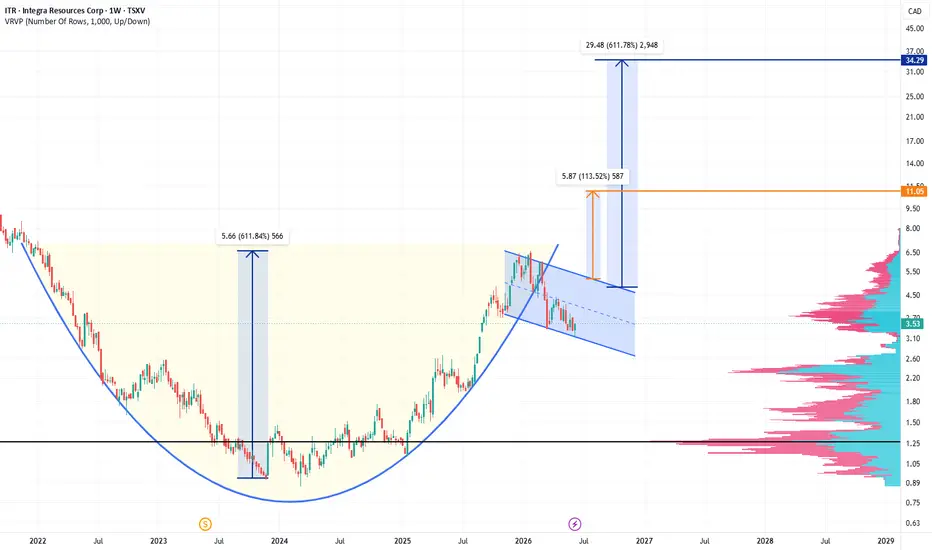
Long
Long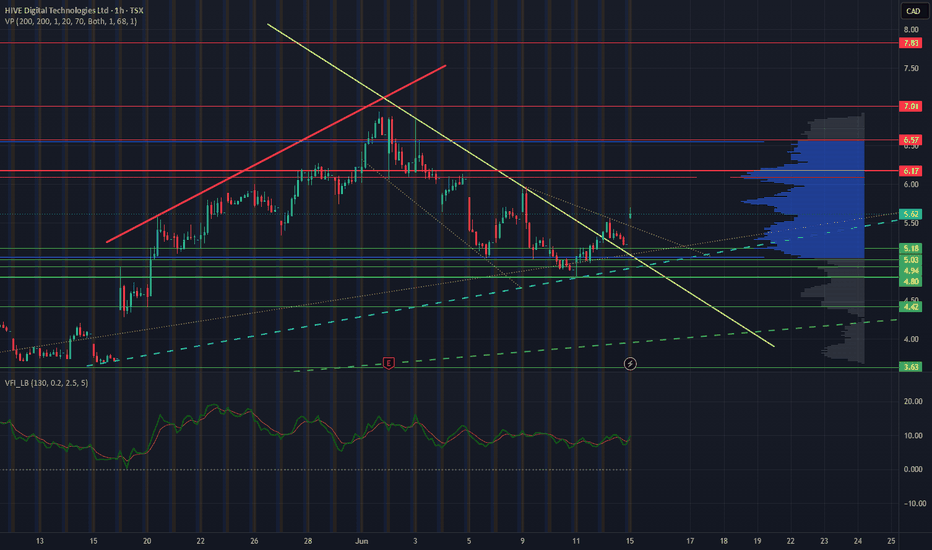
Long 
 Long
Long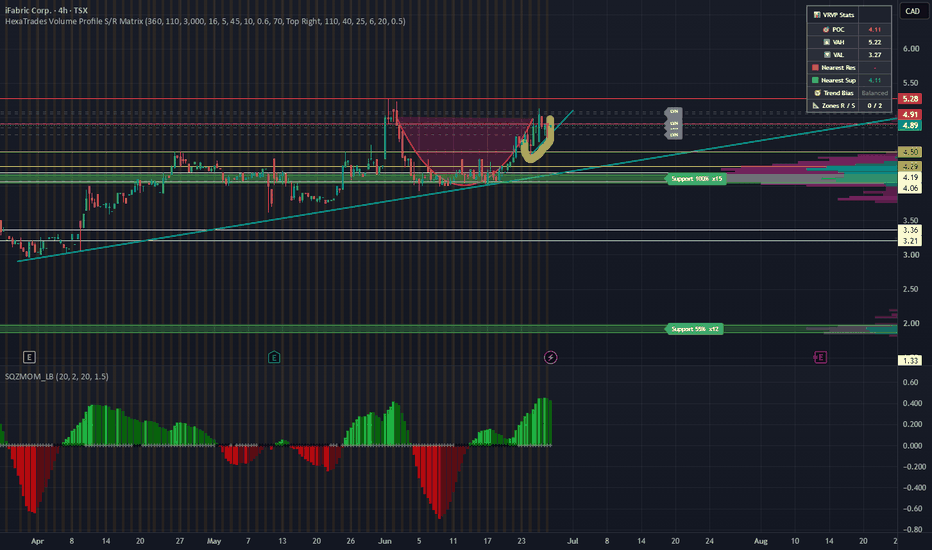
AEM: The Sound Money Squeeze - When the Shovel Becomes Too Heavy🦅 ⛏️📉 🚨
The "sound money" crowd who felt completely bulletproof when spot gold was flying toward $5,600 back in January is suddenly facing a brutal reality check. It turns out that holding physical bullion in a vault is one thing, but running a capital-intensive business to dig it out of the earth is an entirely different ballgame.
With spot gold decisively breaking below the critical $4,000/oz threshold for the first time since late 2025, the ultimate operational leverage trap is springing shut on gold miners.
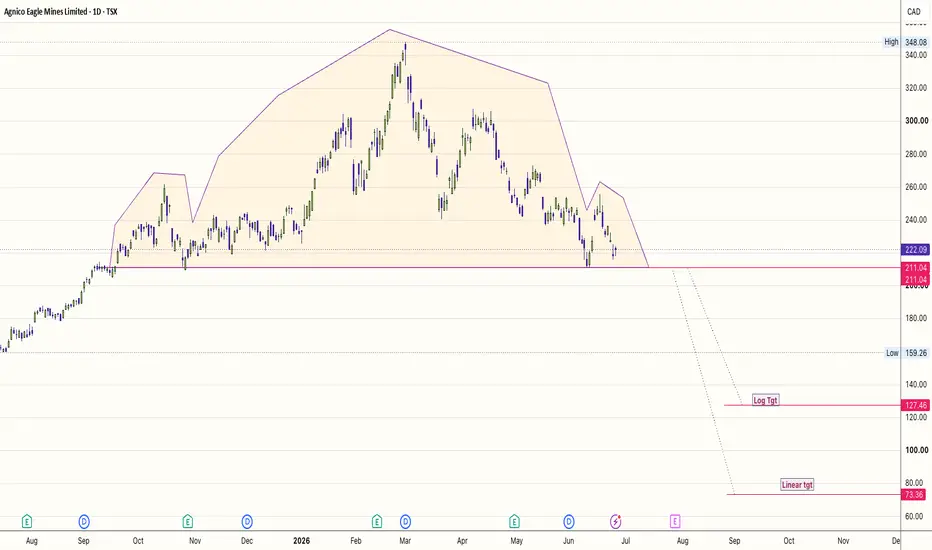
The daily chart of Agnico Eagle Mines on the TSX provided in AEM shows a massive, textbook Head & Shoulders (H&S) distribution pattern that should make every gold bug wipe the sweat from their brow.
🐻 The Bear Case: Why the Mining Margins are Vaporizing
What has institutional short desks so aggressively circling Agnico Eagle Mines right now?
It’s a perfect macro storm under the hood:
The Fuel Cost Squeeze (The Diesel Dictator): Mining gold isn’t just about finding the shiny metal; it’s an absolute energy hog.
Refined petroleum products and diesel costs have spiked between 50% and 100% in multiple jurisdictions.
For remote open-pit operations, energy can represent up to 30% to 40% of their total cost structure.
The S&P Margin Squeeze Reality: While AEM has a highly resilient, peer-leading asset base in stable regions like Canada, the broader sector is watching its All-In Sustaining Costs (AISC) creep higher.
When your revenue per ounce drops by hundreds of dollars while your haul trucks cost twice as much to fuel up, operational leverage works violently in reverse.
Institutional Capitulation (UBS Closes the Book): The smart money is losing patience.
Major investment houses like UBS officially closed out their tactical bullish views on gold mining equities.
They explicitly cited the toxic combination of rising energy overhead and the sector's failure to achieve a broad valuation rerating despite gold's earlier run.
A Resurgent DXY & Hawkish Fed Policy: Under the current Federal Reserve regime, expectations of further interest rate hikes extending late into the year have forced a massive macro repricing.
The U.S. Dollar Index (DXY) has ripped above 101.5, driving capital straight out of non-yielding hard assets and gold-adjacent equities into interest-bearing dollar alternatives.
Keep your charts locked directly onto the $211.04 level on AEM
If the daily candles close below that structural line, the gold bugs are going to have to bury their heads right alongside their bullion.
#AgnicoEagleMines #AEM #GoldMiners #GoldStocks #TSX #TechnicalAnalysis #ChartPatterns #HeadAndShoulders #ShortSetup #BearishTraders #PriceAction #TradingView #MacroAlpha #AISC #CommoditiesTrading #GoldBug #MarketRotation #LiquidityCrunch  Short
Short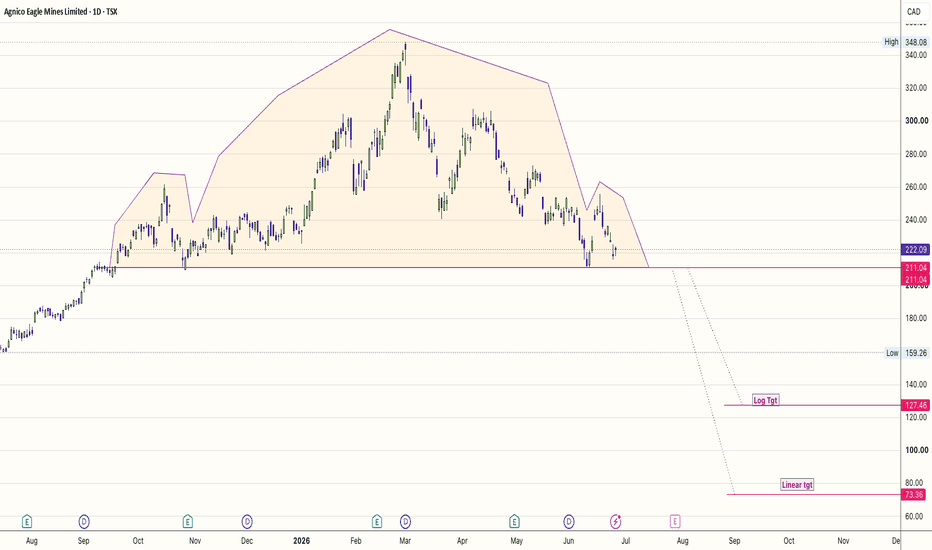
breaking out of ascending triangle with BULLISH MOMENTUM$IFA.TO – Is Smart Money Quietly Accumulating?
Been watching the chart closely and the recent price action is getting interesting.
Despite multiple high-volume sessions, IFA continues to hold the $5 area remarkably well. Normally, if large volume was purely selling pressure, we'd expect to see a much sharper breakdown. Instead, the stock keeps finding buyers and stabilizing after every wave of selling.
A few things stand out:
• Volume has expanded significantly versus prior weeks.
• Price is no longer making meaningful new lows.
• Heavy turnover is being absorbed without a major collapse.
• Trading ranges are tightening, which often happens before a larger directional move.
This is the type of action that can occur when stronger hands are accumulating shares from impatient retail holders. Institutions rarely announce they're buying—they accumulate over time while keeping price contained.
What I find most interesting is that the stock doesn't appear to be reacting negatively to the amount of volume coming through. If there was still a large amount of motivated selling, we'd likely be trading much lower than we are today.
The chart isn't screaming breakout yet, but it is starting to suggest that supply may be drying up. If buyers can push through the recent resistance zone with another surge in volume, the entire structure changes and the accumulation thesis becomes much stronger.
For now, I'm watching for:
✅ Continued support above $5
✅ Volume remaining elevated
✅ Higher lows forming
✅ Breakout confirmation above recent highs
Not financial advice, but the current setup looks far more like accumulation than panic selling Long 
 Long
Long
Long 
Osiko Metals (OM) turns upwardHTF Institutional Order Flow: Massive Accumulation & The Next DOL
Looking at the Monthly (1M) chart for OM (TSX), we are witnessing a textbook example of long-term institutional accumulation shifting gears into a powerful expansion phase.
After a multi-year bear market and a protracted bottoming formation spanning from 2018 to late 2025, the higher timeframe (HTF) order flow has officially turned fiercely bullish.
🔍 Technical Breakdown
The Accumulation Base: For nearly 7 years, price compressed within a tight, low-volatility range, systematically absorbing sell-side liquidity and building a massive order block complex.
The Expansion Phase: The recent explosive monthly candles represent a clear displacement, signaling that smart money is actively repricing this asset. This isn't retail FOMO; it’s institutional sponsorship.
Current Market Structure: Price has cleared key structural swing highs on heavy momentum, leaving behind clear institutional footprints (FVGs) on lower timeframes.
🎯 The Draw on Liquidity (DOL)
When institutional order flow turns bullish, the market looks to do one thing: seek opposing liquidity.
Primary Target: Our clear Draw on Liquidity (DOL) is the major 2017 swing high sitting squarely at 2.80 (marked by the horizontal level).
The Narrative: Having swept historical lows and consolidated for years, the market is highly magnetically drawn to this prominent pool of Buy-Side Liquidity (BSL).
🛡️ Execution Plan
As this plays out on the macro scale, any HTF pullbacks or internal range liquidity sweeps on the daily/hourly charts should be viewed as high-probability re-entry points to ride the expansion up toward the 2.80 magnet.
What are your thoughts on this expansion? Are you holding for the 2.80 liquidity pool or looking for an early distribution? Let me know in the comments!
Disclaimer: This is for educational purposes based on personal chart analysis and does not constitute financial advice. Here is the technical analysis for Advanced Micro Devices (AMD) Here is the technical analysis for Advanced Micro Devices (AMD) in English:
---
AMD (AMD) – Technical Analysis
📊 Current Market Overview
· Reference Price: Approximately $155 - $160
· Recent Trend: The stock is in a recovery rebound phase after a significant pullback, currently testing key resistance levels. The broader semiconductor sector sentiment remains mixed.
📈 Key Price Levels
Level Type Specific Price Technical Implication
Immediate Resistance $165 - $168 50-day MA and recent high convergence zone, key short-term bull/bear line
Core Resistance $180 - $185 200-day MA and psychological $180 level, primary mid-term resistance
Current Support $148 - $150 Recent low area, also a prior breakout point
Key Support $135 - $138 52-week low area and major historical support, last line of defense
📉 Trend & Momentum Assessment
· Trend Status: Daily chart shows a bottoming structure after a prolonged downtrend. Price has formed a higher low and is attempting to build a base above $150.
· Moving Averages: Short-term MAs (5-day, 10-day) are trending upward, but the 50-day and 200-day MAs remain in a bearish alignment. The stock needs to reclaim the 200-day MA (~$180) to confirm a trend reversal.
· MACD: Daily MACD has formed a bullish crossover below the zero line. The bullish histogram is expanding, indicating building upside momentum.
· Volume: Recent volume has been mixed — some accumulation is visible, but not yet at levels suggesting strong institutional interest.
💡 Comprehensive Analysis & Trading Strategy
1. Core Logic: As a major player in CPUs and GPUs, AMD's stock price is closely tied to PC market recovery, server CPU market share gains, AI GPU traction, and competitive dynamics with NVIDIA. The company has shown solid execution, but market sentiment remains cautious on the AI hardware space.
2. Bullish Scenario:
· Confirmation Signal: A volume-backed break above $168** would signal strength and likely lead to a test of the **$180 - $185 resistance zone.
· Strategy: Enter on a confirmed break above $168, or accumulate near the $148 - $150 support zone.
3. Bearish Scenario:
· Breakdown Signal: A decisive break below $148** would negate the recent bottoming structure and likely lead to a retest of the **$135 - $138 area.
· Strategy: Consider stop-loss or position reduction on a breakdown of $148.
4. Current Trading Recommendation:
· For Holders: Use **$148** as the line of defense. If the stock holds above this level and begins to show strength toward $168, continue holding.
· For Observers: **Wait for a volume-backed break above $168** to confirm the trend reversal, or **accumulate near $148 - $150** with a tight stop below $148.
---
In summary, AMD is in a "bottom-building" phase following a significant correction. $148 is the key support, and $168 is the trigger for near-term upside. The broader semiconductor sector's direction will likely be a significant driver for the stock's next move. Patience is recommended.
---
Disclaimer: This analysis is for reference only and does not constitute investment advice. Here is the technical analysis for Tesla (TSLA) in English: ---Here is the technical analysis for Tesla (TSLA) in English:
---
Tesla (TSLA) – Technical Analysis
📊 Current Market Overview
· Reference Price: Approximately $245 - $250
· Recent Trend: The stock is in a recovery rebound phase after breaking out of a prior downtrend, currently testing key resistance levels.
📈 Key Price Levels
Level Type Specific Price Technical Implication
Immediate Resistance $265 - $270 Previous high and falling trendline resistance, key short-term bull/bear line
Core Resistance $290 - $300 Psychological $300 level and historical congestion zone
Current Support $235 - $240 200-day MA and prior breakout point, critical support zone
Key Support $220 - $225 50-day MA and recent pullback low, last line of mid-term defense
📉 Trend & Momentum Assessment
· Trend Status: Daily chart shows a bottoming and reversal structure. Price has broken above the downtrend line and is now consolidating above the 200-day MA.
· Moving Averages: The stock has reclaimed the 50-day MA (~$235)** and the **200-day MA (~$240), which are now acting as dynamic support. The 50-day MA has flattened and begun to turn upward.
· MACD: Daily MACD has formed a bullish crossover below the zero line and is approaching the zero line. The bullish histogram is expanding, indicating strong rebound momentum.
· Volume: Volume expanded during the breakout and has been contracting on pullbacks, a characteristic of a healthy uptrend.
💡 Comprehensive Analysis & Trading Strategy
1. Core Logic: As the EV industry leader, Tesla's stock price is closely tied to delivery numbers, margin trends, FSD/AI progress, and overall EV demand. The recent rebound reflects improved sentiment and technical positioning.
2. Bullish Scenario:
· Confirmation Signal: A volume-backed break above $270** would confirm the trend reversal and open the path toward **$290 - $300.
· Strategy: Add positions on a confirmed break above $270, or accumulate on dips toward the $235-$240 support zone.
3. Bearish Scenario:
· Breakdown Signal: A decisive break below $235 (200-day MA)** would invalidate the bullish structure and potentially lead to a retest of **$220.
· Strategy: Consider stop-loss or position reduction on a breakdown of key support.
4. Current Trading Recommendation:
· For Holders: Use **$235** as the line of defense. If the stock holds above this level, continue holding for a potential test of $270.
· For Observers: Consider accumulating on dips near $235 - $240, or wait for a volume-backed breakout above $270 to enter on the right side.
---
In summary, Tesla (TSLA) is in a "bottoming and reversal" phase. $235 is the key short-term line of defense, and $270 is the trigger for further upside. The current strategy favors accumulating on dips, while closely monitoring delivery data and FSD progress.
---
Disclaimer: This analysis is for reference only and does not constitute investment advice. Here is the English translation of the technical analysis for ApHere is the English translation of the technical analysis for Apple Inc. (AAPL):
---
Apple (AAPL) – Technical Analysis
📊 Current Market Overview
· Reference Price: Approximately $185.50 - $187.00
· Recent Trend: The stock is in a medium-term corrective consolidation phase following a pullback from highs, currently testing key support zones.
📈 Key Price Levels
Level Type Specific Price Technical Implication
Immediate Resistance $190.00 - $192.00 20-day MA and previous platform lower bound convergence zone, key short-term bull/bear line
Core Resistance $198.00 - $200.00 60-day MA and psychological $200 level convergence; reclaiming would turn medium-term trend bullish
Current Support $182.00 - $183.00 120-day (half-year) MA, also a key support platform since 2024
Key Support $175.00 - $177.00 200-day MA and prior breakout point convergence, last line of medium-term defense
📉 Trend & Momentum Assessment
· Trend Status: Daily chart shows a medium-term corrective channel. Price has broken below the 60-day MA and is testing support at the 120-day MA.
· Moving Averages: Short-term MAs (5-day, 10-day, 20-day) are in a bearish arrangement. The 60-day MA is flattening, while the 120-day MA is still rising, forming a "long-term bullish, short-term bearish" pattern.
· MACD: The daily MACD is below the zero line. The bearish histogram is shrinking, indicating weakening downward momentum, but a clear bullish crossover has not yet occurred.
· Volume: Volume has been contracting during the pullback, a characteristic of a healthy correction, but a rebound requires volume confirmation.
💡 Comprehensive Analysis & Trading Strategy
1. Core Logic: As the world's largest company by market cap, Apple's stock price is closely tied to iPhone sales expectations, AI strategy progress, and services business growth. The current pullback primarily reflects concerns over consumer electronics demand softening and valuation digestion.
2. Bullish Scenario:
· Confirmation Signal: Needs to stabilize above the $182.00 - $183.00 support zone and reclaim the $190.00 level with volume to confirm the end of the correction.
· Strategy: Accumulate small positions near the support zone; add on a confirmed break above $190.
3. Bearish Scenario:
· Breakdown Signal: A decisive break below $175.00 (200-day MA)** would turn the medium-term trend bearish, potentially leading to a decline toward the **$165.00 - $170.00 region.
· Strategy: Consider stop-loss or position reduction on a breakdown of key support.
4. Current Trading Recommendation:
· For Holders: Use **$175.00** as the line of defense for your medium-term trend. If the stock holds the $182-$183 area and rebounds, continue holding.
· For Observers: Consider accumulating on dips near the $182.00 - $183.00 support zone, or wait for a volume-backed breakout above $190.00 to enter on the right side.
---
In summary, Apple (AAPL) is in a "medium-term correction bottom-finding" phase. $182-$183 is the key short-term support, and $175 is the mid-term bull/bear line. The current strategy favors accumulating on dips, while closely monitoring WWDC announcements and AI-related developments.
---
Disclaimer: This analysis is for reference only and does not constitute investment advice. Here is the English translation of the technical analysis for NVHere is the English translation of the technical analysis for NVIDIA (NVDA):
---
NVIDIA (NVDA) – Technical Analysis
📊 Current Market Overview
· Reference Price: Approximately $125 - $130
· Recent Trend: The stock is in a consolidation phase following a pullback from highs, underperforming the Nasdaq index.
📈 Key Price Levels
Level Type Specific Price Technical Implication
Immediate Resistance $135 - $138 20-day and 60-day EMA convergence zone, key short-term强弱 line
Core Resistance $145 - $148 All-time high zone; breaking above would open new upside
Current Support $118 - $120 Recent low area, also the 120-day (half-year) MA
Key Support $110 - $112 200-day MA and prior breakout point convergence, last line of mid-term defense
📉 Trend & Momentum Assessment
· Trend Status: Daily chart shows a medium-term corrective channel. Price has broken below the 60-day MA and is testing support at the 120-day MA.
· Moving Averages: Short-term MAs (5-day, 10-day, 20-day) are in a bearish arrangement. The 60-day MA is flattening, while the 120-day MA is still rising, forming a "long-term bullish, short-term bearish" pattern.
· MACD: The daily MACD is below the zero line. The bearish histogram is shrinking, indicating weakening downward momentum, but a clear bullish crossover has not yet occurred.
· Volume: Volume has been contracting during the pullback, a characteristic of a healthy correction. However, a rebound requires volume confirmation.
💡 Comprehensive Analysis & Trading Strategy
1. Core Logic: As the undisputed leader in AI chips, the stock's price is highly correlated with data center growth, Blackwell architecture progress, and market expectations for AI capital expenditure. The current pullback reflects concerns over valuation digestion and potential near-term demand fluctuations.
2. Bullish Scenario:
· Confirmation Signal: Needs to stabilize above the $118 - $120 support zone and reclaim the $135 level with volume to confirm the end of the correction.
· Strategy: Accumulate small positions near the support zone, add on a confirmed break above $135.
3. Bearish Scenario:
· Breakdown Signal: A decisive break below $110 (200-day MA)** would turn the medium-term trend bearish, potentially leading to a decline toward the **$95 - $100 region.
· Strategy: Consider stop-loss or position reduction on a breakdown of key support.
4. Current Trading Recommendation:
· For Holders: Use **$110** as the line of defense for your medium-term trend. If the stock holds the $118-$120 area and rebounds, continue holding.
· For Observers: Consider accumulating on dips near the $118 - $120 support zone, or wait for a volume-backed breakout above $135 to enter on the right side.
---
In summary, NVIDIA (NVDA) is in a "medium-term correction bottom-finding" phase. $118-$120 is the key short-term support, and $110 is the mid-term bull/bear line. The current strategy favors accumulating on dips, while closely monitoring AI supply chain demand signals and earnings guidance.
---
Disclaimer: This analysis is for reference only and does not constitute investment advice.  Short
Short
 Long
Long
 Short
Short
 Short
Short
 Long
Long