

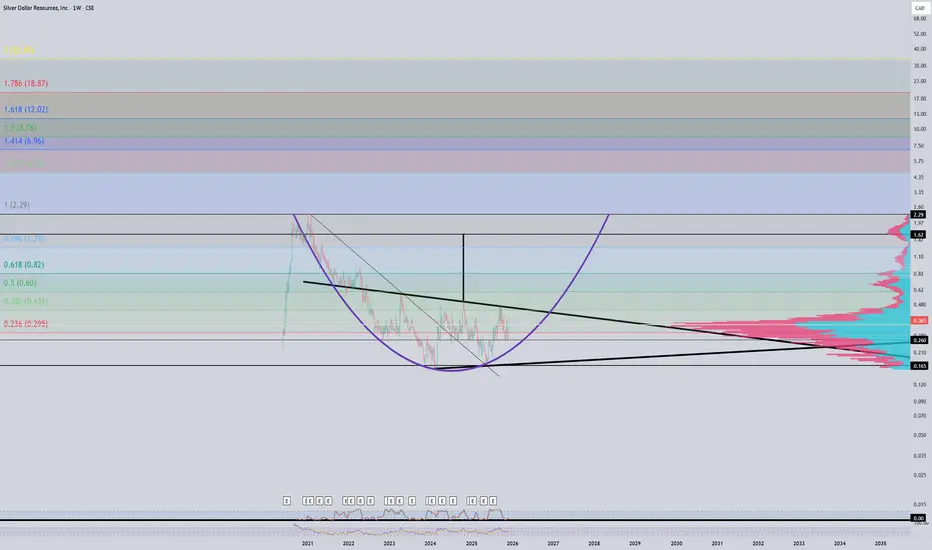
Silver Dollar could fly!This is an ideal chart that could send this stock flying.
A perfect double bottom, with a squeezing pattern.
Sustaining above 50 cents will give this a chance to run much higher... perhaps closer to all-time highs.
The purple arc is in play FOR NOW. However, I'd prefer to see more bounces off that side to be comfortable.
Oh... and Sprott is a major owner of this stock.
Just keep an eye on Fibs for areas you may want to sell.

A long runway ahead for Outcrop (so far!) This chart shows a clear path to much higher levels.
However, a lot depends on this purple arc, which has been acting as support since 2019.
If it can stay inside this arc, that path is pretty clear. And, if it can sustain above 50 cents, it should see much higher prices over the next few months -- breaking out of an area with MAJOR resistance.
Of course, if Silver were to crash alongside a market crash, then all bets are off.
 Long
Long
Silver Juniors Basket – Potential 100% Collective Move?The basket includes six silver juniors (OCG, MTH, KTN, SVRS, SSV, DEF). All are focused on silver-dominant projects, primarily in Mexico and Colombia. Most are at the discovery and development stages, with long histories dating back to previous silver cycles. Market caps are in the 70–180M USD range – large enough to be investable for institutions, but still small enough to offer high leverage to a rising silver price. None are major producers, which means cash flow is limited, but the trade-off is greater upside torque if silver enters a strong bull phase.
Technical Highlights
Base formation (2022–2025): multi-year consolidation with rising volumes, now breaking out.
Downtrend line from 2011: currently being tested. A decisive breakout here would mark the end of a 14-year bear market structure for this basket.
Measured move of the accumulation pattern points to ~100% upside from current levels.
Fibonacci retracements from the 2020 high: a 100% collective rally coincides almost exactly with the 0.5 retracement level – a major technical magnet.
Distance % from 36-week SMA: currently ~40, while historical cycle peaks reached 110–120. This suggests substantial room for extension.
RSI (weekly): shifting from a bear-range (<50) to a bull-range (>60).
Volume: the strongest since 2011, confirming renewed institutional interest.
Trade Idea
This basket represents a high-beta silver leverage play. With silver itself testing major breakout levels, these juniors could collectively deliver a ~100% move into the 0.5 Fib retracement zone.
But the more important perspective: when a decade-long trendline finally breaks, the move often transcends Fibonacci levels and becomes a structural reset. Historically, silver juniors have not stopped at 0.5 retracements – they have delivered multiples of returns once momentum truly takes hold.
In that sense, 100% may only be the “first stop”, not the destination.
OLong

ENB | Natural Gas Producer on the Rise | LONGEnbridge, Inc. engages in the provision of gas and oil. It operates through the following segments: Liquid Pipelines, Gas Distribution and Storage, Gas Transmission and Midstream, Renewable Power Generation, and Energy Services. The Liquids Pipelines segment consists of common carrier and contract crude oil, natural gas liquids and refined products pipelines and terminals in Canada and the U.S., including Canadian Mainline, Regional Oil Sands System, Southern Lights Pipeline, Spearhead Pipeline, Seaway Crude Pipeline interest, and other feeder pipelines. The Gas Distribution & Storage segment consists of natural gas utility operations, the core of which is Enbridge gas, which serves residential, commercial and industrial customers. It also includes natural gas distribution activities in Quebec and an investment in Noverco, which holds a majority interest in a subsidiary entity engaged in distribution and energy transportation primarily in Quebec. The Gas Transmission & Midstream segment consists of investments in natural gas pipelines, processing and green energy projects, the company's commodity marketing businesses, and international activities. The Renewable Power Generation segment consists primarily of investments in wind and solar power generating assets, as well as geothermal, waste heat recovery, and transmission assets. The Energy Services segment consists of businesses in Canada and the United States including logistical services, refinery supply services and the firm's volume commitments on various pipeline systems. The company was founded on April 30, 1949 and is headquartered in Calgary, Canada.
 Long
Long
OCG .32-35 Target - A swift moveThat was too free. Expecting chop until buyers feel comfy enough to send it another leg up.
Long
New high ground at 0.27, up to 0.6 Atrium target soonLion One clearly starts to find high ground,
With mega free cash flow and money to invest in the 500 feeder zone and real production plant, pilot was immense succesfull! 50k Oz AuEq next year and 100 Oz when plant is ready in 2027. With potential to double the min to the Banana Creek west zone (underground tunelling possible over 300m)
 Long
Long
Vermilion Energy (TSX: VET) Swing TradeVET.TO — Swing Trade Breakdown (4H Mean Reversion Setup)
Vermilion Energy (TSX: VET) is setting up a clean mean-reversion swing after a strong breakout followed by a controlled pullback. Energy as a sector has been firming, WTI stabilizing, and VET continues to trade at a valuation discount relative to mid-cap peers. The 4H chart you posted shows a textbook retest of prior breakout levels with RSI(2) deeply oversold.
Company Snapshot
VET is a globally diversified oil & gas producer with assets in Canada, Europe, and Australia. The stock tends to move with both crude and European natural gas, and is benefiting from improving margins, better cost control, and an ongoing debt-reduction cycle. Recent momentum in energy has put VET back on swing-trader watchlists.
Fundamental View (Quick)
VET continues to trade at a discounted valuation (P/E around 6–7× and P/B under 1×). Debt levels have come down significantly over the last two years, free cash flow remains strong, and the company maintains good liquidity. Fundamentally, the stock screens as cheap, with improving profitability and a stable balance sheet. Catalysts mainly revolve around commodity pricing, hedging updates, and buyback activity.
Trend & Catalysts
Revenues and EPS have been stabilizing, tracking oil and European gas prices. Cash flow is trending higher thanks to disciplined capex.
Key catalysts include:
• Seasonal winter gas demand
• WTI holding higher lows
• Fund rotation back into value/energy
• Potential upside revisions in production guidance
• Stronger European gas pricing
Risks remain tied to commodity volatility, demand shocks, and currency moves.
Industry Context
Energy has been improving on both the weekly and monthly timeframe. Money flow is rotating back into value names after recent weakness in growth/tech. On a 12-month basis the sector is still underperforming, which leaves room for a catch-up move if crude continues to stabilize.
Technical Breakdown (4H Chart)
Price: ~$12.13
Structure: Price pulled back into prior breakout support after a sharp rally.
RSI(2): Extremely oversold (2–3 range), ideal for mean-reversion entries.
Trend: Price is above the 50-SMA and 200-SMA on the 4H, keeping structure bullish.
Pattern: Retest of breakout + small flush wick into support.
Support: $12.00 (primary), $11.80 (structural invalidation)
Resistance: $12.80, then $13.00–$13.10
Volume: Breakout occurred on higher-than-average volume, pullback volume is contracting — a good sign.
This is the exact look you want for a Connors-style RSI2 swing: impulsive leg → oversold pullback → support retest above SMA50.
Trade Plan
Entry Zone: $12.00–$12.20
This is the area of highest reward and lowest risk based on the retest structure.
Stop: ~$11.80
Below the pullback low and under the SMA zone — if that breaks, the pattern is invalid.
Target: $13.00–$13.10
This matches the previous swing high and the measured move from the initial breakout.
Risk/Reward: ~2.5R
Your chart’s box (SL at $11.80, TP around $13.07) is perfectly aligned with a high-probability mean-reversion swing.
Alternate Entry: Break above $12.50 with a tight stop under $12.00. This is the momentum-continuation version if price doesn’t dip again.
My Take
This is one of the cleaner RSI2 swings in the current TSX energy space. The stock is fundamentally undervalued, technically strong, and pulling into ideal support with oversold conditions. As long as $11.80 holds, I like this for a 2:1+ swing into the $13 zone. A bounce from the 4H SMA50 plus a sector tailwind could accelerate the move.
 Long
Long
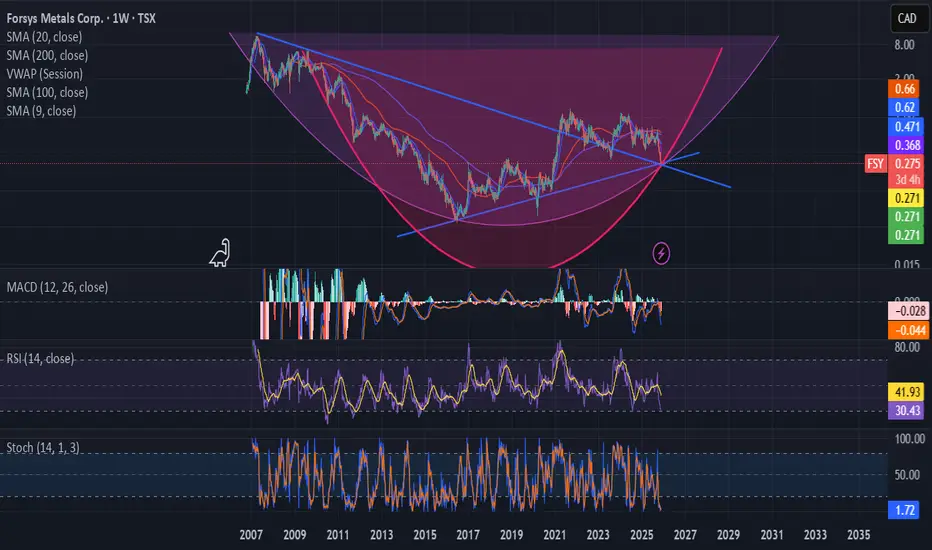
FSY at the Injunction Point Where you go All In?It seems to be at a lovely injunction point where you bet big here. Lets go, together.
FLong
Brookfield Renewable (BEPC) — Swing Trade💰 BEPC.TO — Swing Trade Breakdown
Brookfield Renewable (BEPC) just printed a clean RSI2 pullback right into the rising 50-SMA after a strong November run. This is one of the better mean-reversion structures on the TSX right now, especially in a rate-cooling environment where renewables finally have a tailwind again.
🏢 Company Snapshot
BEPC operates one of the largest global renewable energy platforms (hydro, solar, wind). The stock has been basing for months, finally broke out, and is now retesting support with an oversold short-term setup — the exact pattern my system is built for.
📊 Fundamentals (Quick Read)
Not a perfect earnings story but cash flow is strong enough to support the business model:
P/E: N/A due to depreciation-heavy structure
P/B: ~1.7× — reasonable for utilities
Debt/Equity: ~1.1 — high but normal for long-duration assets
ROE: Negative — expected with leveraged renewables
Dividend: ~4.3% — strong income component
FCF: Improving YoY
Cash: ~$700M+ liquidity
Summary: Steady cash flow business with high leverage but a stable long-term profile. Rate cuts would help significantly.
📈 Trends & Catalysts
Revenue: Mid-single-digit growth
EPS: Improving but still choppy
Cash Flow: Consistently rising
Balance Sheet: Leverage high but manageable
Catalysts: Falling yields, ongoing asset recycling, ESG flows
Risks: Rate shocks, refinancing cycles, project delays
🪙 Sector Snapshot
Utilities / Renewables are finally stabilizing after a long drawdown. Lower yields = stronger bids in defensive, cash-flow-heavy sectors. BEPC is showing early leadership this month.
📐 Technical Breakdown
Price is sitting directly on the rising 50-SMA with RSI(2) in extreme oversold territory — a classic Connors-style trigger. Long-term trend intact with price well above the 200-SMA.
Key Levels
Price: $57.46
50-SMA: ~$56.70
200-SMA: ~$49.50
RSI(2): ~3–4 (oversold)
Support: $56.00–56.70
Resistance: $59.50–61.00
Volume: Accumulation spikes on green days
The chart shows a controlled pullback with no breakdown — just a retest of prior demand.
🎯 Trade Plan
Entry Zone: $57.00–57.60 (already hit)
Stop: $56.00 (below SMA + wick lows)
Target: $59.50–60.00
R/R: ~2:1 to 2.5:1
Alternate Setup: Add on a reclaim of $59 with volume for a continuation breakout
🧠 My Take
This is exactly the type of pullback I want — oversold RSI2, clean 50-SMA touch, rising trend, and the sector gaining momentum. As long as $56 holds, I like the bounce back into the $59–60 zone. Great structure for a short-duration swing.
 Long
Long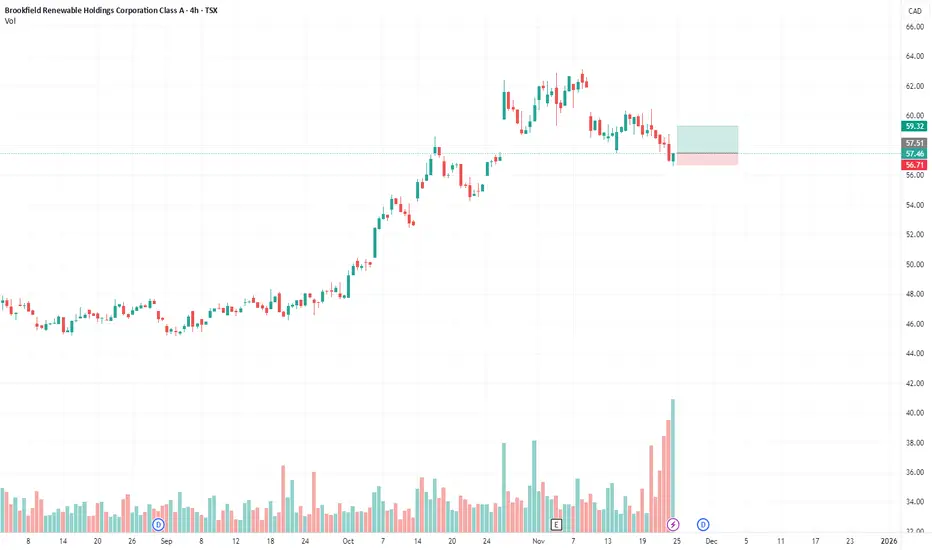
HLU - Trio Retest: Where Structure Meets Opportunity!Homeland Uranium TSXV:HLU just secured a long-forgotten 35-million-pound uranium deposit in Colorado, originally discovered in 1979 and abandoned when the nuclear industry collapsed.
With uranium prices up 141% in four years , and global demand expected to jump another 28% by 2030 , Homeland is positioning itself inside a powerful multi-year commodity cycle few investors are watching.
Add AI-driven power demand, national security concerns, and new U.S. policies fast-tracking domestic uranium, and HLU becomes a high-conviction asymmetric energy play.
📊 Technical Analysis
After surging by over 160% , HLU has been in a healthy correction phase, trading within the falling channel marked in red.
However, from a long-term perspective, HLU remains overall bullish, trading within the rising broadening wedge pattern.
The orange circle represents a massive rejection point, the intersection of three confluences, what I call a TRIO RETEST :
- The lower bound of the rising wedge pattern
- The lower bound of the falling channel, acting as an oversold zone
- The structure marked in blue
As HLU approaches the orange zone, we will be looking for trend-following longs.
For the bulls to confirm long-term control and kickstart the next big impulse upward, a break above the falling red channel is needed.
💡 Bigger Picture
Here’s why the fundamentals add fuel to the technical setup:
- A $2.7B uranium prize reclaimed for pennies: Homeland acquired a 35-million-pound U.S. uranium deposit for just $0.15/lb, material now worth nearly $80/lb.
- Trump’s Day-One energy orders: New executive actions prioritize U.S. nuclear power and domestic uranium production. Homeland controls a rare U.S.-based asset right as the policy tide shifts.
- AI is outgrowing the grid: Microsoft, Google, and Oracle are moving toward nuclear due to soaring power needs. Homeland owns the fuel they’ll need.
- National security tailwind: The U.S. imports 98% of its uranium. Russia banned exports. China is hoarding supply. Homeland’s American deposit is uniquely strategic.
📘 Bottom line
HLU is sitting at a key technical zone while the macro, political, and energy narratives align in its favor. If the TRIO retest holds, the next bullish impulse could unfold from a position of both structural and fundamental strength.
📌 Always do your own research and consult your financial advisor before investing.
📚 Stick to your trading plan, entry, risk management, and execution.
All strategies are good, if managed properly.
~ Richard Nasr
 Long
Long
 Long
Long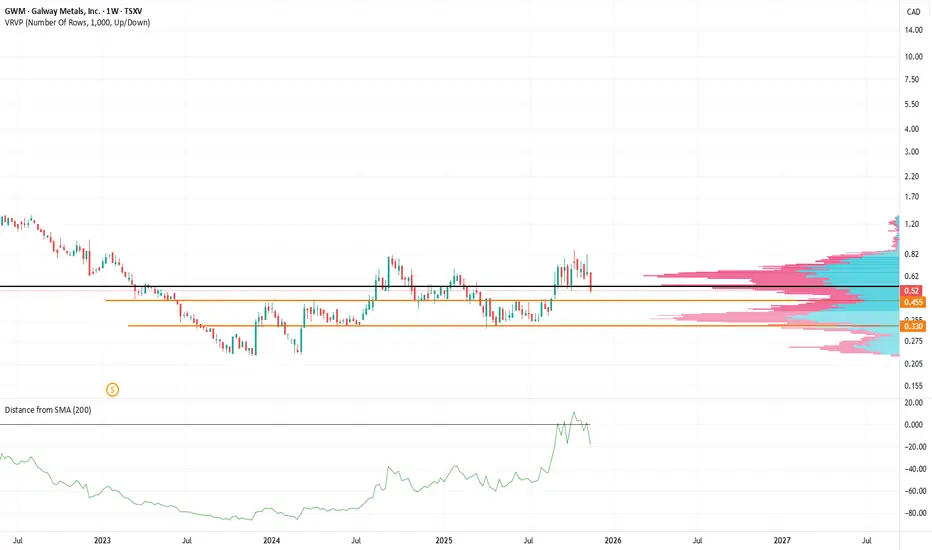
TSE:CAS Cascades Inc — Swing Trade==============================================
TSE:CAS — Swing Trade Plan Analysis
==============================================
**1. Overview**
* **Price:** 12.27
* **Trend Filter:** Above 200 SMA (Strong long-term bullish trend.)
* **Best Setup Type:** This data presents a **Mean Reversion / Pullback Buy in a Strong Uptrend** setup. The stock is in a confirmed bullish trend across multiple timeframes (Price > EMA20 > EMA50 > SMA200), yet has pulled back to its 2-day low, showing extreme oversold conditions on the short-term RSI(2). This suggests a high probability of a bounce continuing the broader uptrend.
**2. Trend Analysis**
* **EMA/SMA Relationship:** Price (12.27) is trading above all key moving averages (EMA20: 11.87, EMA50: 10.99, SMA200: 9.77). Furthermore, the shorter-term EMAs are above the longer-term MAs, indicating a healthy and robust uptrend across short, intermediate, and long timeframes.
* **Distance from EMA20:** At 3.35% above EMA20, the price is slightly extended but indicates strong bullish momentum. The current pullback to the 2-day low might be seen as a retest or a short-term consolidation before moving higher.
**3. Mean Reversion**
* **RSI(2):** An RSI(2) of 7.74 is *extremely* oversold. This is a strong indicator for a short-term mean reversion bounce, especially when coupled with an underlying uptrend.
* **Down-streak:** 0. This implies the current day is either the first down day or the stock is at a low without consecutive down days, supporting the idea of a potential bounce from a fresh low.
* **Price vs 2-Day Low:** 0.00%. The current price is exactly at the 2-day low (12.27). This further reinforces the oversold condition and identifies the current price as a potential support level for a bounce.
**4. Key Levels**
* **Support:**
* Immediate: 12.27 (Current price, 2-Day Low)
* Previous 14-Day High (now likely support due to breakout): 11.90
* Stronger: 14-Day Low at 11.59.
* Dynamic: EMA20 at 11.87, EMA50 at 10.99.
* **Resistance:**
* Immediate: 2-Day High at 12.60.
* **Volatility:**
* ATR(14): 0.70 (Useful for stop loss and target projections)
* ADR(20): 0.32 (Indicates typical daily movement range)
**5. Volume**
* **Volume Today (170.09K)** is currently below the 20-day average (272.74K). This can be a constructive sign on a pullback, suggesting a lack of strong selling conviction.
* **Volume Trend: Volume Rising.** This suggests a general increase in trading activity in recent periods, supporting the overall bullish momentum despite today's current volume being below average.
**6. Market Risk**
* **VIX: 27.66.** This is an elevated VIX level, indicating higher market volatility and increased risk. This suggests a need for caution and reduced position sizing.
**7. Trade Plan**
* **Entry:** 12.27 (As provided and aligns with the 2-day low and oversold conditions for a bounce).
* **Stop:** Using structure, placing a stop just below the 14-Day Low of 11.59. A stop at **11.55** (approximately 1.03x ATR below entry) clears this key structural support.
* **Target 1:** The nearest resistance level, which is the 2-Day High.
* Target 1: **12.60**
* **Target 2:** An extension target, projecting beyond immediate resistance. Considering the strong underlying trend, a move equal to 1x ATR above Target 1.
* Target 2: 12.60 (2-Day High) + 0.70 (ATR) = **13.30**
* **Position Size:** Adjust position size downwards due to the elevated VIX (27.66). Consider reducing by 25-50% from your normal risk allocation.
**8. Invalidation Conditions**
The setup is invalidated if:
* Price closes below the stop loss level of **11.55**.
* Price breaks and holds below the 14-Day Low (11.59), indicating a deeper pullback or trend reversal.
* Significant deterioration in broader market conditions (e.g., VIX spikes further, major indices show extreme weakness).
* Price fails to show any bullish momentum or bounce action within the next trading period.
**9. Risk-to-Reward (R:R)**
* **Entry:** 12.27
* **Stop:** 11.55
* **Risk per share:** 12.27 - 11.55 = **0.72**
* **To Target 1 (12.60):**
* Reward per share: 12.60 - 12.27 = 0.33
* **R:R (to T1): 0.33 / 0.72 = 0.46:1** (This is a low R:R for a full trade; Target 1 serves as an initial hurdle or partial profit-taking level).
* **To Target 2 (13.30):**
* Reward per share: 13.30 - 12.27 = 1.03
* **R:R (to T2): 1.03 / 0.72 = 1.43:1** (This provides a more acceptable risk-to-reward ratio for a swing trade, assuming the target extension is reached)."
 Long
Long
Target BuyIt appears I’ve miscalculated and sellers are targeting .25ish. I haven’t bought yet but I’ll be buying here. It looks like it’ll drop another leg down to that price.
Short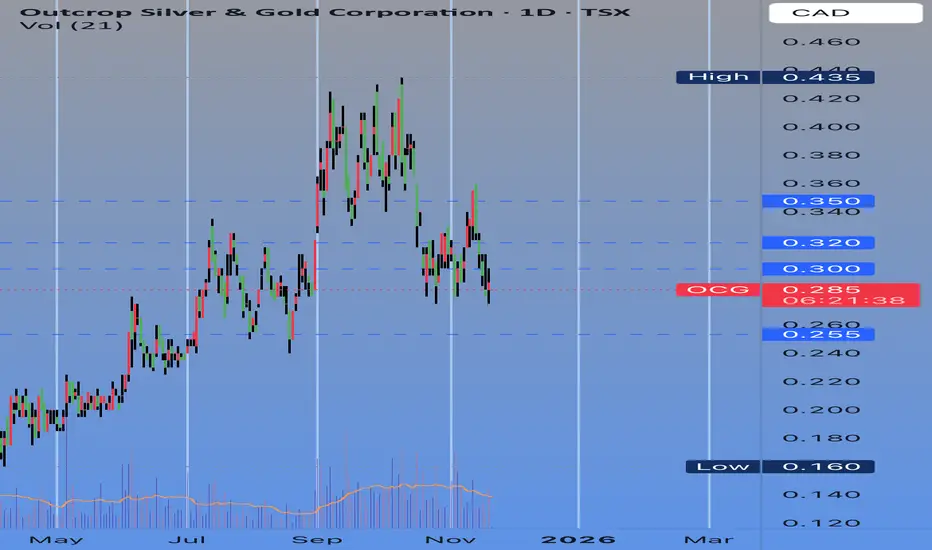
The kettle is boiling for Outcrop A move above this thick red cloud will be wonderful for holders of this stock. Above that, the (RED) 10 year moving average would be the target.
If this drives higher, expect the thick black lines to be major resistance and good times to take profits.
Long
HydroGraph Clean Power (CSE: HG) - Swing TradeHydroGraph Clean Power (CSE: HG) continues to act like a classic momentum micro-cap: fast expansions, hard pullbacks, and very technical-driven flows. The long-term trend is still intact, but the latest dip into trendline support gives a fresh asymmetric setup — especially with RSI(2) at 3.27, which is deep-oversold territory.
🏢 Quick Company Snapshot
HG is a graphene/hydrogen tech play with no meaningful revenue yet, but a ton of speculative attention. The stock went parabolic this year and continues to behave like a momentum vehicle rather than a fundamentally anchored name. That’s fine — as long as you trade it like one.
📈 Price Action & Catalysts
Momentum remains bullish overall. HG has respected the rising trendline for months, bouncing cleanly each time it tagged the 50-day SMA or short-term support.
Catalysts remain mostly sentiment-driven:
• Graphene/clean-tech hype rotation
• Patent/technology announcements
• Low float + momentum traders piling in
• No negative news — pullback is technical, not fundamental
Risks:
• Dilution (common for micro-caps)
• Liquidity disappears fast on red days
• Parabolic charts unwind violently if support cracks
🪙 Industry Context
Micro-cap clean tech is still getting bid, but the sector is volatile. HG drastically outperformed peers over the last 6–12 months — meaning pullbacks can get sharp and exaggerated.
📐 Technical Breakdown (Chart-Specific)
Your chart shows:
Trend:
Still up. Price is above the 200-SMA and sitting directly on the rising trendline + 50-SMA area.
Support Zones:
• Primary: 3.00 – 3.10
• Trendline: ~3.20
• Deeper: 2.70 (50-day SMA)
• Major floor: 1.41
Resistance Zones:
• 3.73 (local resistance)
• 4.50+ (measured-move target + previous wick zone)
RSI(2):
3.27 — ultra-oversold. Historically on this ticker, RSI2 < 5 has often marked swing lows or immediate bounces.
Volume:
Still healthy. No signs of heavy distribution — selling is orderly.
Pattern:
A clean ascending channel + pullback to trendline. This is textbook Minervini VCP-style behaviour (volatility starting to tighten after spikes).
🎯 Trade Plan (TradingView Style)
Entry Zone:
3.15 – 3.35 (trendline retest + ultra-oversold RSI2)
Stop:
2.88 (below trendline + below recent swing low)
Target:
4.50 (previous resistance + projected swing extension)
R/R:
≈ 2.5–3.0R depending on entry
Alternate Setup:
If price fails the trendline and flushes to 2.70 (SMA50), that becomes the new A+ bounce zone — but only if volume stays controlled.
🧠 My Take
This is one of the cleaner micro-cap momentum pullbacks I’ve seen in weeks. Trend is intact, RSI(2) is screaming oversold, and price is resting directly on a long-respected trendline. The setup is simple: if buyers defend this zone, the bounce to 3.70–4.50 is very realistic. If 3.00 breaks with volume, step aside and wait for 2.70.
This is pure technical trading — not investing — but the structure is absolutely there.
 Long
Long
Long Galaxy (CAD)This trade on Galaxy Digital (TSX: GLXY) is bullish, aiming for a rebound within an uptrend channel:
Entry: Near $40.48 (oversold conditions: RSI and Stoch low)
Targets: $49.17 (Fibo 0.382), $60.34 (Fibo 0.5, channel top)
Stop loss: Sell if price closes below the lower channel support ($36.06).
GLong

Daily Outlook on GSVR Guanajuato Silver CompanyThis is my updated daily outlook on TSXV:GSVR . The last outlook has played out pretty well so far (see linked publications), will the next leg?
We are at the point in the chart were yellow wave (3) could be underway, if so we should see a strong move higher with GSVR potentially moving 150+ %.
More comments on the chart.
 Long
Long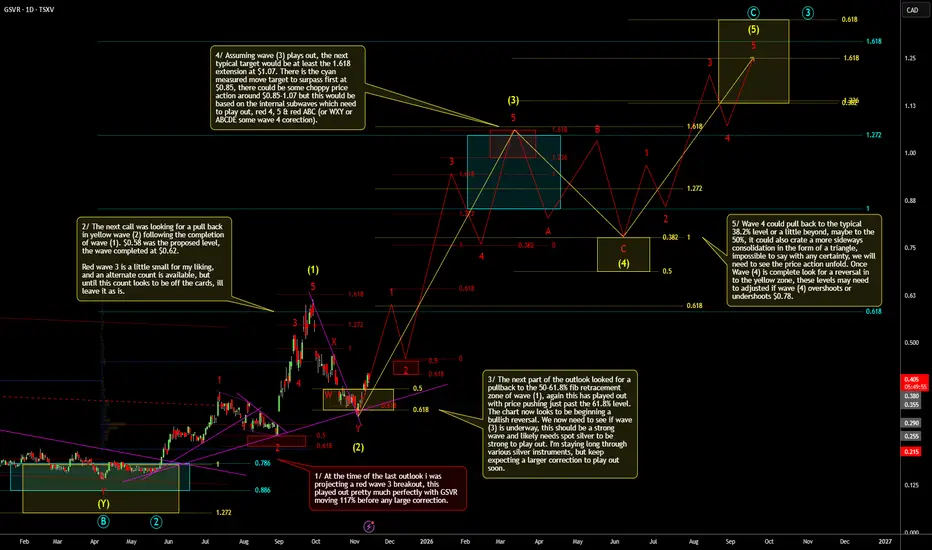
Aecon Group Inc. (TSX: ARE) — Swing Trade💰 Aecon Group Inc. (TSX: ARE) — Swing Trade Breakdown
Chart Date: Nov 13, 2025
RSI(2): 3.11 (deep oversold signal)
🏢 Company Snapshot
Aecon Group is one of Canada’s leading infrastructure and construction companies — active in transportation, utilities, and industrial projects. The stock has been trending higher since mid-2024, supported by strong backlog growth and resilient margins in public and energy projects.
📈 Fundamentals
Valuation remains moderate with a P/E around 9×, a healthy 3.4% dividend yield, and a manageable debt-to-equity ratio near 0.6. Free cash flow and liquidity are solid, positioning Aecon to capitalize on new government-funded infrastructure spending. Fundamentally sound and cash-generative — ideal for steady accumulation during pullbacks.
🔍 Technical Setup
ARE recently pulled back from its October peak near CAD $35 to test the 50-day moving average around $27–28, printing a strong RSI(2) oversold reading at 3.11 — historically a high-probability bounce zone on this ticker.
Price remains above the 200-SMA (~$21), confirming a sustained uptrend. Volume has stabilized after the post-earnings surge, showing orderly profit-taking rather than panic.
The pattern resembles a textbook pullback within an ongoing uptrend, where previous “BUY” signals at the 50-SMA have consistently led to multi-week rallies.
🎯 Trade Plan
Entry Zone: $27.00 – $27.50, near 50-SMA and RSI(2) signal confirmation.
Stop Loss: $25.80, below the 50-SMA and recent swing low.
Target: $31.50 – $33.00, near prior resistance and measured-move projection.
Risk/Reward: ~2.5× potential return to risk.
Aggressive traders may scale in at current levels; conservative traders can wait for a bullish reversal candle or reclaim of $28.00 with uptick in volume.
🧠 Swing Trader’s View
Aecon is in a bullish intermediate trend with short-term oversold momentum. RSI(2) at 3.11 is one of the lowest readings of 2025 — typically preceding a relief rally. As long as price holds above $26.00, the 50-SMA should act as dynamic support.
This setup aligns with prior buy triggers seen earlier in the trend (August and September), both leading to strong continuation swings.
💡 Outlook (Next 1–3 Weeks)
Expecting a technical rebound toward $31+ if the 50-SMA holds.
Favouring a buy-the-dip swing targeting mid-November strength — confirmation comes with an RSI(2) cross back above 10 and volume expansion off the 50-day line.
 Long
Long
$RAIL.CN looks to use support levels for a bounce $RAIL.CN used support levels nicely for a bounce. Looks ready to test resistance at .60 CAD next. There is significant upside on the chart when that falls.


Thinkific Labs (TSX: THNC) - Swing Trade💰 THNC — Swing Trade Breakdown (TSX)
🏢 Company Snapshot
Thinkific Labs (TSX: THNC) is a Vancouver-based SaaS company that enables creators and enterprises to build, market, and sell online courses. It’s been drawing attention recently after stabilizing near multi-month lows, with earnings on deck and improving cash flow signaling a possible turnaround setup.
📊 Fundamentals
THNC trades at roughly 180× earnings (TTM) — stretched versus typical software peers around 20–40×, though its profitability base is small.
P/B is ~2.4×, which is reasonable given its strong cash position (~C$71M) and minimal debt (D/E ≈ 0.04).
ROE sits around 1.6%, showing that profitability is still in the early stages of improvement.
It doesn’t pay a dividend, staying fully growth-focused.
Free cash flow sits near C$12M, giving it enough flexibility to reinvest while maintaining a solid liquidity cushion.
Summary: Fundamentally sound balance sheet and cash reserves, but expensive valuation and low profitability — typical for an early-stage SaaS recovery story.
📈 Trends & Catalysts
Revenue growth is soft but positive (+1.6% QoQ).
EPS has turned slightly positive — small profits are emerging, marking a potential inflection point.
Cash flow and liquidity continue improving, with consistent positive free cash flow.
Upcoming Q3 2025 earnings (Nov 12) could serve as a catalyst, especially if margins expand.
Risks include rich valuation, competitive pressure in the e-learning space, and lingering weakness in software sentiment.
🪙 Industry Overview
The software and e-learning sector has been mixed. Over the past month, THNC is down roughly 11%, lagging peers. Over 12 months, it’s down about 27%, underperforming the sector amid a shift toward profitability and AI-driven platforms. Short-term sentiment is neutral to slightly bearish, but any strong beat in earnings could quickly flip that tone.
📐 Technicals
THNC closed around C$2.11, sitting slightly above its 50-day SMA (~C$2.05) — an area of near-term support.
The 200-day SMA (~C$2.41) looms overhead as a key resistance marker.
Momentum has cooled, but the stock is consolidating tightly between C$2.00 and C$2.15, showing signs of base-building.
Support sits at C$2.00–2.10, resistance around C$2.40–2.70.
Volume remains light (~50–80k shares/day), so watch for a breakout day with strong volume to confirm demand.
Pattern: Tight consolidation near support after a steep decline — potential for a reversal or relief rally if volume spikes.
RSI(2): Neutral — no oversold or overbought signal currently.
🎯 Trade Plan
Entry Zone: C$2.05–2.15 — ideal for accumulation near support or a 50-SMA retest.
Stop Loss: C$1.95 — below key support; invalidates base.
Target: C$2.70 — aligns with resistance and 200-SMA retest.
Risk/Reward: Approx. 2.7× (solid swing setup).
Alternate Setup: Breakout above C$2.50 on strong volume could trigger a momentum continuation toward the high C$2s.
🧠 My Take
THNC offers a low-risk swing setup with improving fundamentals and technical stabilization. It’s cash-rich, debt-light, and forming a potential base around C$2.00. While long-term momentum remains bearish (still below 200-SMA), short-term traders can target a bounce back to C$2.70 if earnings or sentiment improve.
My bias: Cautiously bullish — watching for entry near C$2.05 with tight risk below support and a 2:1+ R/R toward the C$2.70 zone.
 Long
Long
Richelieu Hardware Ltd. (TSX: RCH) - Swing Trade💰 RCH.TO — Swing Trade Breakdown (November 2025)
🏢 Company Snapshot
Richelieu Hardware Ltd. (TSX: RCH) is a Canadian importer, manufacturer, and distributor of specialty hardware and renovation supplies. It serves cabinetmakers, furniture builders, and DIY markets. The stock has been gaining attention for its steady fundamentals, clean chart structure, and possible upside if margins recover.
📊 Fundamentals
P/E: ~24.3× — Slightly above industry average (15-20×), showing investor confidence.
P/B: ~2.1× — Moderate valuation relative to peers.
Debt/Equity: ~0.28 — Low leverage and conservative balance sheet.
ROE: ~6.3% — Profitability still lagging high-quality peers.
Dividend Yield: ~1.65% — Balanced between growth and income.
Free Cash Flow: ~CAD 145 M TTM — Strong liquidity generation.
Cash on Hand: ~CAD 45–50 M — Solid short-term flexibility.
🧾 Summary: Healthy balance sheet, modest valuation, but needs stronger profitability to re-rate higher.
📈 Trends & Catalysts
Revenue Growth: +6.6% YoY to ~CAD 1.93 B — steady expansion.
EPS Trend: Slightly down (~-5% YoY) to ~CAD 1.53 TTM.
Cash Flow: Improving; strong FCF helps reinvestment and dividends.
Balance Sheet: Low leverage, improving liquidity metrics.
Catalysts:
Margin rebound potential if supply costs ease.
Renovation and housing activity supporting demand.
Quarterly earnings or guidance upgrade could trigger upside.
Risks:
Margin compression from materials and freight.
Slowing home improvement cycle.
Modest ROE limits institutional interest.
🪙 Industry Overview
Weekly: Up ~1-3% — mild momentum into renovation plays.
Monthly: Up ~5-8% — sector rotation favouring construction and housing.
12-Month: Outperforming broader materials group as defensive industrial supplier.
📐 Technicals
Price: ~CAD 36.93
50-SMA: ~CAD 36 → price trading above this level, confirming uptrend.
200-SMA: ~CAD 32.00 → long-term bullish structure intact.
RSI(2): ~9.76 → short-term oversold region, potential for mean reversion.
Pattern: Bullish flag forming after breakout.
Support: CAD 35.00 – 36.00 zone.
Resistance: CAD 40.50 – 41.50 zone.
Volume: Building on green days — accumulation phase likely starting.
🎯 Trade Plan
Entry Zone: CAD 37.00 – 38.00 near breakout retest or low-volume pullback.
Stop Loss: CAD 34.75 (below support).
Target: CAD 41.50 (prior highs).
Risk/Reward: ~2.5× setup — clean structure with manageable downside.
Alternate Entry: Breakout confirmation above CAD 39.00 on heavy volume.
🧠 My Take
RCH.TO looks like a solid medium-beta swing candidate: low debt, steady cash flow, and constructive technicals. Momentum is quietly building, and the chart shows a flag continuation pattern right above key moving averages.
I’m watching for a breakout through 39.00 to confirm momentum into the 41.50 resistance zone. Ideal risk entry remains in the 37-38 area with stops below 34.75.
📈 Bias: Bullish consolidation — targeting 8-10% swing upside over 1–3 weeks.
 Long
Long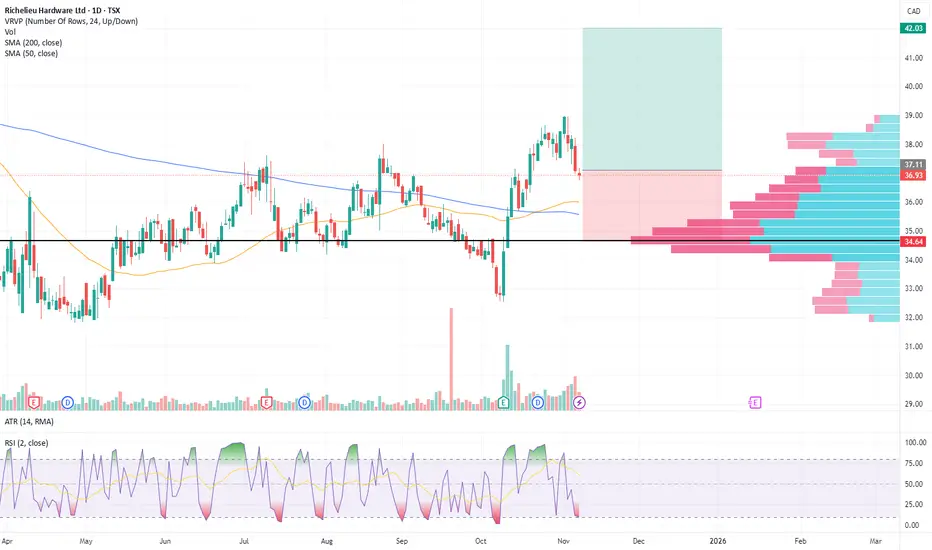
FLT LongVolatus Aerospace – Momentum + Structure Play
Entry: Took position on 15m CCI cross as price reclaimed short-term structure and broke above key moving averages.
Stop: Trailing stop managed manually behind weekly HK candles, trailing by two weeks to let trend breathe.
Profit Plan:
• 1/3 at +10% to book early strength.
• 1/3 at Fib 0.382 (~$1.04).
• Final 1/3 at Fib 0.50 (~$1.33) for the bigger swing.
Re-Entry: Will look to scale back in on clean pullbacks/consolidations if longer-term structure stays intact.
Why I like it:
Volatus has broken a multi-year downtrend base with expanding volume. Integrated drone & aerial solutions give it a moat in a growing niche. Technicals are aligning across multiple timeframes — this is my style of “early confirmation with room to run.”
FLong
